
2 easy AI @tradetravelchil @Tradersreality , M , Ws, Vectors Targets B4 the move. Need Consulation?
#VectorCandles #VectorCandle #VectorCandleTrading #MarketMakerMethod #MMXM #SmartMoneyConcepts #SMCTrading #LiquidityHunt #StopHunt #PriceAction #TradingSetup #TradingStrategy #ForexTrading #CryptoTrading #BitcoinTrading #BTCTrading #AltcoinTrading #DayTrading #Scalping #TechnicalAnalysis #TradingEducation #TradingTips #SniperTrading #TradeLikeAPro #LiquidityZones #VolumeSpreadAnalysis #CandlestickPatterns #TradingPsychology #ICTConcepts #OrderFlow

3
107
1,095
11,097

May 13
Want to know if a demand zone is really collecting orders before you buy?
Watch how I use Volume Spread Analysis (VSA) on TradingView with tick volume (since we don’t have real volume in FX) to confirm Effort = Result.
Basing action → strong inefficiency → demand crushes supply and leaves a beautiful gap. Then we get the leg-out candle with massive effort matching the result — exactly what you want to see when buying a zone.
This is straight Wyckoff Method 101. When effort matches result, you can sit back and let the impulse leg do its thing.
Master this confirmation and you’ll stop buying weak zones.
What’s your favorite way to confirm demand zones? Drop it below
#VSA #VolumeSpreadAnalysis #SupplyAndDemand #ForexTrading
2
152
ECLERX Daily chart analysis
-Price showing short term weakness making lower high on decreased volume showing exhaustion of demand
-Next bar at 3 shows ease of movement to downside producing good result to the downside on less volume
-price might come to retest the breakout level before moving upwards
#ECLERX #TechnicalAnalysis #PriceAction #VolumeSpreadAnalysis #NSE #IT
Disclosure & Disclaimer:
No holding in stock.
No financial Interest.
Not investment advice.

2
252
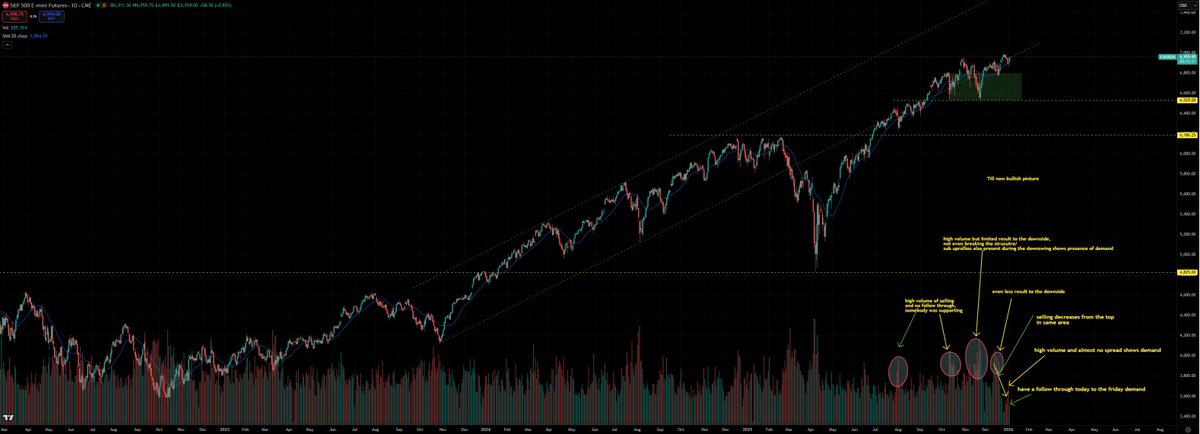
S & P 500 futures daily chart analysis
Current trading range shows signs of accumulation near the oversold area of long uptrend
Volume inside the trading range shows hidden demand characteristics
Please go through chart for detailed analysis.
Please feel free to give feedback
#S&P #NASDAQ #TechnicalAnalysis #PriceAction #VolumeSpreadAnalysis
2
245
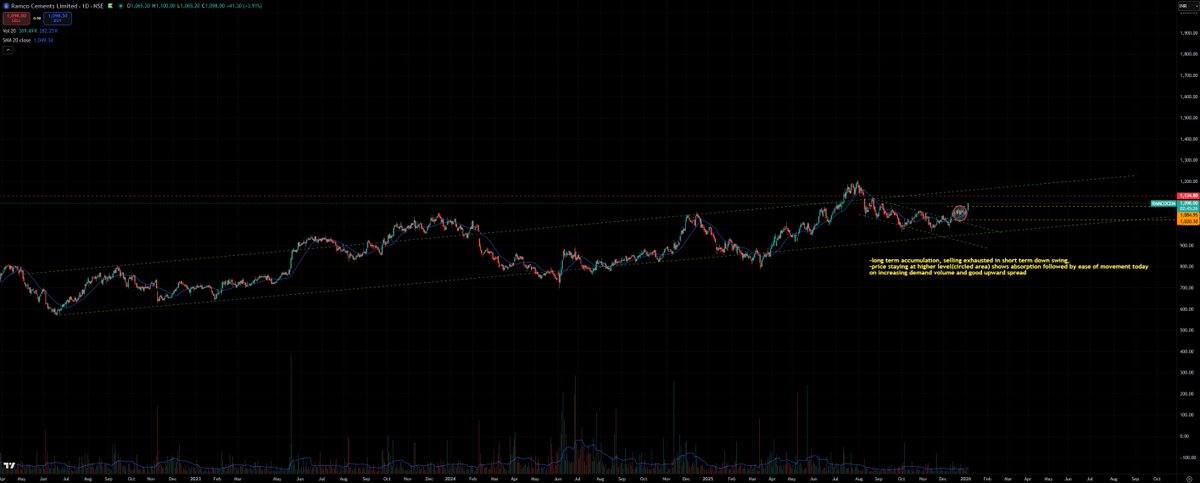
Ramco Cement Daily Chart
-long term accumulation, selling exhausted in short term down swing,
-price staying at higher level(circled area) shows absorption followed by ease of movement today on increasing demand volume and good upward spread
Disclosure & Disclaimer:
No holding in stock.
No financial Interest.
Not investment advice.
#RamcoCement #TechnicalAnalysis #PriceAction #VolumeSpreadAnalysis #Nifty50 #cement
2
279
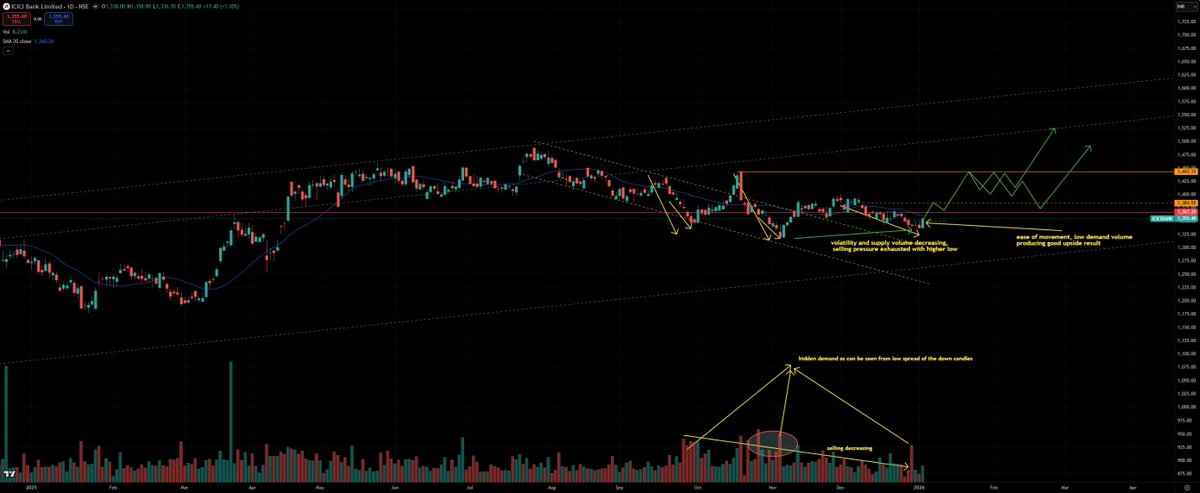
ICICI Bank Daily Chart
Bullish Bias
-Decreasing volume on subsequent downswing shows exhaustion of sellers
-Volatility is also decreasing in the downswings with last downswing making higher low
-Higher volume down candles within the structure does not have high down spread which shows absorption by demand
-Yesterday's bar shows some Ease of Movement to the upside with increasing volume from previous two days
sellers less-> higher low-> selling volume decreasing-> demand increasing-> Ease of Movement
Disclosure & Disclaimer:
No holding in stock.
No financial Interest.
Not investment advice.
#icicibank #TechnicalAnalysis #PriceAction #VolumeSpreadAnalysis #Nifty50 #Banknifty
2
990

17 Sep 2025
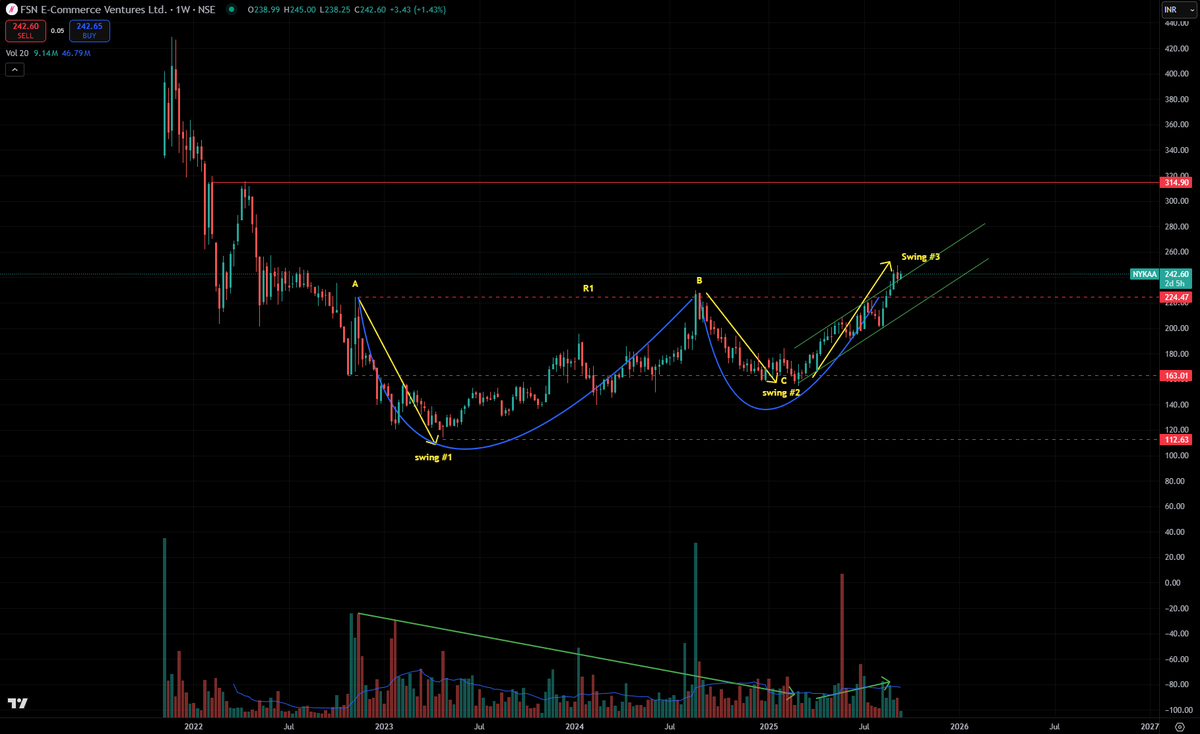
FSN Ecommerce (NYKAA) Weekly update: Bullish
-Selling Volume and volatility reduces from swing #1 to swing #2
-Price has retested the resistance R1 at point B and Swing #2 results in higher low at C showing exhaustion of supply
-Swing #3 broke out of resistance R1 with increasing demand volume and volume is not huge which is good and shows limited supply at resistance
-Last week showed some supply at overbought condition, supply is not extreme and should be absorbed sooner before price starts marching higher
-For pattern traders, structure also makes cup and handle pattern
#NYKAA #TechnicalAnalysis #PriceAction #VolumeSpreadAnalysis #NSE
Disclosure & Disclaimer:
No holding in stock.
No financial Interest.
Not investment advice.
2
3
395
17 Sep 2025
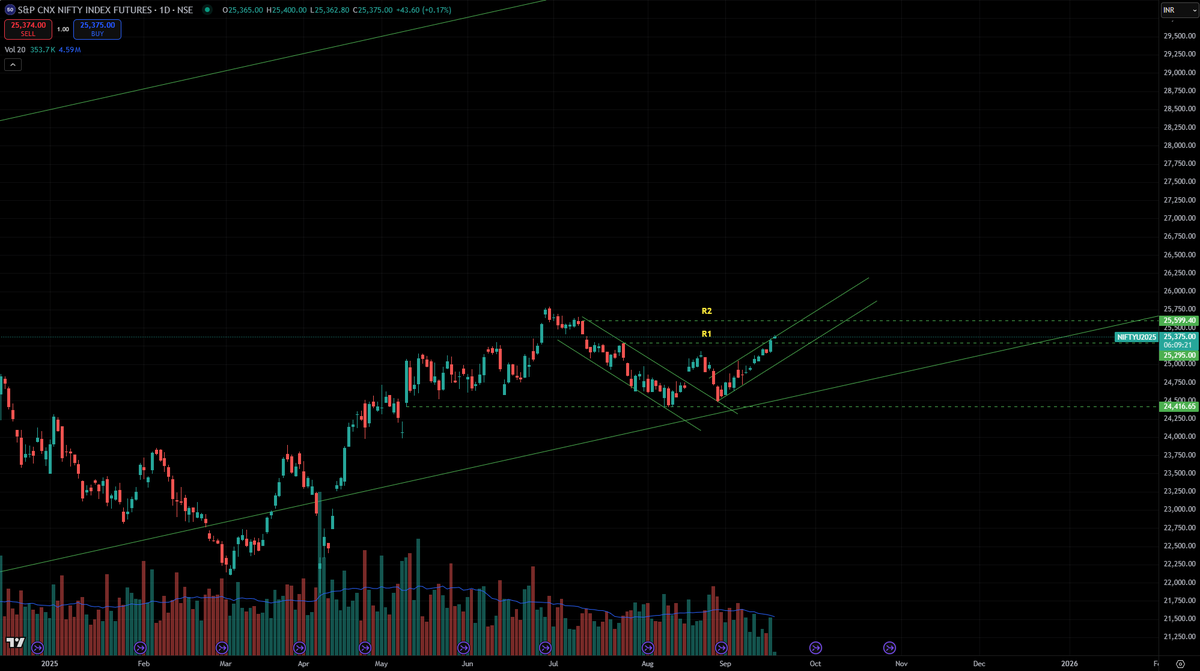
-Nifty future moved as expected. Currently moving higher on below avg volume showing limited supply
-Yesterday's bar had a increase in volume and also a good spread to the upside but limited extension above resistance R1 shows presence of supply near it
- Price is in over bought condition of upsloping channel, minor reaction might be possible before moving higher
#TechnicalAnalysis #PriceAction #VolumeSpreadAnalysis #nseindia
Disclosure & Disclaimer:
No holding in futures.
No financial Interest.
Not investment advice.
2 Sep 2025

is Nifty ready for a rally?
#TechnicalAnalysis #PriceAction #VolumeSpreadAnalysis #nseindia
Disclosure & Disclaimer:
No holding in futures.
No financial Interest.
Not investment advice.

3
4
574
2 Sep 2025
is Nifty ready for a rally?
#TechnicalAnalysis #PriceAction #VolumeSpreadAnalysis #nseindia
Disclosure & Disclaimer:
No holding in futures.
No financial Interest.
Not investment advice.
4
4
1,208
1 Sep 2025
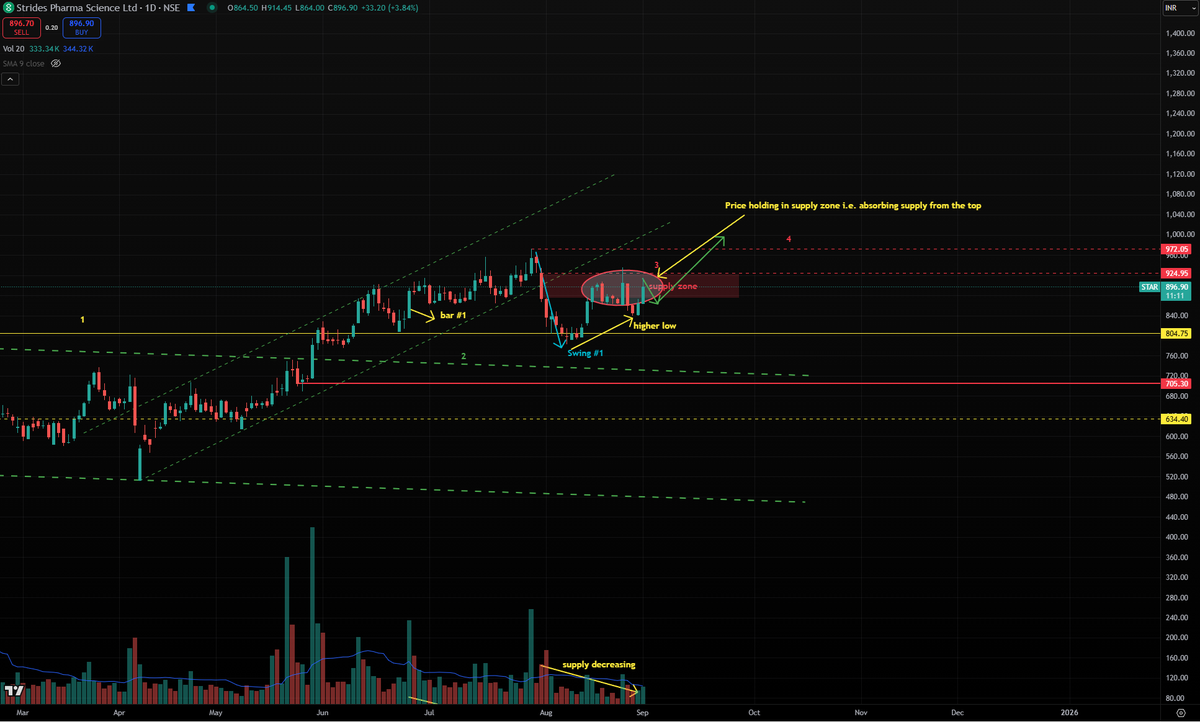
Strides Pharma (NSE: STAR) Daily Update
-Price staying in supply zone, absorbing supply from the top
- Today's bar shows buying but met with the supply at resistance ( did not break resistance)
- Overall selling volume in the supply zone decreases from the last time price was at this level
- Structure holds at a higher low
#StridesPharma #TechnicalAnalysis #PriceAction #VolumeSpreadAnalysis #NSE
Disclosure & Disclaimer:
No holding in stock.
No financial Interest.
Not investment advice.
14 Aug 2025
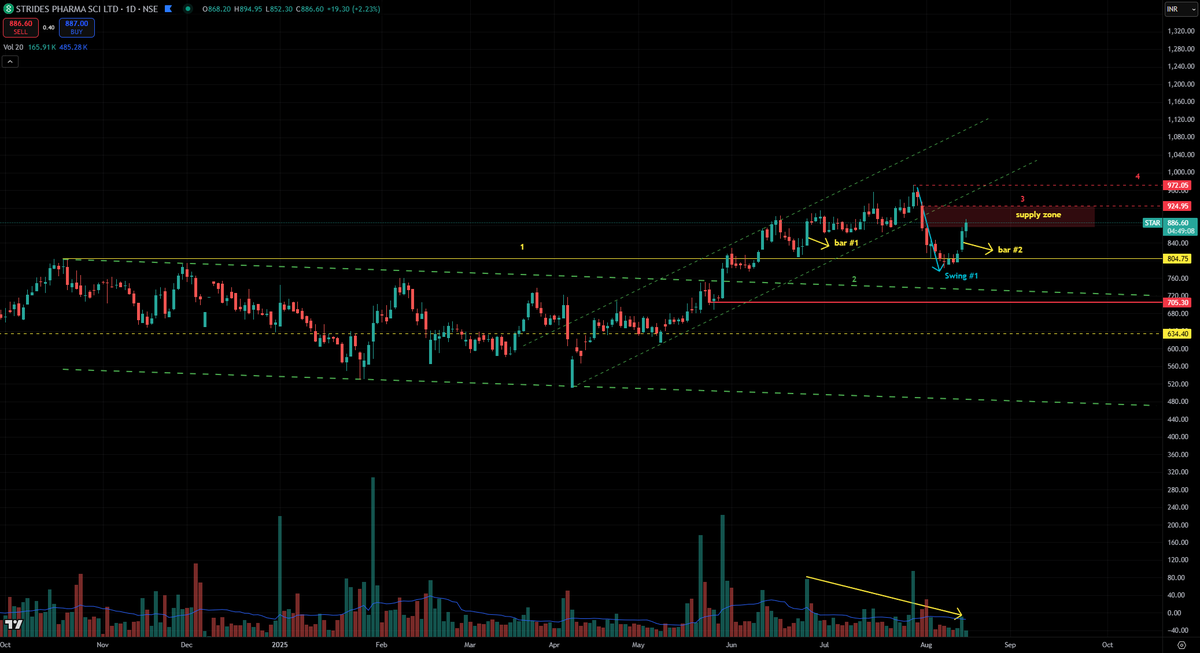
Strides Pharma (NSE: STAR) Daily Update
Reduced selling characteristics near the end of swing #1 as can be seen from low volume and small spread down candles. Price took support at line #1
#StridesPharma #TechnicalAnalysis #PriceAction #VolumeSpreadAnalysis #NSE
Disclosure & Disclaimer:
No holding in stock.
No financial Interest.
Not investment advice.
2
2
565
1 Sep 2025
Mphasis Daily Update
-Price holds above previous Ease of movement (EOM) bar combining with decreasing supply (volume) shows exhaustion of supply.
-Today's bar again shows EOM to the upside (similar volume and spread to the previous EOM bar) confirming bullish bias
#Mphasis #TechnicalAnalysis #PriceAction #VolumeSpreadAnalysis #NSE
Disclosure & Disclaimer:
No holding in stock.
No financial Interest.
Not investment advice.

21 Aug 2025
Similar Concept in Mphasis but stronger as trading range is upsloping
#Mphasis #TechnicalAnalysis #PriceAction #VolumeSpreadAnalysis #NSE

1
3
2
607
26 Aug 2025
Today's Nifty Futures 3min shows similar concept in opposite direction
#TechnicalAnalysis #PriceAction #VolumeSpreadAnalysis #SwingAnalysis #tradingrange #NSE
26 Aug 2025
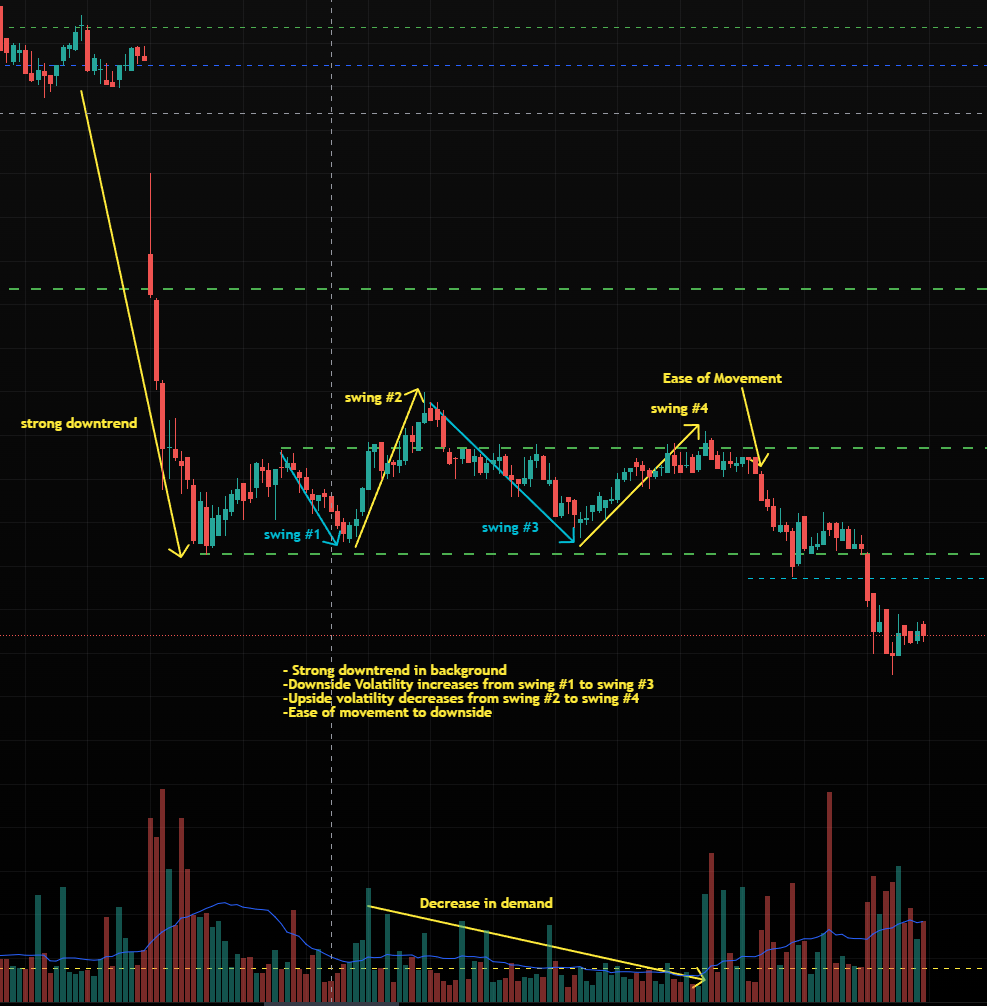
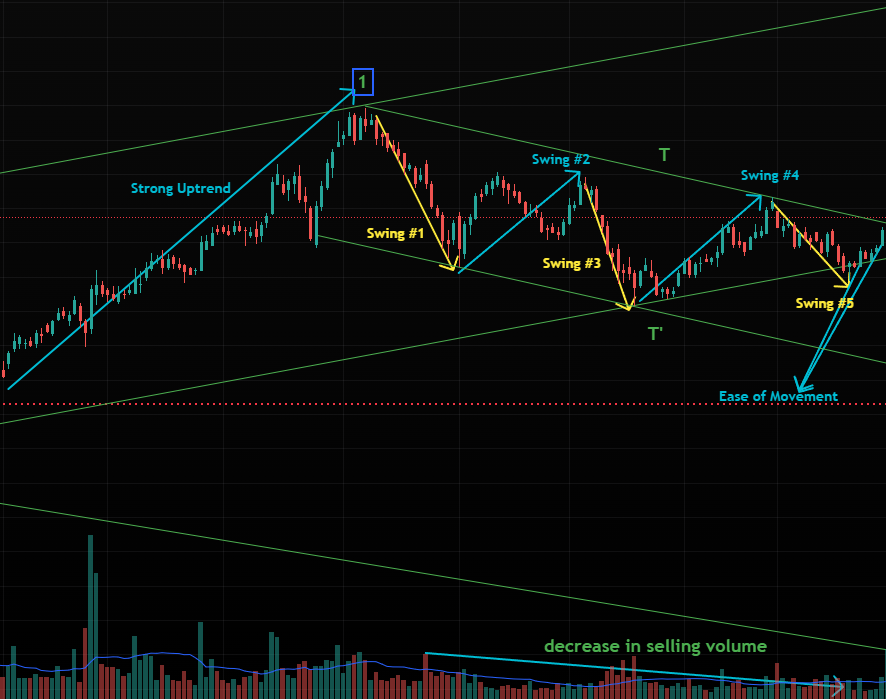
Concept-Swing Analysis within a trading range
1. Background
- Strong uptrend in place which ends at point #1
- Initial strong downward reaction through Swing #1 retraces only 60% of the upmove which is bullish
2. Comparing Swing #1 to Swing #3 to Swing #5
- Volatility to the downside decreasing means demand is improving in subsequent downswing
- Selling volume decreases in consecutive down swings means selling is getting exhausted
3. Comparing Swing #2 and Swing #4
- Swing #2 have deep downward reaction in between showing presence of supply
- Swing #4 have very shallow downward reaction in bewtween shows improvement of demand from swing #2
4. Ease of Movement
- Ease of movement means low effort (volume) produces good result (spread)
- In this case, Ease of movement is to the upside meaning less effort by demand is required to produce good upward price movement because of unavailability of supply
#TechnicalAnalysis #PriceAction #VolumeSpreadAnalysis #SwingAnalysis #tradingrange #NSE
2
5
523
26 Aug 2025
Concept-Swing Analysis within a trading range
1. Background
- Strong uptrend in place which ends at point #1
- Initial strong downward reaction through Swing #1 retraces only 60% of the upmove which is bullish
2. Comparing Swing #1 to Swing #3 to Swing #5
- Volatility to the downside decreasing means demand is improving in subsequent downswing
- Selling volume decreases in consecutive down swings means selling is getting exhausted
3. Comparing Swing #2 and Swing #4
- Swing #2 have deep downward reaction in between showing presence of supply
- Swing #4 have very shallow downward reaction in bewtween shows improvement of demand from swing #2
4. Ease of Movement
- Ease of movement means low effort (volume) produces good result (spread)
- In this case, Ease of movement is to the upside meaning less effort by demand is required to produce good upward price movement because of unavailability of supply
#TechnicalAnalysis #PriceAction #VolumeSpreadAnalysis #SwingAnalysis #tradingrange #NSE
1
3
2
876
25 Aug 2025
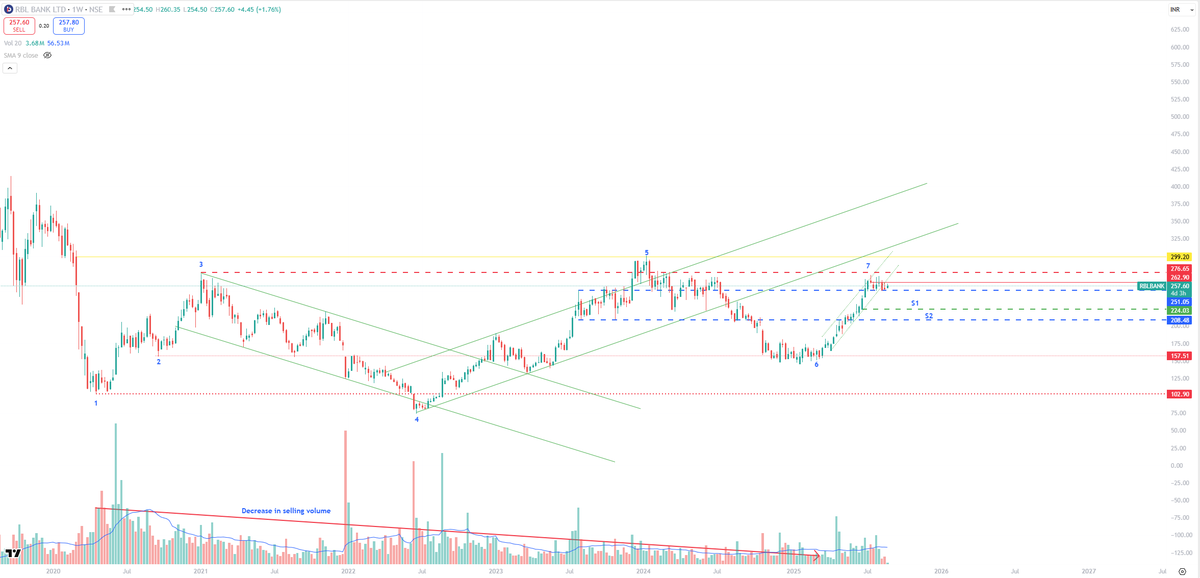
RBLBANK Weekly Update
-Overall structure looks bullish from Mar'20 onwards
-There is a decrease in selling volume from Mar' 20 (Point 1) and Mar'25 (Point 6)
-Current at Point 7, Supply looks in control. despite having good demand volume , price is unable to break above point 7
-Weekly candle starting 11th Aug shows ease of movement to the downside ( low volume and good downward result)
-Following week demand tries to break above this but failed
-Temporary short term reaction possible till support line S1/S2 before moving upwards
#rblbank #TechnicalAnalysis #PriceAction #VolumeSpreadAnalysis #NSE #OlgoInsights
Disclosure & Disclaimer:
No holding in stock.
No financial Interest.
Not investment advice.
2
3
397
24 Aug 2025
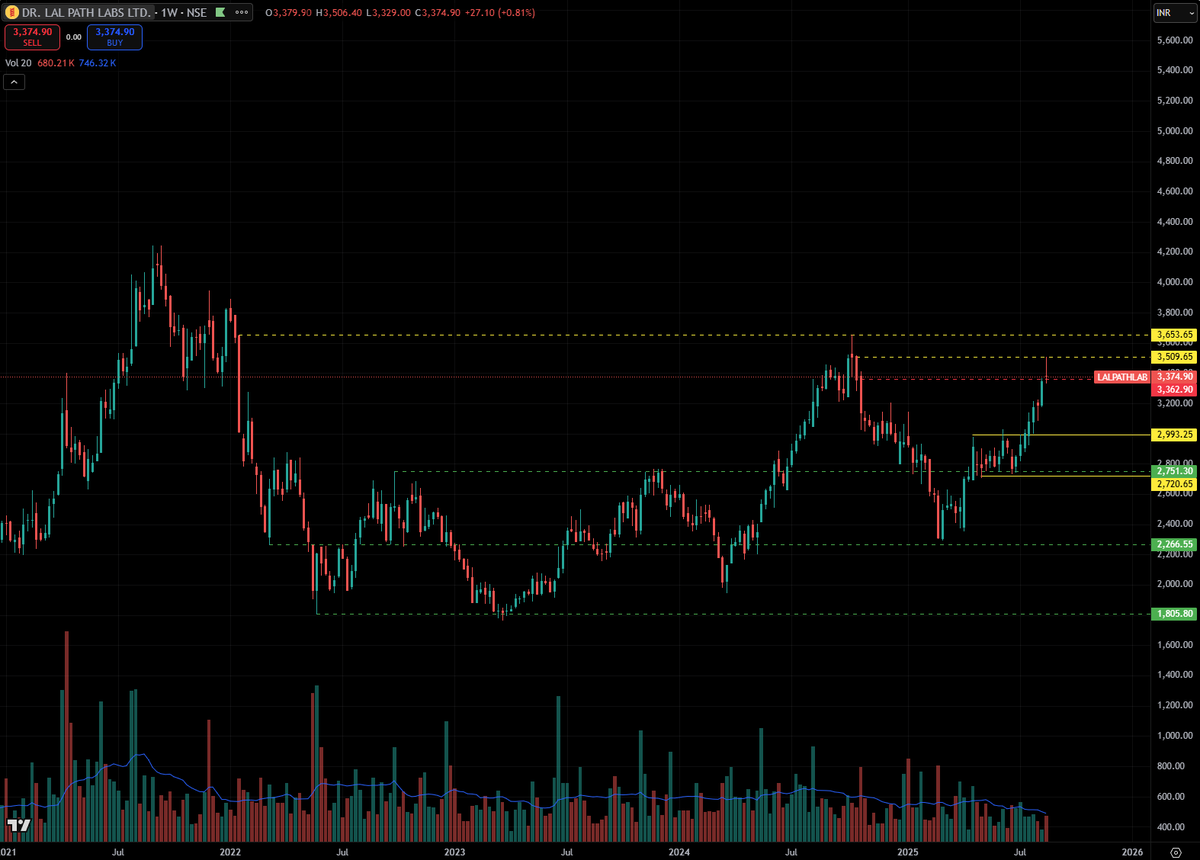
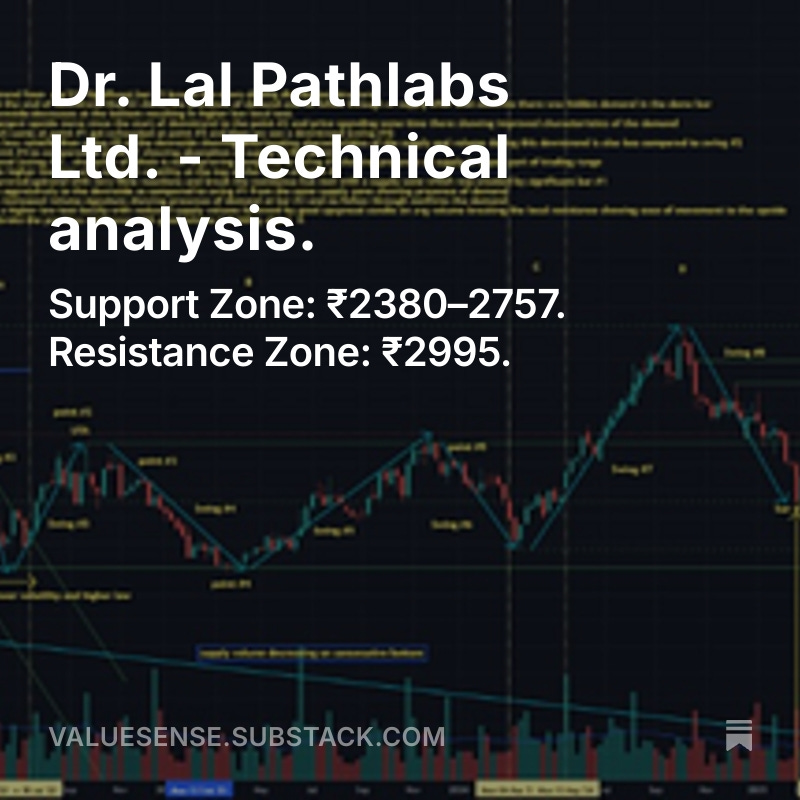
Analysis of the Shared View
1. Trading Range (₹2995 – ₹2757)
- The stock consolidated in this range for a few weeks.
- This acted as an accumulation / re-accumulation zone, giving the stock energy for the next move.
- Breakout above ₹2995 confirmed demand dominance.
2. Bullish Move to Previous High
- Price rallied up to the level of the volatile down candle of Oct 14, 2024.
- That candle likely represents a major supply zone, since heavy selling came in there previously.
- Retesting that zone is natural — smart money often checks if supply still exists.
3. Last Week’s Candle
- A supply tail (upper wick) slightly higher volume = supply is present.
- Indicates profit booking or short-term resistance at that old supply zone.
- Market participants may pause here to absorb supply before continuation.
#LALPATHLAB #TechnicalAnalysis #PriceAction #VolumeSpreadAnalysis #NSE #OlgoInsights
Disclosure & Disclaimer: No holding in stock. No financial Interest. Not investment advice.
4
4
616
21 Aug 2025
Similar Concept in Mphasis but stronger as trading range is upsloping
#Mphasis #TechnicalAnalysis #PriceAction #VolumeSpreadAnalysis #NSE
21 Aug 2025
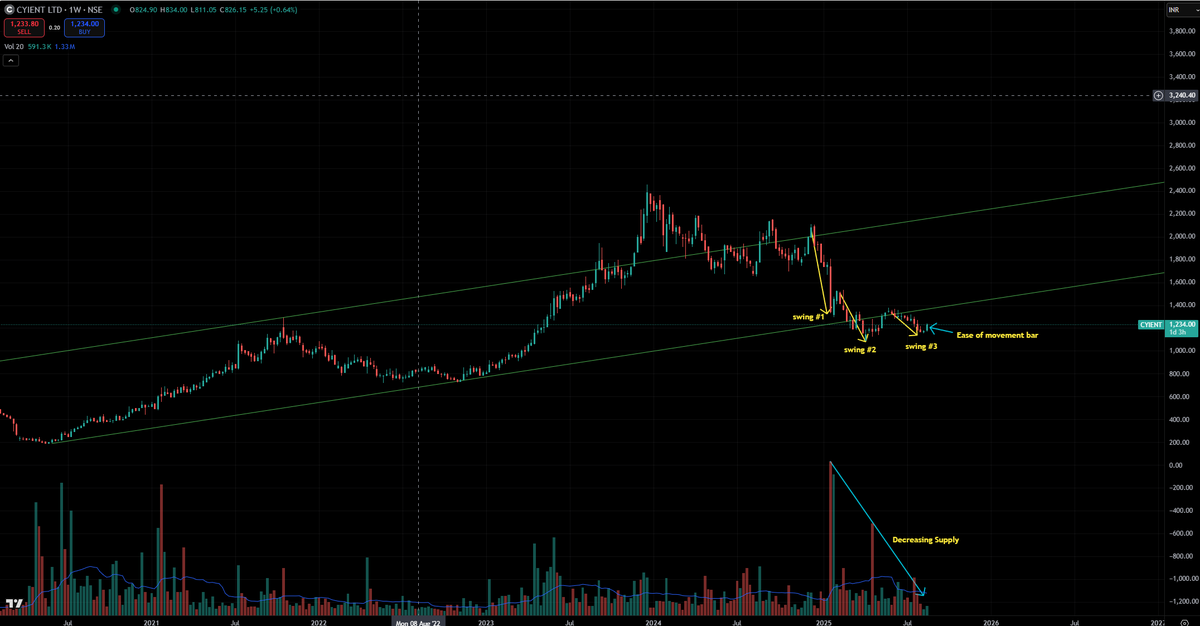
CYIENT Weekly Chart Update-Bullish Overview
-Oversold condition in long term up trending channel
-Downside volatility reduces from swing #1 to swing #2 to swing #3
-Decrease in selling volume
-Ease of movement to the upside (low volume and good result to the upside) showing unavailability of supply at this price
-View invalidate if price closes below 1150
#CYIENT #TechnicalAnalysis #PriceAction #VolumeSpreadAnalysis #NSE
Disclosure & Disclaimer:
No holding in stock.
No financial Interest.
Not investment advice.
3
2
1,122
21 Aug 2025
CYIENT Weekly Chart Update-Bullish Overview
-Oversold condition in long term up trending channel
-Downside volatility reduces from swing #1 to swing #2 to swing #3
-Decrease in selling volume
-Ease of movement to the upside (low volume and good result to the upside) showing unavailability of supply at this price
-View invalidate if price closes below 1150
#CYIENT #TechnicalAnalysis #PriceAction #VolumeSpreadAnalysis #NSE
Disclosure & Disclaimer:
No holding in stock.
No financial Interest.
Not investment advice.
1
835
14 Aug 2025
Strides Pharma (NSE: STAR) Daily Update
Reduced selling characteristics near the end of swing #1 as can be seen from low volume and small spread down candles. Price took support at line #1
#StridesPharma #TechnicalAnalysis #PriceAction #VolumeSpreadAnalysis #NSE
Disclosure & Disclaimer:
No holding in stock.
No financial Interest.
Not investment advice.
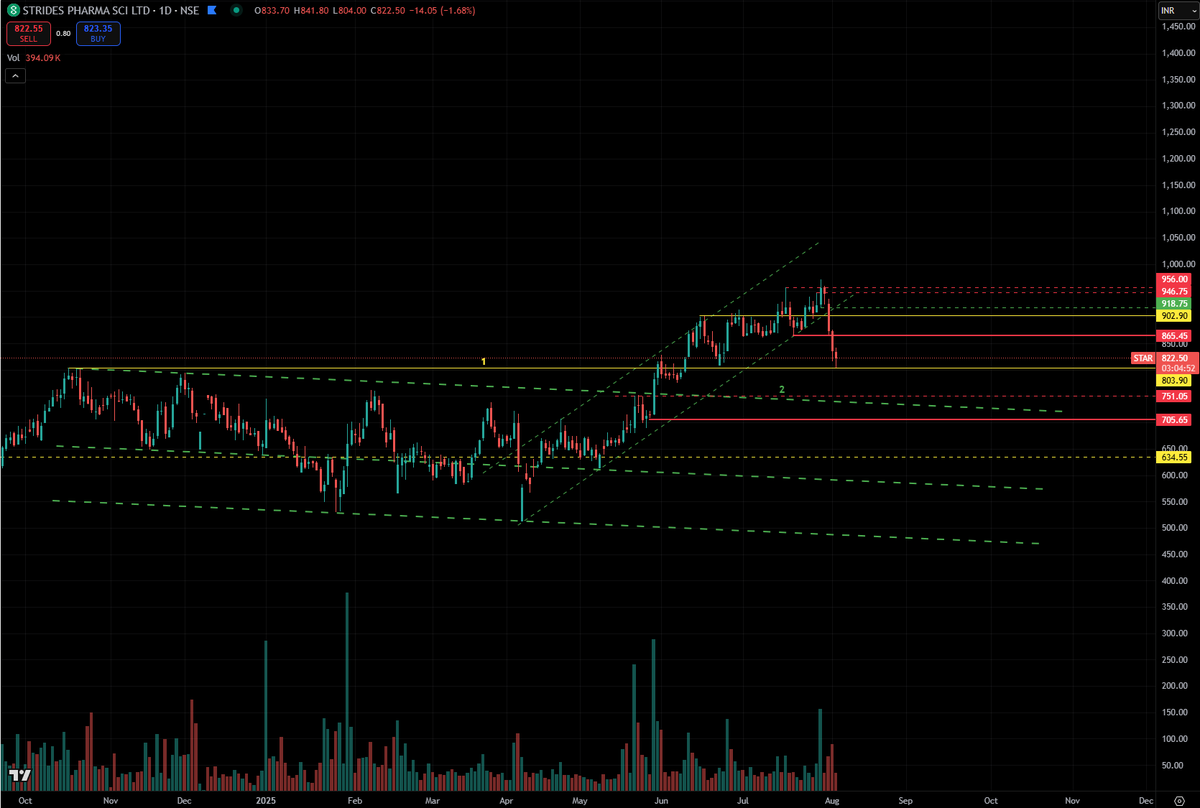
4 Aug 2025
Strides Pharma (NSE: STAR)
- Price did not go as expected and might be retesting the breakout of the long term resistance line 1 and is holding above it
- Demand is not able produce any result to the upside showing dominance of supply
- Price might retest the down sloping green resistance 2, breakout of which occurred on 29th may with big up spread candle on good volume
- If price breaks and close below 705 which is below the low of 29th May candle, long term view invalidates
#StridesPharma #TechnicalAnalysis #PriceAction #VolumeSpreadAnalysis #NSE
Disclosure & Disclaimer:
No holding in stock.
No financial Interest.
Not investment advice.
1
2
3
1,165
4 Aug 2025
Strides Pharma (NSE: STAR)
- Price did not go as expected and might be retesting the breakout of the long term resistance line 1 and is holding above it
- Demand is not able produce any result to the upside showing dominance of supply
- Price might retest the down sloping green resistance 2, breakout of which occurred on 29th may with big up spread candle on good volume
- If price breaks and close below 705 which is below the low of 29th May candle, long term view invalidates
#StridesPharma #TechnicalAnalysis #PriceAction #VolumeSpreadAnalysis #NSE
Disclosure & Disclaimer:
No holding in stock.
No financial Interest.
Not investment advice.

2
2
1,134
4 Aug 2025
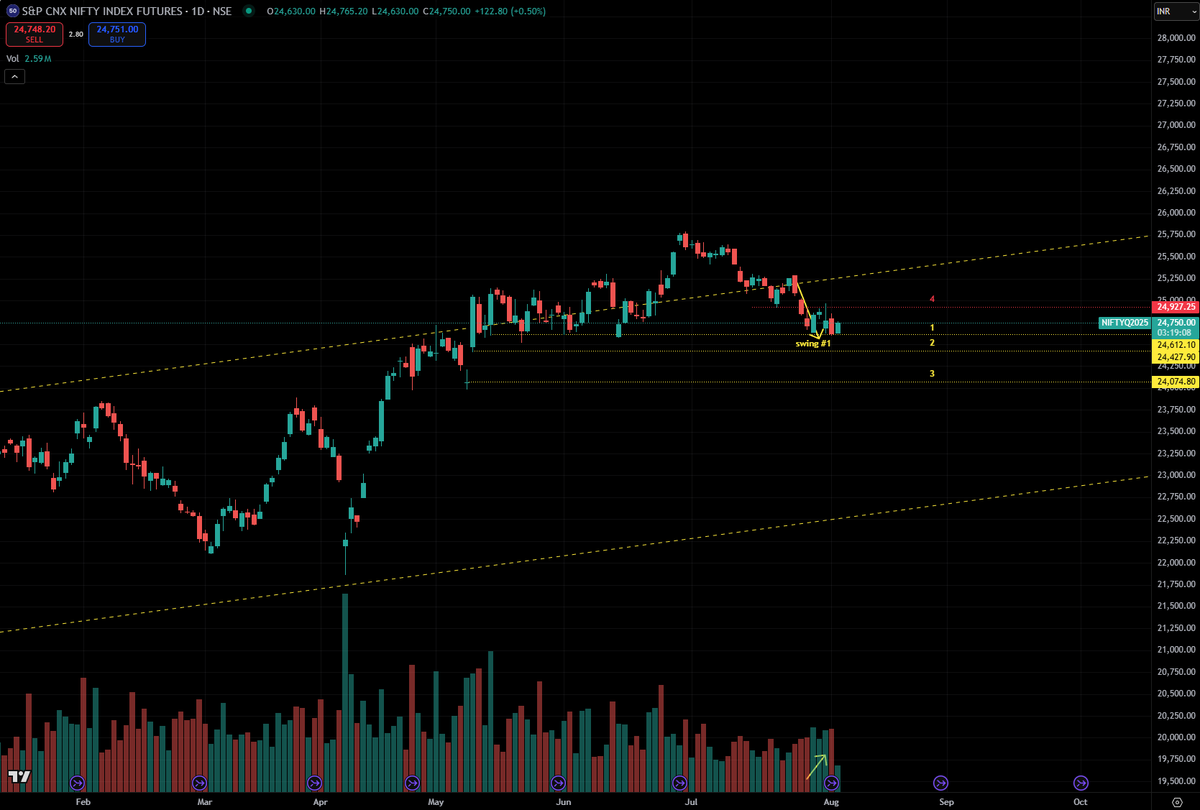
NIFTY FUTRUES DAILY
-Support line 1 is from the low of 15th May candle where the demand was highest, currently the price is holding here
-Price did not retrace much of the previous down swing #1 despite of expanding demand volume showing presence of overhead supply
-Price got rejected by the resistance line 4 drawn from the high of last down bar
-Comparing the price interaction with the support #1 in the previous instances, demand was aggressive and was able to push higher but this time it is not able to produce any result to the upside showing deterioration of demand
-Expecting price to break lower in the gap area between support line 2 and support line 3 and see if the demand emerges or not
-View invalidates if price closes above 24940
#NIFTY #PriceAction #TechnicalAnalysis #VolumeSpreadAnalysis #NSE
Disclosure & Disclaimer:
No holding in nifty futures.
No financial Interest.
Not investment advice.
28 Jul 2025
📉 NIFTY Futures – Breakdown With Bearish Intent
-Upspread and Volume decreasing on retest of breakdown of trend channel
-Bearish engulfing followed by strong downspread candle = ease of movement downside
-Clean break of previous support with follow-through
-last two day's gap down is a sign of weakness
- Expect further downside until:
Demand steps in (volume spike)
OR down candles lose spread (selling exhaustion)
#NIFTY #PriceAction #TechnicalAnalysis #VolumeSpreadAnalysis #NSE
Disclosure & Disclaimer:
No holding in nifty futures.
No financial Interest.
Not investment advice.

2
3
816