
19 Oct 2024
Hi all, the following #Stata #dataviz packages are now updated on SSC:
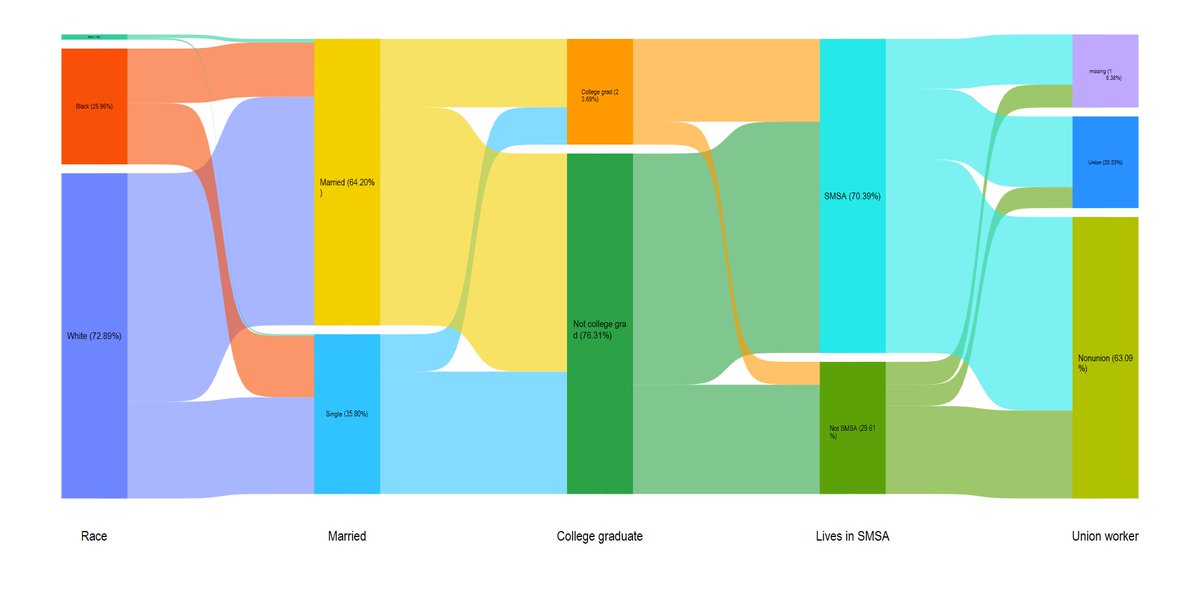
#alluvial v1.4
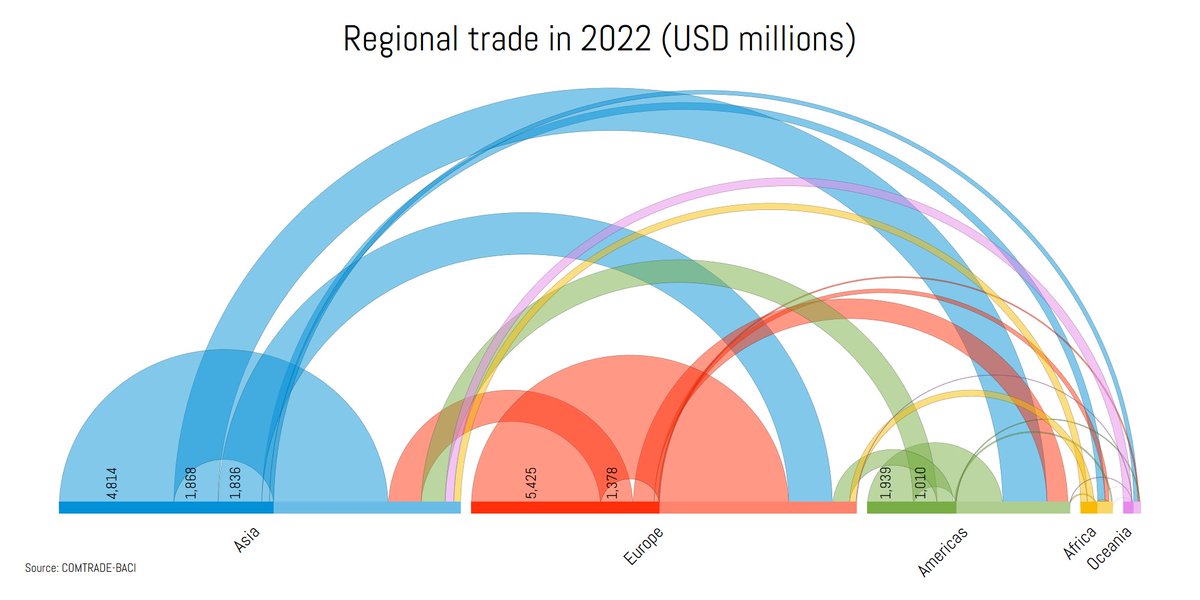
#arcplot v1.4
#bimap v2.1
#circlebar v1.6
#graphfunctions v1.4
#sankey v1.81
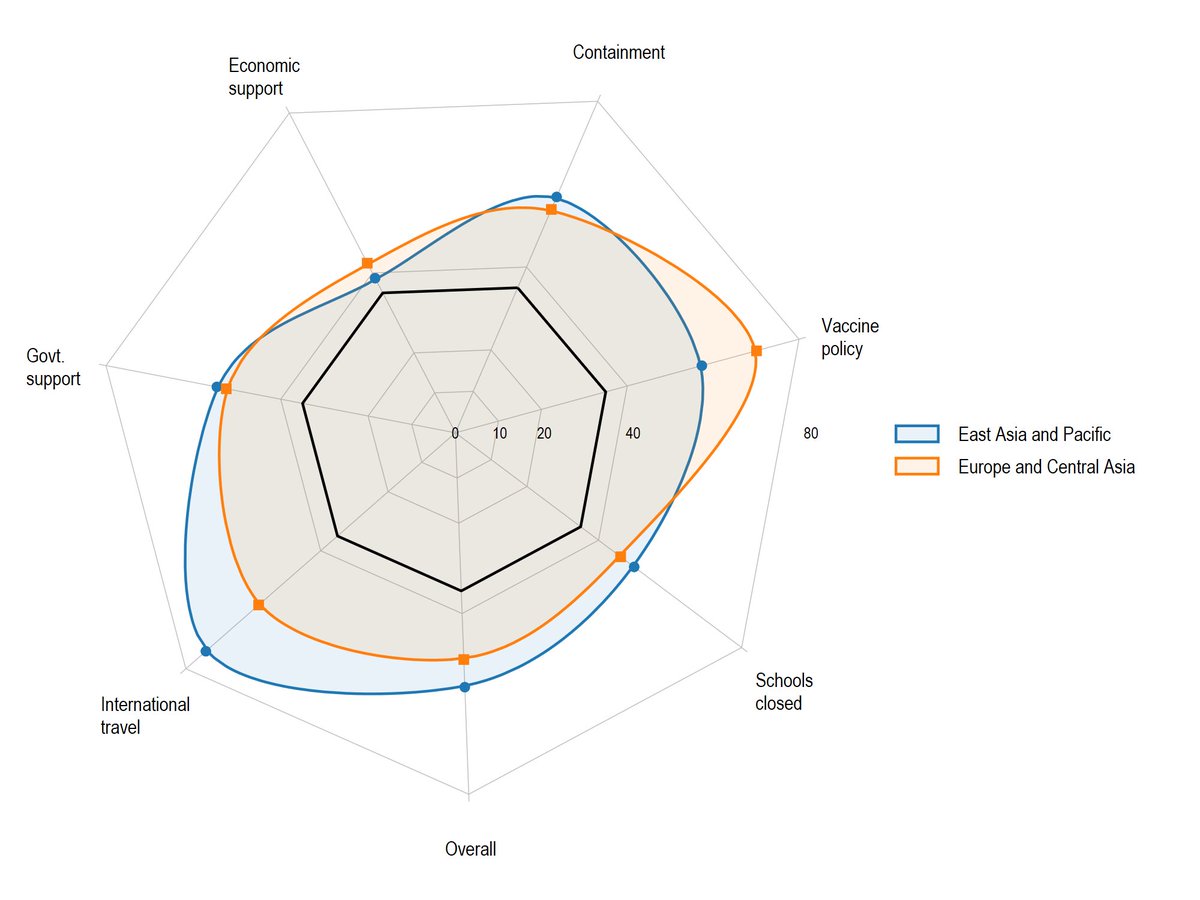
#spider v1.5
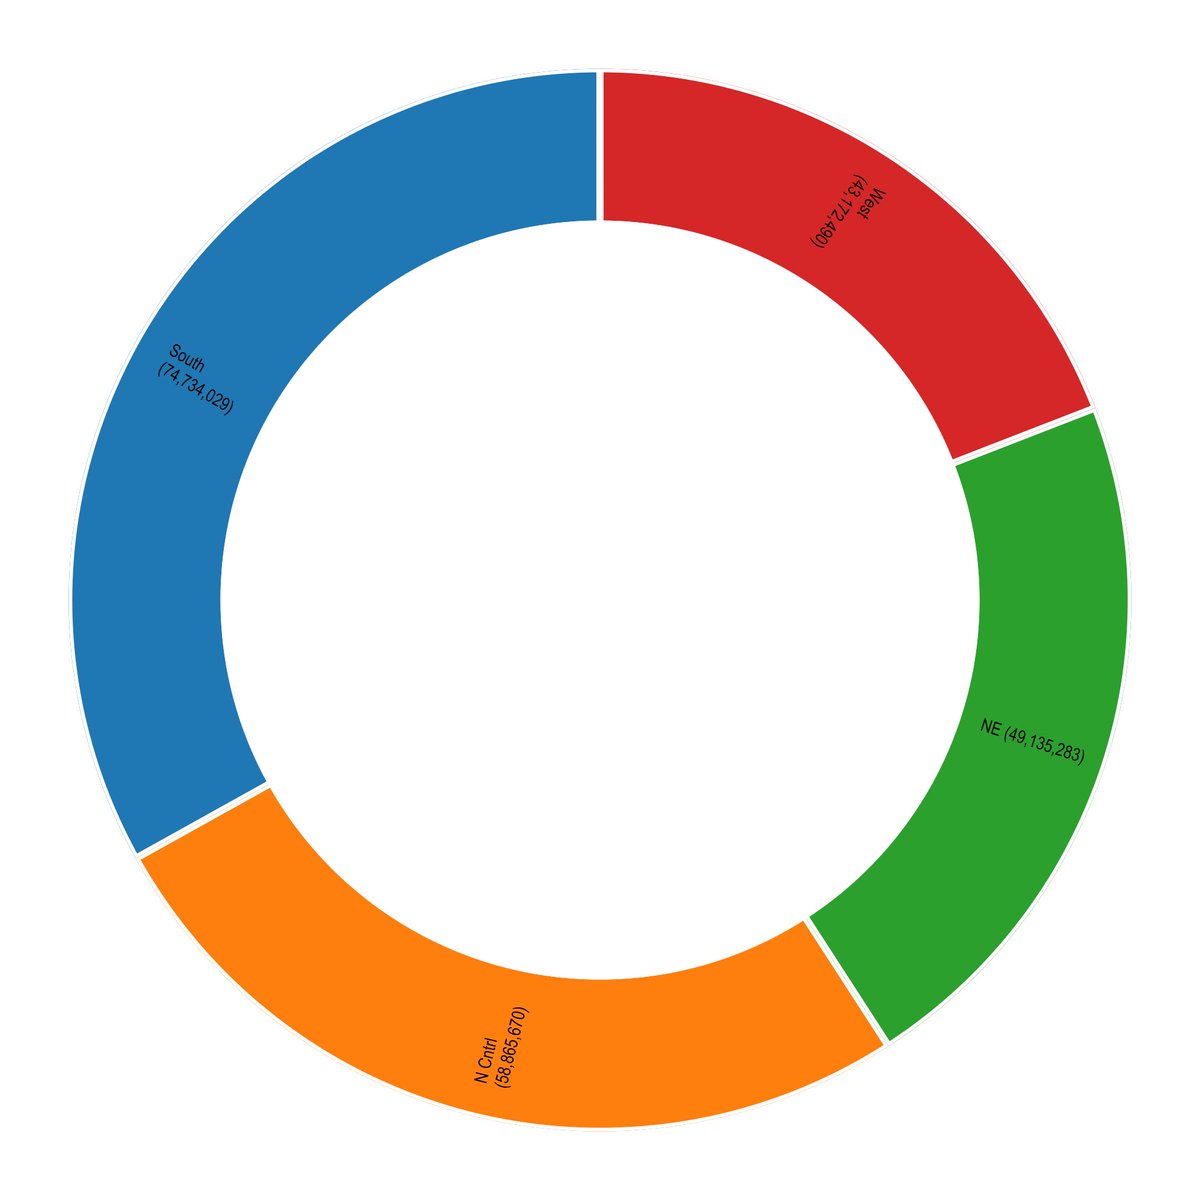
#sunburst v1.8
#treemap v1.6
#waffle v1.23
Overall changes:
👉 Most packages got better label wrapping via the new #graphfunctions package.
👉 Most package got support for weights (other will get it as well over time time).
👉 Some had internal functions ported over to a common graph generation framework (more on this earlier next year).
👉 Suggested citations added to each package. Please cite them and others you use!
Updates were based on project demands, and requests from clients and power users. Bugs from any source were given high priority.
Showcase:
Quite a lot of feature requests were added, of which four are showcased below:
💡 allivual weights word wrapping
💡 circlebar sorting weights reference lines near labels
💡 spider weights web grids reference lines
💡 sunburst weights extensions for donut plots
Detailed can be found in each package's repository. Links can be found here: github.com/asjadnaqvi
Please ⭐️ the ones you like and please use #GitHub for reporting issues and feature requests.

4
21
1,776
2 Oct 2024
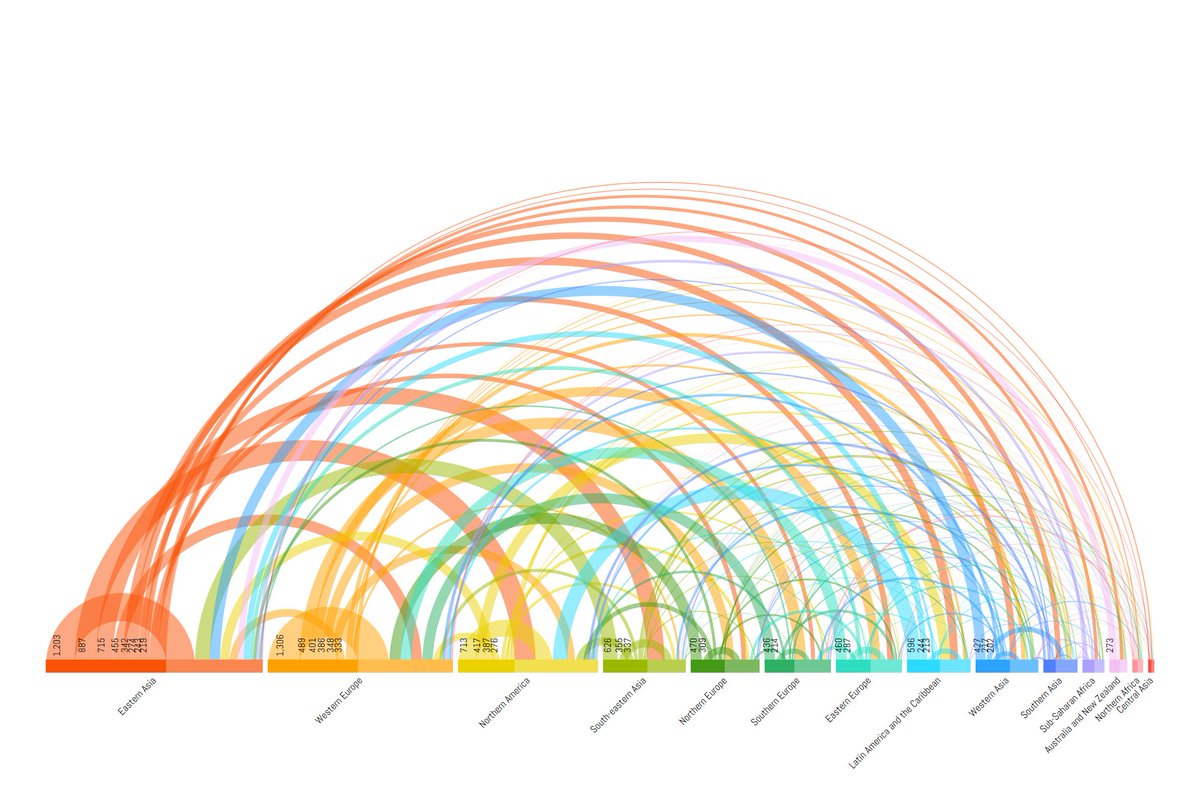
The #Stata #arcplot package is now bumped to v1.4 with the following updates:
- Fixed major bugs that were resulting in wrong outputs under certain conditions.
- Weights are now supported.
- Better control over labels through new options.
- Better defaults should improve the overall figures.
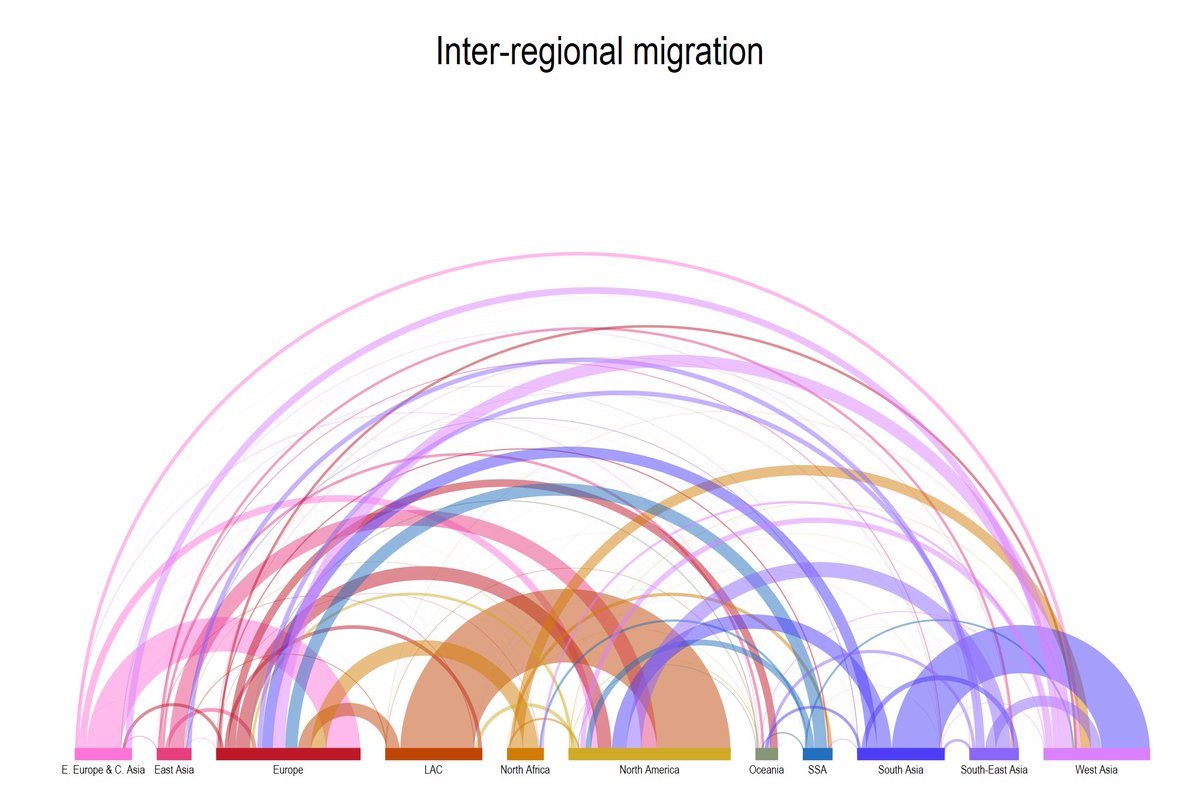
The arcplot package is not given much attention (including by myself), but it is great for showing the level of total activity for nodes in networks. It is also a good alternative for heatplots, sankeys, and network graphs.
More info here:
github.com/asjadnaqvi/stata-…
Up soon on SSC!
2
11
975

16 Sep 2024
That is amazing. Thank you Asjad! I will give it ago to the arcplot. I had noticed your sankey package but the other might work better. github.com/asjadnaqvi/stata-…
1
1
1
102
20 May 2024
Here is probably one of the biggest 6-month update of @Stata packages sent to #SSC to get you guys ready for the summer work 😉
Check them out!
alluvial v1.3: github.com/asjadnaqvi/stata-…
arcplot 1.3: github.com/asjadnaqvi/stata-…
bimap v1.82: github.com/asjadnaqvi/stata-…
bumparea v1.21: github.com/asjadnaqvi/stata-…
circlebar v1.5: github.com/asjadnaqvi/stata-…
clipgeo v2.1: github.com/asjadnaqvi/stata-…
polarspike v1.0: github.com/asjadnaqvi/stata-…
spider v1.31: github.com/asjadnaqvi/stata-…
splinefit v1.0: github.com/asjadnaqvi/stata-…
streamplot v1.81: github.com/asjadnaqvi/stata-…
sunburst v1.7: github.com/asjadnaqvi/stata-…
waffle v1.11: github.com/asjadnaqvi/stata-…
treemap v1.54: github.com/asjadnaqvi/stata-…
Many thanks to Kit Baum for putting these up and a huge thanks to the community for support!
#dataviz #datascience #stataviz
34
140
12,451
31 Mar 2024
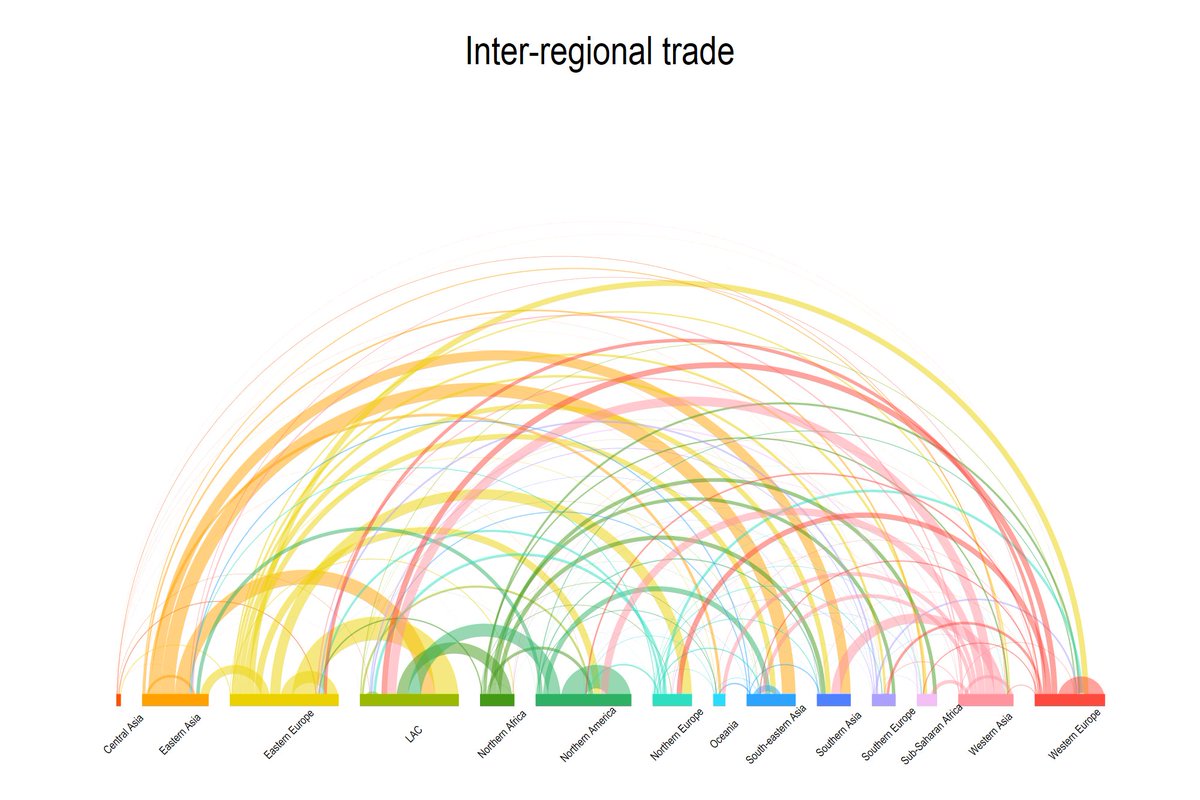
#Stata #arcplot package has been bumped to v1.3 after more than a year of no updates. This package hasn't been given much attention but I am now using it more and more. It is useful for showing volume of flows at the node level in a network.
The major changes are as follows:
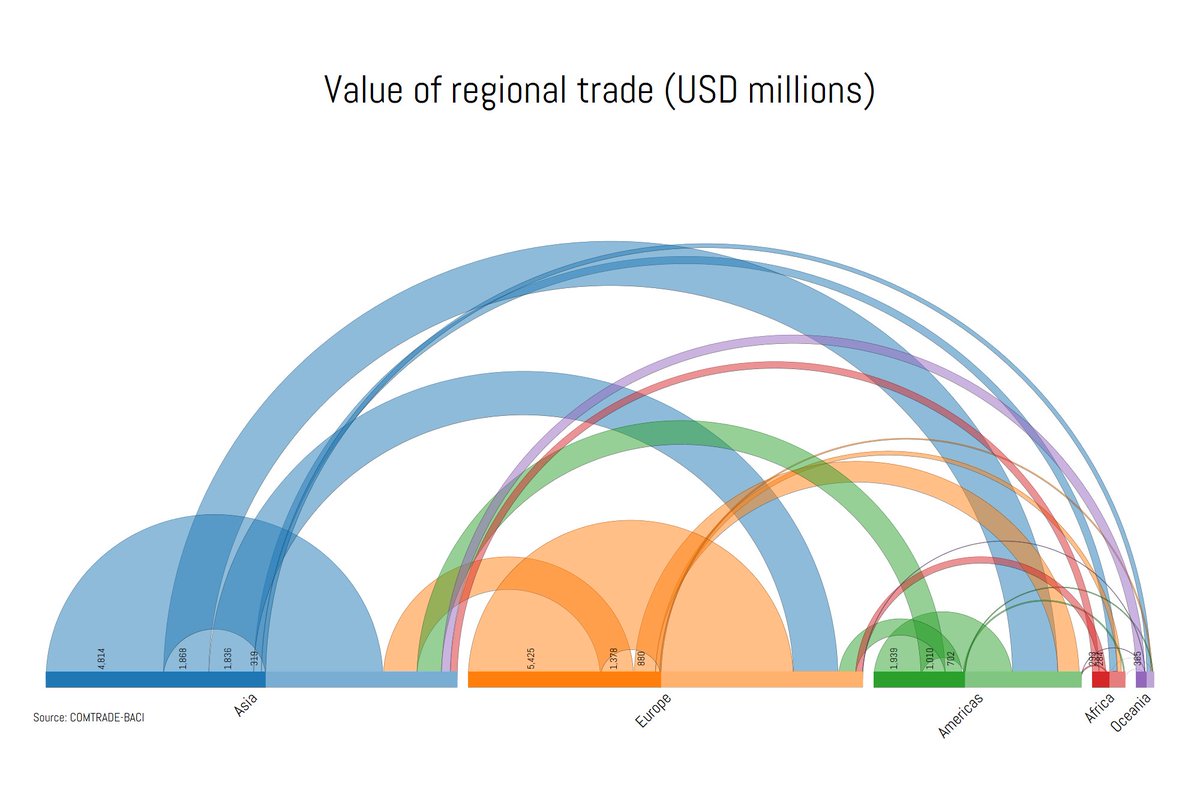
1) Bars now have two tones (modifiable) to distinguish between outflows in inflows
2) Display is now by default numerically sorted which makes it visually easy to identify large flows. Can also be sorted by name.
3) Lots of new options added to micro finetune the graph.
4) Improvements to defaults.
5) Various code optimizations to draw faster.
There are a few more updates planned to make it look less messy with very large number of bilateral flows/dyads.
More info and examples here:
github.com/asjadnaqvi/stata-…
Up soon on SSC.
11
49
5,184
19 Dec 2023
Intermediate input-ouput flows as sankey and arcplot figures:


1
1
136

17 May 2023
For all you old time command line #ArcINFO users out there, does this airport carpet remind you of digitizing a bunch of quad sheets and then drawing them in ArcPLOT only to realize you messed up some coordinates?
Everytime I see this run I want to rearr…lnkd.in/g8Tpsadg
8
541
20 Mar 2023
The following #Stata packages are up on SSC:
bimap v1.6, sunburst v1.2, circlebar v1.1, treemap v1.41, arcplot v1.2, sankey v1.3, alluvial v1.1
A 🧵 on the complete list of my packages:
9 Sep 2022

A 🧵 to keep track of my @Stata #dataviz packages 👇
1) 𝘀𝗰𝗵𝗲𝗺𝗲𝗽𝗮𝗰𝗸: Has a large collection of ready-to-use #Stata #schemes.
Two I personally use all the time are white_tableau (clean white) and neon (black background).
github.com/asjadnaqvi/Stata-…
2
15
92
18,521
16 Feb 2023
#arcplot v1.2 is 1000x faster. This is due to fewer loops, fewer reshapes, and flattened drawing. More options added. Test it out with your network data!
github.com/asjadnaqvi/stata-…
1
9
1,386
11 Nov 2022
The following @Stata packages are up on SSC!
spider v1.0
schemepack v1.4
streamplot v1.4
joyplot v1.6
arcplot v1.1
bimap v1.5
List of packages here!
9 Sep 2022
A 🧵 to keep track of my @Stata #dataviz packages 👇
1) 𝘀𝗰𝗵𝗲𝗺𝗲𝗽𝗮𝗰𝗸: Has a large collection of ready-to-use #Stata #schemes.
Two I personally use all the time are white_tableau (clean white) and neon (black background).
github.com/asjadnaqvi/Stata-…
2
14
107
8 Nov 2022
Version 1.1 of @Stata package #arcplot is now out:
github.com/asjadnaqvi/stata-…
- A lot of bug fixes
- Better label controls
- Added gtools for faster reshaping.
It needs network data in the form: source, destination, value and that is it! Examples 👇👇
2
9
47
9 Sep 2022
1
16
26 Aug 2022
Minor fixes to the #Stata #arcplot package:
github.com/asjadnaqvi/stata-…
Arc plots are great for plotting network data. Check it out!
2
5

8 Aug 2022
BTW #gischat I was the Cartography (or we called it ArcPlot) expert on the benchmark team. 😃
8 Aug 2022

While searching the internet I found a map I helped make. The one Jack is pointing to is from The Greek Navy benchmark. We made a smart automatic generalization of bathymetric lines using TIN. #ESRI #Cartography
gisandscience.com/history/ja…
1
3

5 Jun 2022
2

4 May 2022
ArcView, ArcEdit, ArcInfo, ArcPlot, ArcGRID, ArcIMS, Arc Macro Language, ArcGIS Desktop, ArcPad, ArcGIS Server, .AXL, some of us GIS veterans have lost so many...
3

7 Apr 2022
Raise your hand if you ever coded a map layout by hand using AML in ArcPlot!
1
4

19 Jan 2022
I totally agree and when your side hustle becomes sustainable enough to leave your full time job...go for it!!!
9
