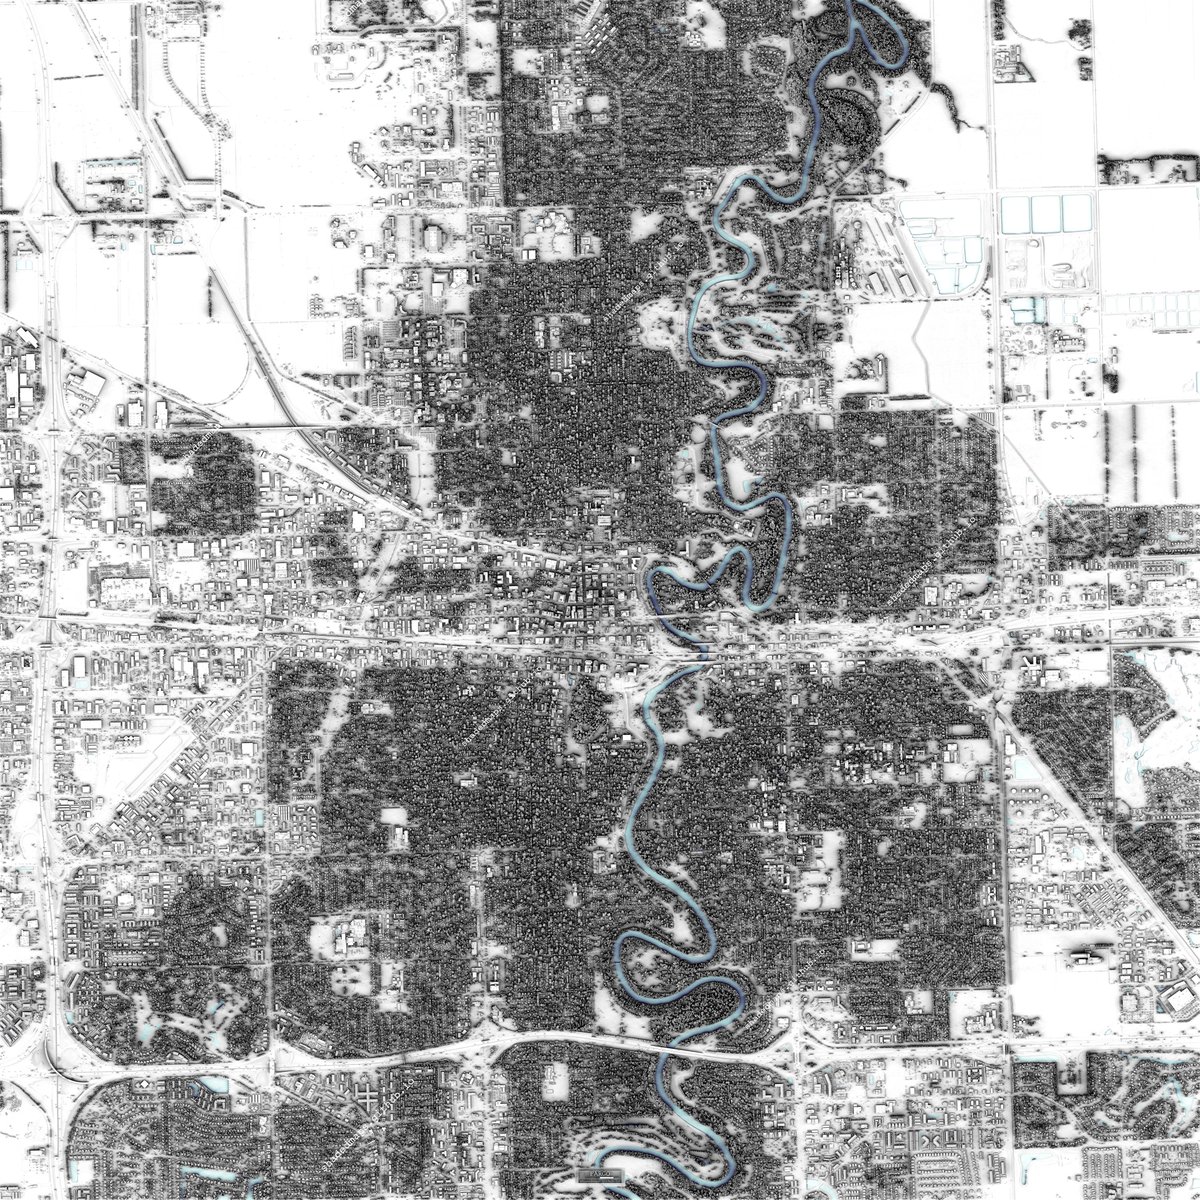
ALT Resized shaded map of Fargo, North Dakota, US.

ALT A fragment from the shaded map of Fargo, North Dakota, US.
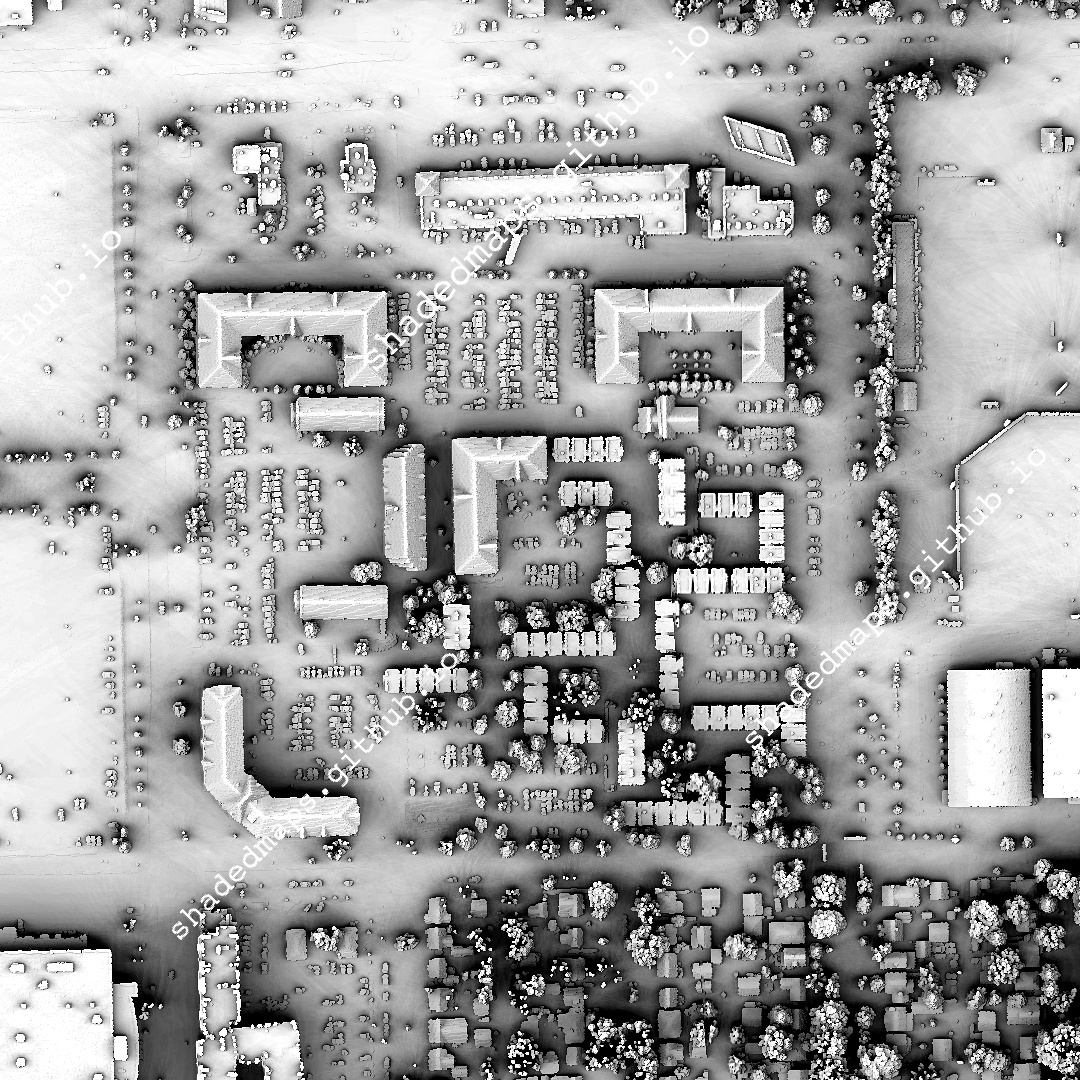
ALT A fragment from the shaded map of Fargo, North Dakota, US.

ALT A fragment from the shaded map of Fargo, North Dakota, US.


ALT Resized shaded map of Monte Carlo, Monaco.
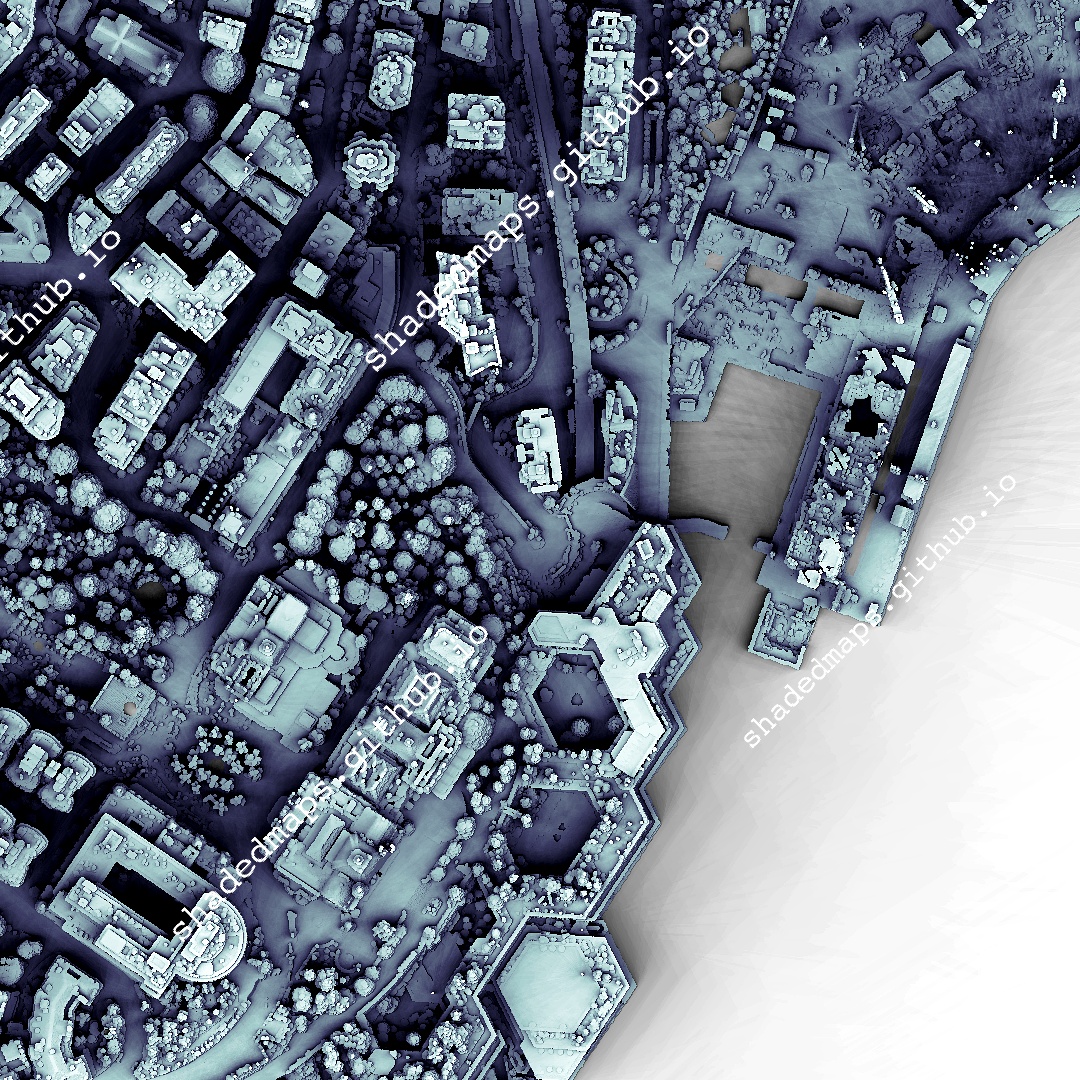
ALT A fragment from the shaded map of Monte Carlo, Monaco.
ALT A fragment from the shaded map of Monte Carlo, Monaco.
ALT A fragment from the shaded map of Monte Carlo, Monaco.


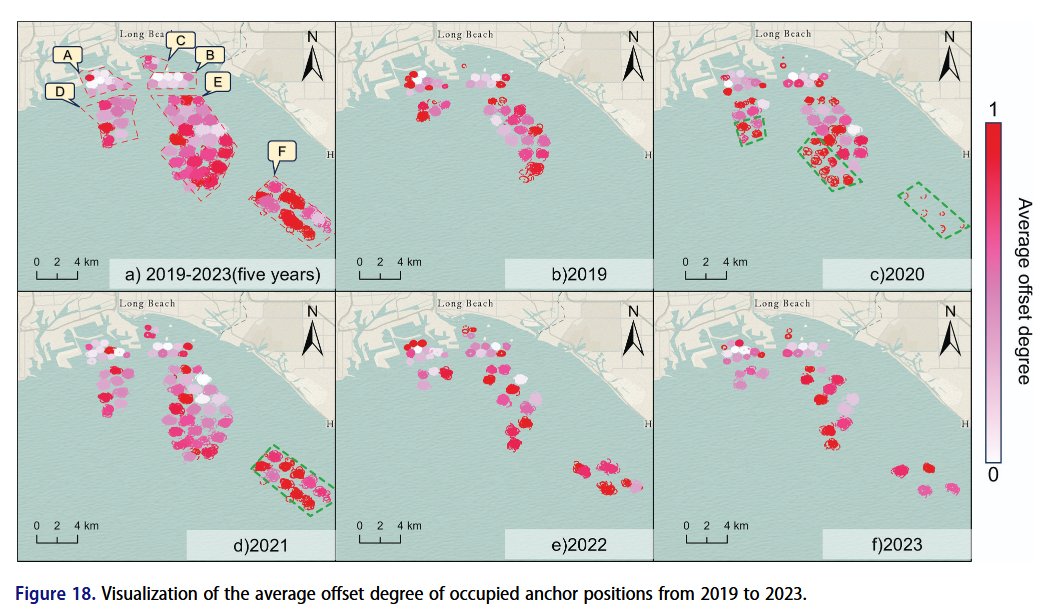
ALT Variation of the average offset (movement due to weather and tides) at various time points for Long Beach. Darker red = more offset. Figure 18: Visualization of the average offset degree of occupied anchor positions from 2019 to 2023. Six maps of the Long Beach area arranged in a 2x3 grid show: a) combined five-year data (2019-2023), and b) 2019, c) 2020, d) 2021, e) 2022, f) 2023 individually. Anchor positions are displayed as circles colored on a heat scale from light pink/white (0, no offset) to dark red (1, maximum offset), indicating the average displacement of occupied anchors. Spatial clustering patterns are visible, with higher offset degrees (darker red) in southern zones during earlier years, decreasing toward 2023. Each map includes a north arrow and scale bar (0-2-4 km). Light blue/teal represents water and beige represents land.