
25m
- Linux is free.
- Docker is free.
- Kubernetes is free.
- Git and Github are free.
- GitHub Actions is free.
- Python is free.
- AWS, GCP, Azure are free (limited use).
- Terraform is free.
- ArgoCD and Flux are free.
- Prometheus and Grafana are free.
Your laptop and internet connection: That’s all you need to start.
5

Alva dev is moving smooth because we built a super agent-friendly dev env:
Infra: Terraform k8s, fully infra as code, Atlantis, ArgoCD, and full suite of otels. All read/write-able to agents.
Codebase: a monorepo built to be "local-first". Anyone can run the whole Alva backend on a laptop, or some freshly minted VM.
Agents: Codex/Claude can work inside a real environment: research → plan → TDD code → review → PR → human AI review → release checks for DB db migrations, env vars, secrets, and infra diffs.
Will share & open source more when I have time.
29


Gateway API plus Ambient Mesh is a lot of moving parts. I would want the Terraform and ArgoCD split before trusting the diagram.
14

we just update the docker image tag and then ArgoCD magically deploy it ☺️
1
2
126


The ultimate discussion about #gitops with some of the most influential experts in the field.
Grab some 🍿 🍿 🍿 🍿 🍿 , relax and enjoy!!
#argocd #argounpacked

Who’s joining us this Monday for a delightful debate between GitOps experts?
We’re bringing together some brilliant minds to unpack Argo CD’s controversial features — with strong opinions, and plenty of GitOps nuance.
Register here 👉 linkedin.com/events/74704772…
#GitOps #ArgoCD
1
15

Who’s joining us this Monday for a delightful debate between GitOps experts?
We’re bringing together some brilliant minds to unpack Argo CD’s controversial features — with strong opinions, and plenty of GitOps nuance.
Register here 👉 linkedin.com/events/74704772…
#GitOps #ArgoCD
2
1
34

Check out our latest blog post! k3s Bootstrap Order: Why Sequence Matters — GitOps and ArgoCD Primer
You've made the architecture decision (k3s HA vs Single Node: Best Architecture for Your Homelab? (taegost.com/2026/06/k3s taegost.com/2026/06/k3s-boot…

12h
【防線崩潰】
AI監控巨頭Dynatrace遭駭!駭客僅憑一支外洩的開發者權杖,成功竊取246個GitHub儲存庫共8.46GB資料。內容包含Terraform設定與ArgoCD部署憑證,目前整座雲端架構的「內臟」已被掛上論壇公開叫賣
ref:cybernews.com/security/dynat…
@PTTNetSecurity
@cheng527
@Military_idv_tw
165


It's 2am and your pager is going off. You're on call, you were asleep, and now there's a pod stuck in CrashLoopBackOff. You know the drill: tail the logs, kubectl describe, scroll Git history, ask in Slack whether anyone shipped anything in the last hour.
Forty minutes later you've found it, and you've woken up your tech lead to confirm.
This walkthrough is about not doing that anymore.
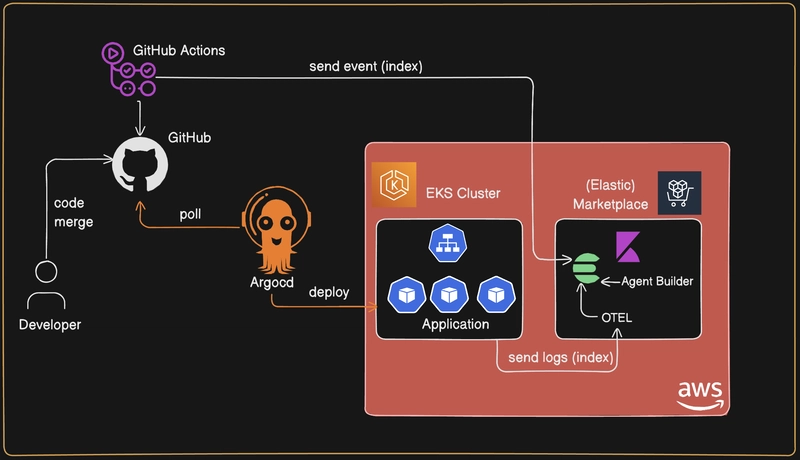
We'll build an AI observability pipeline on Amazon EKS with Elastic Cloud and OpenTelemetry, end to end. The whole thing rests on one move: join two streams of data, your crash logs and your deployment history, and let a language model reason across the join.
Then you ask a plain question, "Why is paymentservice crashing?", and instead of another dashboard to squint at, you get the root cause:
paymentservice went OOMKilled three minutes after commit a1b2c3 by xyz, which dropped the memory limit from 128Mi to 24Mi.
The commit SHA, the author, what changed, what to revert. Two indices and one agent is all it takes. In the below detailed blog, you'll learn how to wire OpenTelemetry, Elasticsearch, and ArgoCD into your EKS cluster until that 2am question answers itself.
3
3
31
1,216


I built this my end to end project with AI assistance
I used AI to for the boiler plate and sat as the system architect
I made sure I owned the project
It's an e-commerce microservice application that used a 3 repo structure
Where Jenkins handle the CI & argocd GitOps CD
25
Kube Architect retweeted

Jun 15
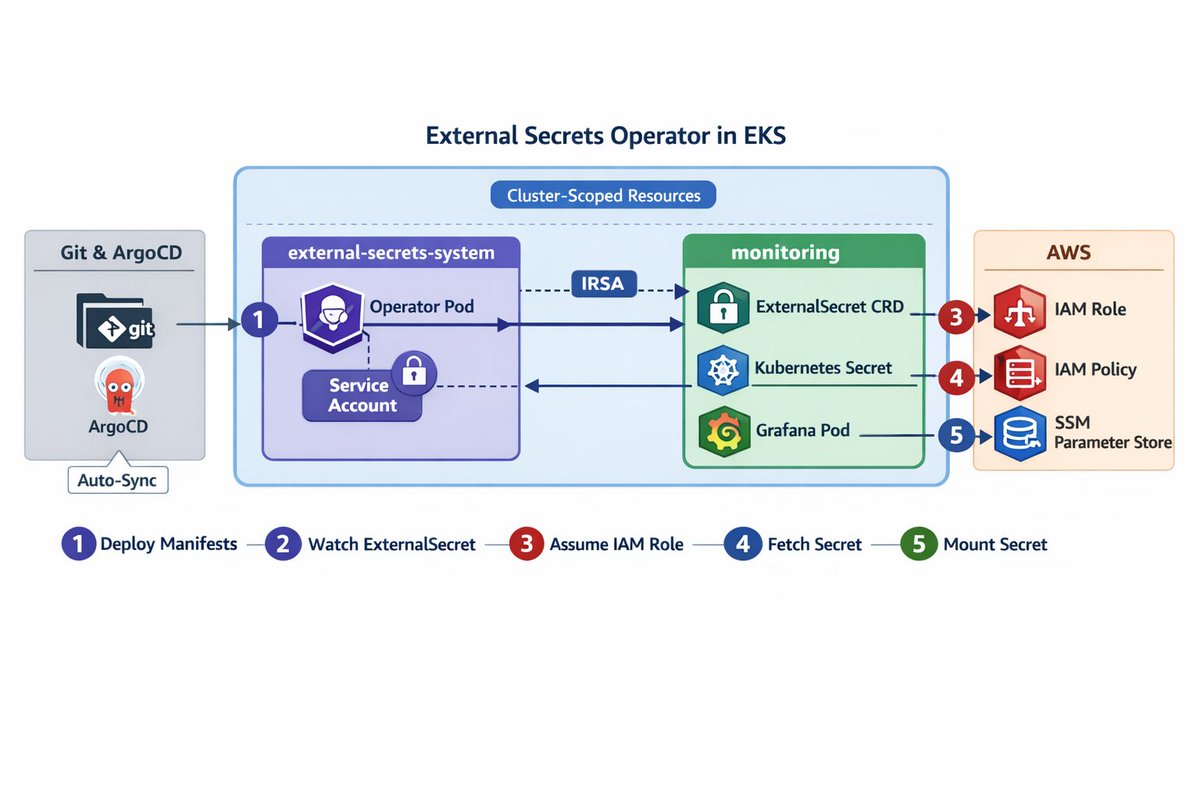
This tutorial shows how to secure an ArgoCD based EKS GitOps workflow with External Secrets Operator, IRSA, and AWS SSM Parameter Store so secrets stay out of Git and sync safely into Kubernetes
➤ ku.bz/1qJT8SG1s
2
22
1,282

Jun 15
GitOps for AI Agent Platforms with Argo CD
Managing agent deployments manually is error-prone. GitOps with Argo CD treats agent configurations, prompts, models, and infrastructure as code — automatically syncing desired state from Git to production clusters with full auditability and easy rollbacks.
This brings software engineering rigor to agent platforms.
As a dev, I now manage all agent deployments through GitOps.
GitOps for Agents Cheatsheet:
• Store agent configs, prompts, and manifests in Git
• Argo CD continuously reconciles cluster state with Git
• Automatic sync manual approval gates for production
• Easy rollback by reverting Git commit
• Tools: Argo CD ApplicationSets for multi-cluster/agent management
• Pro tip: Version prompts and agent logic in the same repo as infrastructure
Are you using GitOps for your agent platform deployments? Reply below 👇
Follow @AiCamila_ for practical AI engineering patterns.
#GitOps #ArgoCD #AgentDeployment #DevOps

3
6
133

Jun 15
𝗦𝗲𝗻𝗶𝗼𝗿 𝗜𝗻𝗳𝗿𝗮𝘀𝘁𝗿𝘂𝗰𝘁𝘂𝗿𝗲 𝗘𝗻𝗴𝗶𝗻𝗲𝗲𝗿 𝗮𝘁 𝗠𝗼𝗼𝗻𝗣𝗮𝘆
Senior · full-time
📍 remote
💰 $170k - $220k
🏷 Crypto, Dev, Web3
🛠Google Cloud Platform,Postgres,Redis,DataDog,ArgoCD,Kubernetes,GitHub,Typescript
Apply Now → web3vacancy.com/j/tg/8603
#crypto #Web3Jobs

27

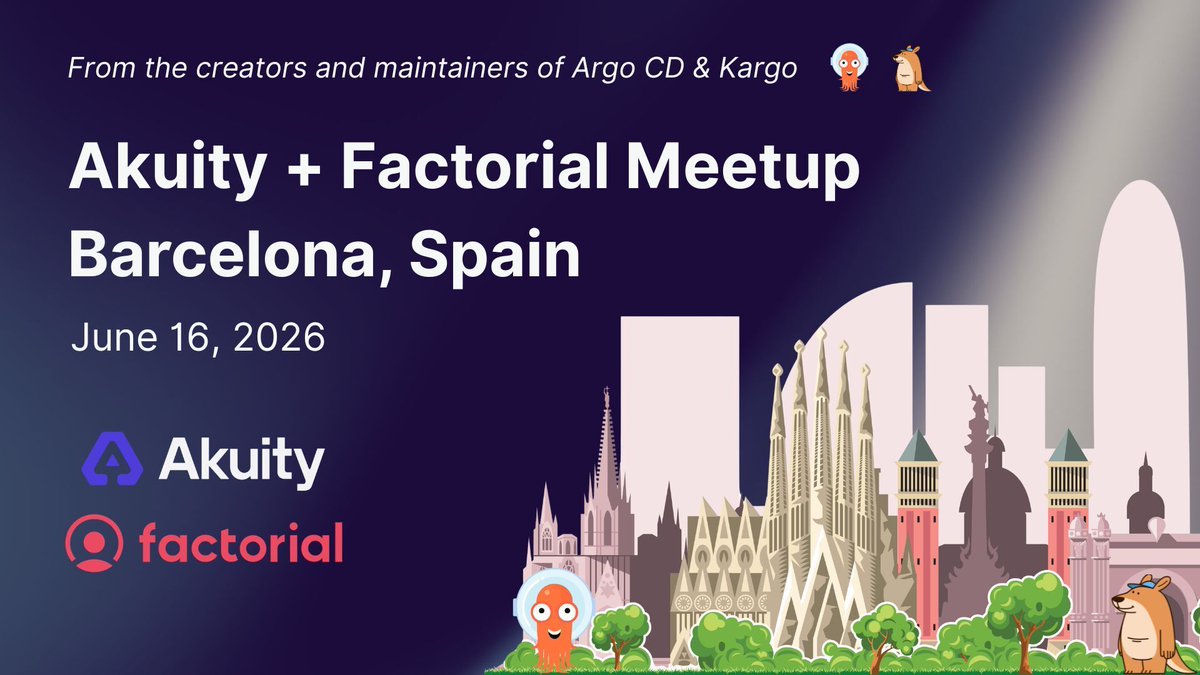
Barcelona meetup tomorrow. 🇪🇸
Join Akuity Factorial for a practical discussion on scaling #GitOps with #ArgoCD, #Kargo & Akuity. 🐙
⚙️ Multi-cluster operations.
🚦 Promotion workflows.
🧠 Production lessons from real platform teams.
hubs.li/Q04lpGrX0
#SREs #Kubernetes
1
33

Jun 15
This tutorial shows how to set up Kubernetes Gateway API on EKS using Istio Ambient Mesh exposed through AWS ALB, with Terraform, ArgoCD, and a layered architecture separating infra from app deployment
➤ ku.bz/2drG48dk5

2
5
27
1,508