
🚨 Câu chuyện XRP đã thay đổi .. & Nhiều nhà đầu tư chưa nhận ra 🚨
Trong nhiều năm, các nhà phê bình đã cố gắng giản lược XRP thành một token chuyển tiền đơn giản.
Câu chuyện đó giờ đây đã lỗi thời.
Ngày nay, Ripple, XRP, XRPL, RLUSD, và hệ sinh thái rộng lớn hơn đang mở rộng qua nhiều lĩnh vực của tài chính toàn cầu:
🏦 Thanh toán xuyên biên giới
💵 Stablecoins (RLUSD, EURCV, và các loại khác)
🏢 Token hóa tài sản thực tế
🔐 Lưu ký tổ chức
🌍 CBDC và các dự án thử nghiệm tiền kỹ thuật số chủ quyền
📈 Quản lý kho bạc và thanh khoản
⚡ Cơ sở hạ tầng thanh toán tức thì
Các bên lớn kết nối với hệ sinh thái bao gồm:
• SBI Holdings
• BNY Mellon
• Santander
• Standard Chartered
• Société Générale-FORGE
• HSBC (qua Metaco)
• Archax
• Ondo Finance
• Bitso
• Tranglo
• Nium
• dLocal
• TransferGo
• Và hàng trăm tổ chức tài chính trên toàn cầu
Trong khi đó, XRPL ngày càng trở thành một nền tảng cho tài sản token hóa, stablecoins, và các sản phẩm tài chính cấp tổ chức.
Cơ hội lớn nhất có thể không còn chỉ là thanh toán.
Nó có thể là sự hội tụ của:
🔹 Token hóa
🔹 Stablecoins
🔹 Lưu ký tài sản kỹ thuật số
🔹 Thanh khoản xuyên biên giới
🔹 Cơ sở hạ tầng thị trường vốn
Thế giới đang hướng tới một tương lai nơi tài sản, tiền bạc và giá trị di chuyển tức thì, 24/7, qua biên giới.
Câu hỏi không phải là liệu tài chính có đang trở nên kỹ thuật số.
Câu hỏi là mạng lưới nào sẽ cung cấp năng lượng cho nó.
Từ góc nhìn của tôi, XRP và XRPL xứng đáng có một chỗ ngồi tại bàn đó.
Tương lai của tài chính đang được xây dựng theo thời gian thực.
#XRP #XRPL #RLUSD #Ripple #Tokenization #RWA #CBDC #Stablecoins #FutureOfFinance #Crypto

4
12
53
1,575

Why DLocal $DLO is one of the best long-term asymmetric opportunities in fintech right now. 👇
The stock is currently trading around $12.25 after a brutal drawdown (-64% from highs), but the fundamentals scream buy-and-hold for the next 5-10 years.
👉 Imo this is a high-quality compounder at a depressed valuation.
The Business
dLocal is a technology-first payments platform that lets global merchants (big tech, e-commerce, streaming, ride-hailing, gaming, etc.) seamlessly accept payments and make payouts in 60 emerging markets across Latin America, Africa, Asia, and the Middle East.
• The moat 🏰: One API, one contract, one platform: access to 1,000 local & alternative payment methods by handling local regulations, fragmented banking, currency, compliance, taxes.
• Serves 700-760 merchants/PSPs, including many demanding mega-cap tech companies.
• Strong moat from 10 years of licenses, local presence, data advantages, and switching costs.
👉 It's the "picks and shovels" for the explosion of digital commerce in the Global South.
Massive TAM
• Current addressable digital payments in markets dLocal serves: ~$1.4-2T , growing at high teens CAGR.
• Broader EM digital payments TAM projected to hit ~$3.7T by 2028.
• eCommerce in these regions heading toward $3T by 2030.
• 6 in 10 people on Earth live in these markets.
• Secular tailwinds: rising middle class, smartphone penetration, e-commerce adoption, digitalization.
👉 dLocal has barely scratched the surface, plenty of runway for geographic expansion, deeper merchant penetration, new products (BNPL, stablecoins, more APMs), and share gains.
Recent Financials (Impressive Scale Growth)
• 2025 Full Year: Record TPV $41B ( 60% YoY), Revenue crossed $1.09B ( 47%), Gross Profit $403M ( 37%), Net Income $197M ( 63%). Adjusted FCF strong (~$191M, 97% conversion).
• Q1 2026: TPV $14.1B ( 73% YoY), Revenue $336M ( 55%), Gross Profit $119M ( 40%).
• Net revenue retention 145% , TPV retention 158%, merchants stick and grow massively.
• High-teens to 20% revenue growth expected for years, with operating leverage kicking in post-investments.
• Profitable, cash generative, initiated dividends $300M buyback authorization.
👉 Despite some FX/macro noise and temporary margin pressure, the core engine is firing on all cylinders with broad-based growth across regions and verticals.
Why Long-Term Bull Case is So Strong
• Asymmetric upside: High-growth (50-60% TPV guidance), capital-light model, expanding margins, network effects.
• Trading at a reasonable multiple on current earnings/growth given the TAM and execution track record.
• Management is obsessed with customers and thinking in decades, not quarters.
Bottom line 👉 The market is giving you a sale on a category-leading emerging markets payments winner during a period of digestion. Emerging markets digitalization isn't stopping.If you have a 3-5 year horizon and believe in the rise of the Global South, $DLO is a top-tier compounder.
What do you think: undervalued gem or too risky? Let's discuss.
#Fintech #Investing #EmergingMarkets

1
19
1,526

🚨 Câu chuyện XRP đã thay đổi .. & Nhiều nhà đầu tư chưa nhận ra 🚨
Trong nhiều năm, các nhà phê bình đã cố gắng giản lược XRP thành một token chuyển tiền đơn giản.
Câu chuyện đó giờ đây đã lỗi thời.
Ngày nay, Ripple, XRP, XRPL, RLUSD, và hệ sinh thái rộng lớn hơn đang mở rộng qua nhiều lĩnh vực của tài chính toàn cầu:
🏦 Thanh toán xuyên biên giới
💵 Stablecoins (RLUSD, EURCV, và các loại khác)
🏢 Token hóa tài sản thực tế
🔐 Lưu ký tổ chức
🌍 CBDC và các dự án thử nghiệm tiền kỹ thuật số chủ quyền
📈 Quản lý kho bạc và thanh khoản
⚡ Cơ sở hạ tầng thanh toán tức thì
Các bên lớn kết nối với hệ sinh thái bao gồm:
• SBI Holdings
• BNY Mellon
• Santander
• Standard Chartered
• Société Générale-FORGE
• HSBC (qua Metaco)
• Archax
• Ondo Finance
• Bitso
• Tranglo
• Nium
• dLocal
• TransferGo
• Và hàng trăm tổ chức tài chính trên toàn cầu
Trong khi đó, XRPL ngày càng trở thành một nền tảng cho tài sản token hóa, stablecoins, và các sản phẩm tài chính cấp tổ chức.
Cơ hội lớn nhất có thể không còn chỉ là thanh toán.
Nó có thể là sự hội tụ của:
🔹 Token hóa
🔹 Stablecoins
🔹 Lưu ký tài sản kỹ thuật số
🔹 Thanh khoản xuyên biên giới
🔹 Cơ sở hạ tầng thị trường vốn
Thế giới đang hướng tới một tương lai nơi tài sản, tiền bạc và giá trị di chuyển tức thì, 24/7, qua biên giới.
Câu hỏi không phải là liệu tài chính có đang trở nên kỹ thuật số.
Câu hỏi là mạng lưới nào sẽ cung cấp năng lượng cho nó.
Từ góc nhìn của tôi, XRP và XRPL xứng đáng có một chỗ ngồi tại bàn đó.
Tương lai của tài chính đang được xây dựng theo thời gian thực.

34

Jun 13
🚨 The XRP Story Has Changed .. & Many Investors Haven't Noticed 🚨
For years, critics tried to reduce XRP to a simple remittance token.
That narrative is now outdated.
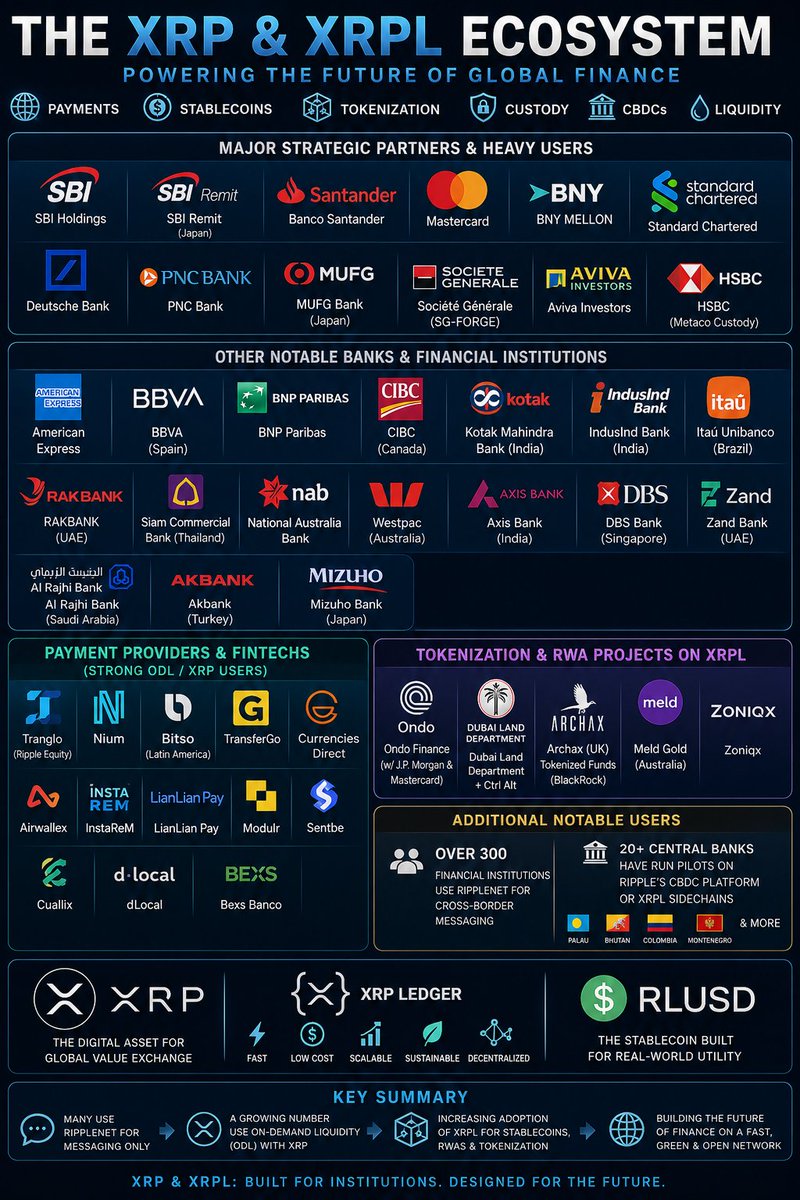
Today, Ripple, XRP, XRPL, RLUSD, and the broader ecosystem are expanding across multiple sectors of global finance:
🏦 Cross-border payments
💵 Stablecoins (RLUSD, EURCV, and others)
🏢 Real-world asset tokenization
🔐 Institutional custody
🌍 CBDCs and sovereign digital currency pilots
📈 Treasury and liquidity management
⚡ Instant settlement infrastructure
Major players connected to the ecosystem include:
• SBI Holdings
• BNY Mellon
• Santander
• Standard Chartered
• Société Générale-FORGE
• HSBC (via Metaco)
• Archax
• Ondo Finance
• Bitso
• Tranglo
• Nium
• dLocal
• TransferGo
• And hundreds of financial institutions globally
Meanwhile, XRPL is increasingly becoming a platform for tokenized assets, stablecoins, and institutional-grade financial products.
The biggest opportunity may no longer be payments alone.
It may be the convergence of:
🔹 Tokenization
🔹 Stablecoins
🔹 Digital asset custody
🔹 Cross-border liquidity
🔹 Capital markets infrastructure
The world is moving toward a future where assets, money, and value move instantly, 24/7, across borders.
The question isn't whether finance is becoming digital.
The question is which networks will power it.
From my perspective, XRP and XRPL deserve a seat at that table.
The future of finance is being built in real time.
#XRP #XRPL #RLUSD #Ripple #Tokenization #RWA #CBDC #Stablecoins #FutureOfFinance #Crypto
6
130
341
9,209

Jun 12
Combine the assumptions of @CWB_Research with the interview made by @techalphapodcast @Alementory @danielkoss with Pedro Anrt [CEO of $DLO] you get to see why DLocal is an excellent company priced for a Bear-case which makes it an attractive investment for value investors🕺
youtu.be/2uJzlpBWkWw?is=C2jx…
May 3

$DLO Valuation
Overview
dLocal (also referred to as the "Company" and "DLO") is one of the most misunderstood businesses in fintech — and one of the most compelling long setups in the market today.
The Company is the dominant cross-border payment infrastructure provider across 40 emerging markets. Global merchants — think streaming platforms, ride-hailing apps, e-commerce giants, and remittance networks — need a single trusted rail to collect and disburse money across Latin America, Africa, and Asia. dLocal is that rail. It earns a take rate on every dollar of Total Payment Volume ("TPV") it processes, and as it scales with large merchants, volume grows faster than costs, driving operating leverage and compounding free cash flow. The pitch is simple: you are buying a capital-light, high-conversion cash machine at an unjustifiably low multiple for the growth rate on offer.
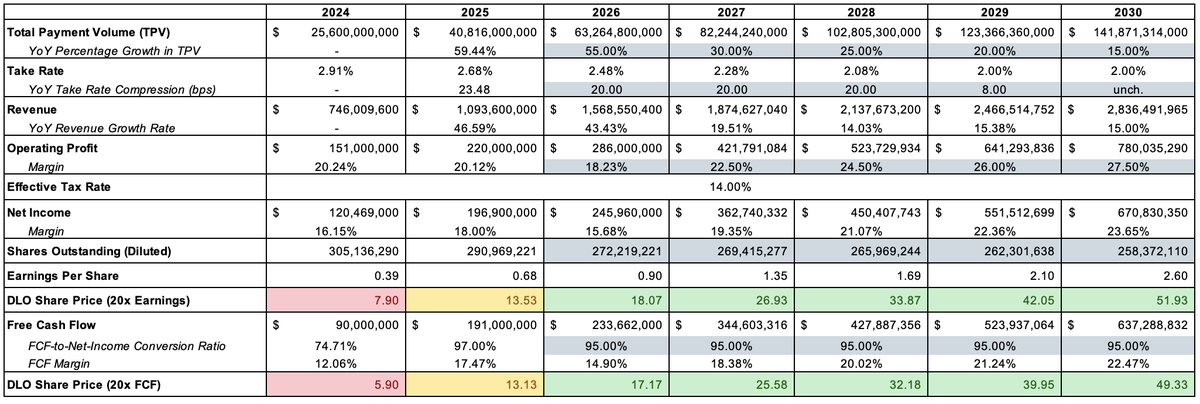
Specifically, as at market close on May 1, 2026, dLocal's common shares are valued at $13.75-per-share. The attached model I made, built on what I view as realistic assumptions and anchored to management guidance, implies a share price of ~$49 by 2030 on a 20x FCF multiple and ~$52 by 2030 on a 20x P/E multiple, representing a 38-40% compounded annual rate of return over this period. Here is every assumption and why I made it.
Assumption 1: TPV Growth
2026: 55% YoY | 2027: 30% | 2028: 25% | 2029: 20% | 2030: 15%
Management guided formally for 50–60% TPV growth in 2026 on their Q4 2025 earnings call — I am taking the midpoint at 55%.
The deceleration from 2027 onward is deliberate and conservative. As TPV approaches $100 billion , dLocal begins to encounter the law of large numbers, whereby sustaining 50% growth is structurally harder. In response, I step down forecasted TPV growth progressively: 30% in 2027, 25% in 2028, 20% in 2029, and 15% in 2030.
By 2030 the model implies a TPV base of ~$142B. For context, 2024 TPV was $25.6B — this trajectory reflects a company winning durable market share in digital payments across the highest-growth economies on earth, not a moonshot.
Assumption 2: Take Rate Compression
2026–2028: –20bps/yr | 2029: –8bps | 2030: unchanged at ~2.00%
A declining take rate is the most misunderstood line in the DLO model and the source of most of the market's skepticism towards the stock. Take rate compression is real, structural, and intentional — management explicitly treats take rate as an output metric, not something they optimize. The logic is: when DLocal wins a large global merchant like a major ride-hailing platform or streaming service, it competes aggressively on price to lock in volume. Once you have the volume, the absolute gross profit dollars grow even as the percentage shrinks. This is identical to how every scaled payments business — Adyen, Stripe, PayPal at maturity — has operated.
I assume 20bps of annual compression through 2028, reflecting the ongoing merchant mix shift at dLocal toward large-volume accounts. The pace of compression slows to 8bps in 2029 and stabilizes flat in 2030 at ~2.00%, where I believe the floor sits given the complexity premium dLocal charges for emerging market infrastructure.
CEO Pedro Arnt has recently stated that he believes dLocal's take rate will flatten and could even rise in the near future. Arnt cited several levers whereby dLocal could attain take rate flattening/re-acceleration, including: (i) building trust with merchants who they are currently offering initial volume discounts to; (ii) a consolidation of dLocal's competitors; (iii) continued revenue growth at dLocal (scale as a differentiator); (iv) fragmentation in payments infrastructure across the emerging world increasing the value of dLocal's product offerings; and (v) the introduction of new, higher-margin financial infrastructure products (credit, KYC, etc.) by dLocal.
Assumption 3: Operating Profit Margin
2026: 18.2% | 2027: 22.5% | 2028: 24.5% | 2029: 26.0% | 2030: 27.5%
On the Q4 2025 call, management guided operating profit growth of 27.5–32.5% YoY. Taking the midpoint implies approximately $286 million in 2026 operating profit for dLocal, an 18.2% operating profit margin.
If these assumptions hold, dLocal's operating profit margin in 2026 (18.2%) will be lower than 2025 (20.1%). This can be attributed to lagging effects from dLocal's 2025 investment cycle, in which 2025 headcount increases were backloaded, pushing YoY OpEx growth higher in H1 2026.
While the market may respond negatively to increased OpEx and lower operating profit margins on dLocal's Q1 2026 earnings call, as the Company exits its 2025 investment cycle (DLO has committed to no headcount increases in 2026) the effects of operating leverage will become more visible in H2 2026. I plan to increase my holdings in dLocal if we see a sell-off post Q1 2026 attributed to a "margin compression" narrative.
From 2027, dLocal's expansion path reflects two compounding forces. First, the 2025 investment cycle is fully absorbed, meaning the cost base is largely fixed while gross profit continues to grow. Second, dLocal's AI productivity programme delivered gains equivalent to 93 full-time employees in 2025 alone — roughly 7% of headcount — enabling 50% revenue growth with minimal incremental hiring. These gains compound. By 2030, a 27.5% operating margin reflects a structurally more efficient business, not an aggressive assumption: it is broadly in line with where Adyen and other scaled payment rails have landed at equivalent maturity points.
Assumption 4: Shares Outstanding
305M shares (2024) → ~258M shares (2030), net of buybacks
This is a structural tailwind most models underweight. dLocal's board approved a new $300 million buyback program in March 2026, funded by free cash flow and expiring in March 2027. Assuming an average buyback price of $16-per-share, dLocal will repurchase 18,750,000 shares in 2026 and early 2027, bringing dLocal's shares outstanding to ~272 million.
From here, I assume that management allocates 25% of dLocal's free cash flow to share repurchases. Assuming an average buyback price of $25 in 2027, $30 in 2028, $35 in 2029 and $40 in 2030, this will bring dLocal's shares outstanding to ~258 million by 2030.
These buybacks matters enormously for per-share value: EPS and FCF per share grow faster than absolute earnings because you are dividing a growing numerator by a shrinking denominator. This is one of the underappreciated aspects of the dLocal story — management is systematically concentrating ownership in a business with improving unit economics.
Assumption 5: FCF-to-Net Income Conversion
95% throughout 2026–2030
In 2025, dLocal's adjusted FCF-to-net-income conversion came in at 97%. This reflects the capital-light nature of the model: minimal capex requirements, no inventory, no physical infrastructure. I hold the conversion ratio at a conservative 95% across the entire forecast to account for the reality of operating across 40 emerging markets — some quarters will see working capital drag from FX timing differences, local liquidity buffer requirements, and jurisdictional cash trapping. The practical implication is that nearly every dollar of reported net income flows through to cash available for dividends, buybacks, and reinvestment — which is exactly the capital return flywheel that management is executing against.
Bonus: Dividends
dLocal has a formal, board-approved dividend policy of distributing 30% of the prior year's free cash flow as an annual dividend. At the current share price of ~$13, that implies a dividend yield of roughly 1.5% — modest in isolation, but this is not a dividend story in the traditional sense. The importance of the policy is what it signals: management is so confident in the repeatability and durability of cash generation that they are legally committing to return a fixed proportion of it every year, even while simultaneously running a $300 million buyback program.
Bottom Line
At $13.75-per-dLocal share, you are buying a business trading near its 2023 lows, with earnings growing at 60% YoY, a 97% FCF conversion ratio, a management team actively shrinking the share count, and a formal 2026 growth guide that — if they hit the midpoint — would put the stock at a material discount to fair value even on conservative out-year assumptions. The market is pricing in execution failure. My model is pricing in execution.
Disclaimer
Dlocal is a core position in my portfolio, currently representing a 16.5% weight. I found the name from analysts on this platform who I have a great deal of respect for, such as @realroseceline, whose views and input have underpinned certain assumptions in the above model.
1
458

Jun 11
Founders treat payments as a checkbox. The ones who treat it as infrastructure quietly win 5-15% more revenue.
Think about that gap. Most founders pick one PSP and never look back.
A European card routed through a US acquirer? You lose 5-15% in authorization rates. That's not a rounding error. That's revenue you'll never see.
Every market has its own acquiring rails and its own champions:
🇺🇸 USA & Canada: Stripe, PayPal, Square, Worldpay, Fiserv, Global Payments Inc., Nuvei and Elavon dominate. PayPal alone still captures ~30% of online checkout share. Ignoring it is leaving money on the table.
🇪🇺 Europe: Adyen, Worldline, Nexi Group and Checkout have direct issuer connections global PSPs can't match. Mollie, SumUp, Trust Payments and Rapyd cover the long tail, with Stripe and Nuvei layered on top.
🌎 LATAM: dLocal and EBANX handle cross-border settlement where others can't. Rede, Cielo, Stone, Getnet, PagSeguro International and Mercado Libre Pago own domestic volume in Brazil. Selling there without Pix? You're missing ~45% of buyers.
🌍 Africa & Middle East: Flutterwave and Paystack are the two heavyweights. Network and Fawry are the rails across the Gulf and Egypt, with Yoco covering South African SMBs and Checkout bridging the region.
🌏 Asia: Razorpay owns India (UPI moves 10B transactions/month), with Paytm and Pine Labs alongside. Stripe and Adyen connect the rest of the corridor. No single global PSP covers all of this.
The smartest merchants run 2-4 PSPs. They route dynamically by BIN country, card type and historical acceptance. They fail over automatically. They A/B test by corridor.
The payoff: 5 to 15% authorization uplift. On $100M GMV, that's $3-7M you were leaving behind.
One PSP is a single point of failure. Treat your payment stack like infrastructure redundant, optimized, monitored.
PS: I post about payments with @Subyhq, stablecoins & the reality of cross-border infrastructure every week. Follow for more.

5
4
42
1,897

Jun 11
The biggest moment in football starts today! ⚽ A game this big isn't just about the final, but everything before it!
Complex markets, high stakes, no shortcuts. That's the game we play every day. 🌍
🏆 Proud Sponsor of World Champions #dLocal #EmergingMarkets @AUFOficial
1
6
465

Jun 11
Dlocal est tellement sous valorisé… un re-rating devient urgent sur ce dossier qui se traîne du fait d’une obsession du take-rate alors qu’ils fait sens avec le volume traité. $DLO
5
881

Jun 11
One “buy now” button. 1000 ways to click it. 🛒
We connect you to 1000 payment methods across the markets that are moving on their own terms.
Your future customers are ready. Is your checkout?
#dLocal #Payments #Fintech #GlobalPayments #MarketsOfTheFuture
1
17
433

De oficio | C-451-2022: Demanda de DLOCAL Chile SpA en contra de Mastercard International Incorporated y otras consultas.tdlc.cl/estadoDiar…
29


Jun 10
Dividend day compliments of dLocal $DLO
£198.64 - which will be reinvested back into the portfolio - compounding away 📈💷

1
5
432

Jun 10
🔔 Günün Küresel Fintek Gündemi!
Bugün fintek gündeminde yapay zekâ destekli ödemeler, milyar dolarlık satın alma görüşmeleri, regülasyon hamleleri ve dijital bankacılık tarafındaki yeni gelişmeler öne çıktı.
💳 Fintek Dünyasından
📌 Getnet, Mastercard ve Neivor iş birliğiyle Mastercard Agent Pay altyapısını kullanarak Latin Amerika’daki ilk canlı yapay zekâ ajanı ödeme işlemini gerçekleştirdi.
📌 Nuvei’nin Payoneer’i yaklaşık 2,7 milyar dolar karşılığında satın almak için görüşmeler yürüttüğü bildirildi. Nuvei-Payoneer görüşmeleri, KOBİ’lerin sınır ötesi ödeme ve çoklu para birimi yönetimi ihtiyaçlarının büyüdüğünü yeniden gündeme taşıdı.
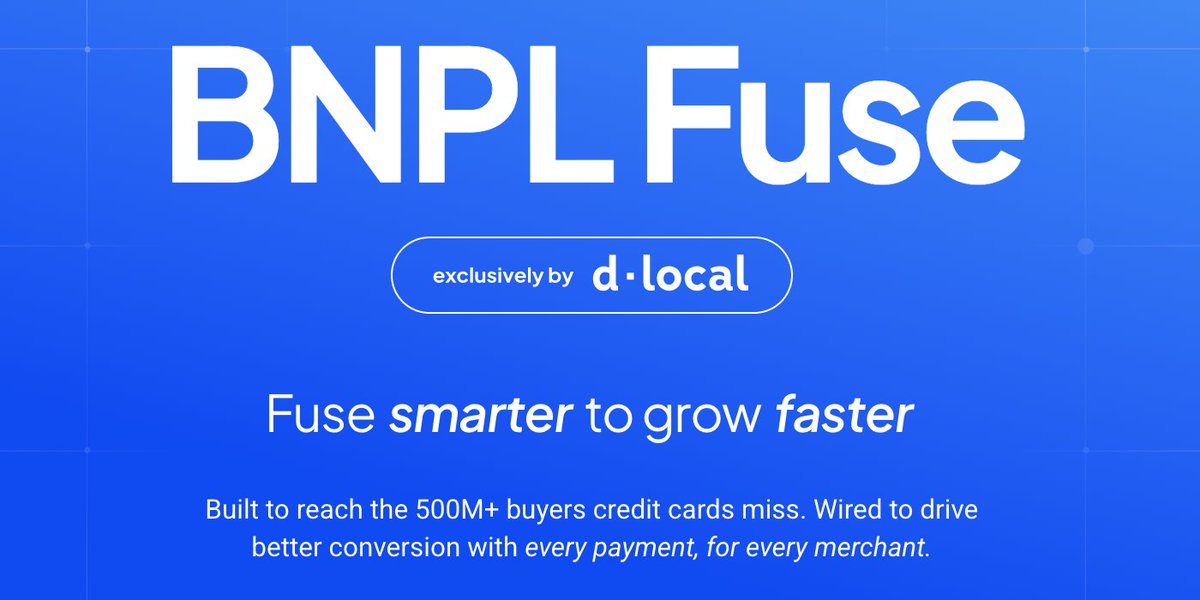
📌 dLocal, BNPL Fuse platformunu genişleterek gelişmekte olan pazarlarda 500 milyondan fazla tüketiciye ulaşan finansman ağını büyüttü. Aynı zamanda Singapur’u Asya-Pasifik operasyonlarının merkezi haline getirerek bölgedeki sınır ötesi ödeme stratejisini güçlendirdi.
📌 Kolombiya merkezli fintek Treinta, yıllık tekrarlayan gelirini 14 milyon doların üzerine çıkardı.
📌 Ant International, küresel büyüme planlarını desteklemek amacıyla yaklaşık 1 milyar dolarlık yatırım turu için yatırımcılarla görüşmelere başladı.
📌 Ecommpay, Apple Pay ve Google Pay kullanıcılarına yönelik Express Checkout çözümünü kullanıma sundu.
🏦 Dijital Bankacılık Alanında
📌 Lloyds Banking Group, yapay zekâ destekli dolandırıcılık tespit sistemlerini genişletirken KOBİ ödeme araçlarına yönelik yatırımlarını artırdı.
📌 Hollandalı dijital banka bunq, dolandırıcılık mağdurlarından gelen şikâyetlere geç yanıt verdiği gerekçesiyle para cezası aldı.
📌 Fransa’nın en büyük dijital bankalarından Boursorama Avrupa ödeme girişimi Wero’ya katıldı.
📌 SoFi Hong Kong, üçüncü taraf bir hizmet sağlayıcısında yaşanan veri ihlalinin bazı müşteri verilerini etkileyebileceğini açıkladı.
📌 Trade Republic, tüketici bilgilendirmesine ilişkin tespitler nedeniyle İtalya’da 2,5 milyon euro para cezasına çarptırıldı.
📌 Revolut’un hızlı ürün geliştirme ve onay süreçleri Avrupa düzenleyicilerinin incelemesine konu oldu.
🔍 Bugünün haber akışı üç ana başlıkta yoğunlaştı. Mastercard’ın gerçekleştirdiği ilk canlı yapay zekâ ajanı ödeme işlemi, yapay zekânın finansal işlemlerde aktif rol almaya başladığını gösterirken; Nuvei-Payoneer görüşmeleri ve Ant International’ın yatırım hazırlığı sınır ötesi ödemelerde ölçek yarışının hızlandığını ortaya koydu. Diğer tarafta bunq, Trade Republic ve Revolut haberleri ise Avrupa’da regülasyonun artık yalnızca lisans ve sermaye yeterliliğiyle sınırlı kalmadığını, müşteri koruma ve ürün yönetişimi süreçlerine kadar genişlediğini gösteriyor.
Detaylar:
fintekwins.com/10-haziran-gu…
50

Jun 10
Buy Now Pay Later (BNPL) has been gaining popularity in the US with companies such as $KLAR , $AFRM , and $PYPL .
They are a competition to credit cards, which has been the default for decades.
But what about the emerging markets where credit card penetration is still low?
Well, BNPL has been around for much longer and is quite mature.
That's why $DLO introduced BNPL Fuse, to enable its clients to connect to local BNPL providers.
This helps Dlocal in two ways:
It provides more volume
It provides Value-added services
BNPL is still a small portion of the total business of Dlocal. In March, the total transaction was only $18.9 million, with TPV of over $14 billion for the quarter. But BNPL has been growing by 20% month-over-month.
One of the bear arguments against Dlocal is that payment processing will be commoditized and the Take rate will keep going down. That's true. But by providing BNPL option, they are handling more complexities on behalf of the merchants. This is a value-added service and they would want to be compensated for that.
And Dlocal takes very little additional risks since they are not lending money and the merchant is paid immediately. That's why there can be issues with working capital as we saw last quarter with pre-funding of certain collection agencies. But this is temporary.
1
3
486


dLocal Ltd $DLO operates as a vital financial bridge that simplifies complex digital payments for massive enterprise merchants across rapidly growing emerging markets. With the total addressable market for cross-border commerce projected to hit $4.2 trillion by 2030, the firm is positioned to capture tremendous top-line scale. Although near-term margins have compressed due to a strategic shift toward high-volume instant payment networks, the underlying business remains highly profitable with a massive net cash buffer. Backed by an active share buyback program and the recent dismissal of major litigation, the currently discounted valuation presents a potentially asymmetric upside opportunity for investors. Can management's ongoing transition toward high-velocity transactional scale successfully cement their dominance against intensifying global competition?

1
175

Jun 10
i agree
which is one of the main reasons amazon is my largest holding
- also the reason i’m bullish on $MA & $V & uninterested in payment processors (paypal, toast, shift4, dlocal) etc. no matter which processor wins, Visa and Mastercard benefit.
I requested a couple of spaceX shares, mainly as an IPO trade (to me it’s simple math, it’ll be extremely oversubscribed, if i get assigned at $135 and it opens at $200, i take profits) - of which i think there’s a decent probability. If it drops/stays roughly flat, it’s a set & forget. i want to own this company for decades - but do think i might be able to get shares cheaper in the future.
1
1
369

@dLocalPayments has expanded its "BNPL Fuse" infrastructure across emerging markets. The solution automates pre-checkout screening and financing to boost merchant conversion and approval rates.
Read: financialit.net/news/lending…
#Fintech #dLocal
2
16
