
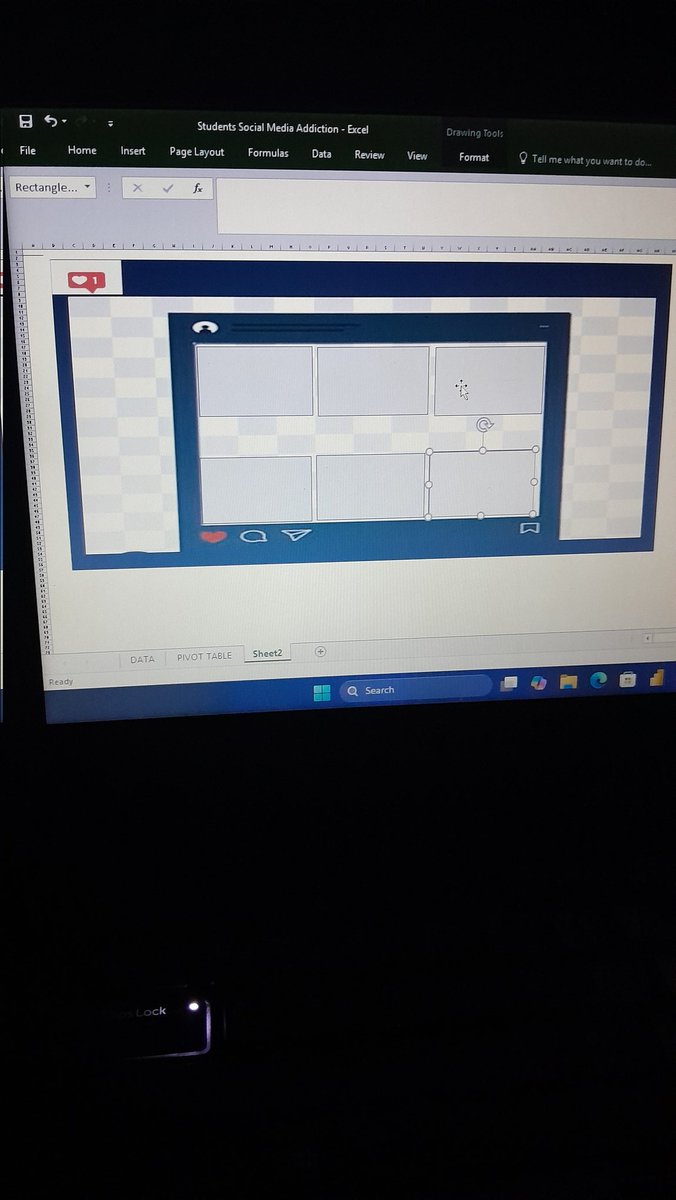
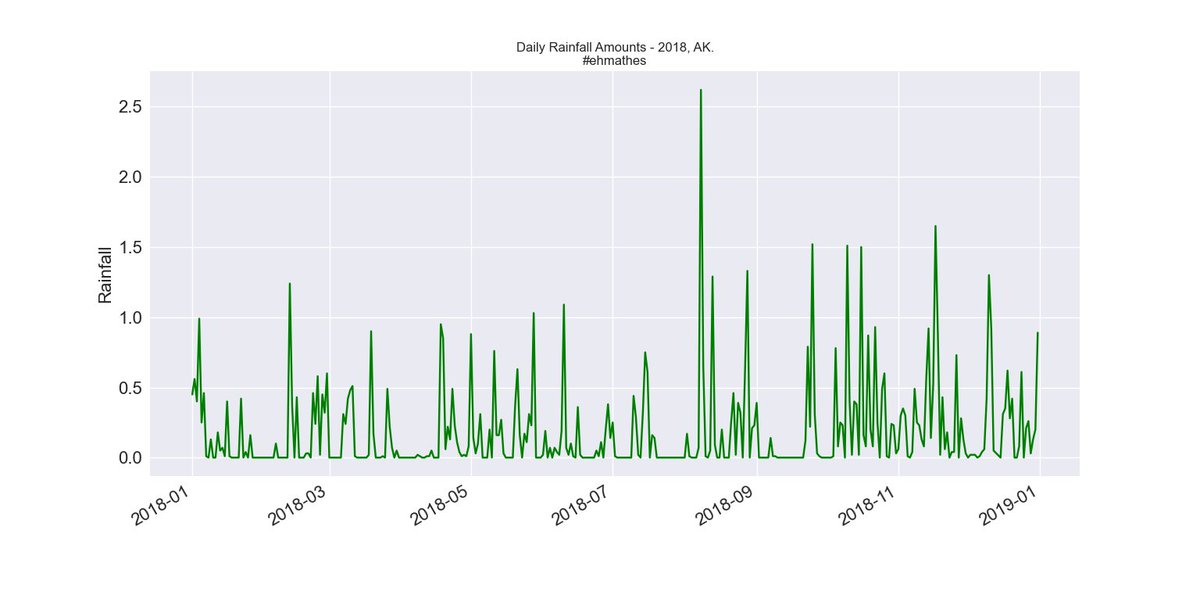
After a little break, my hands got itchy yesterday, so I decided to play around.....dunno how this will eventually turn out, noticed some mistakes already so I'm definitely going back to the drawing board 😂,but I hope y'all are here to engage!
#DataAnalytics #Datavisuals
2
1
9
278

27 Jun 2025
🚀 Tech founders, AI educator & data pros — ditch boring slide!
Present your idea with this sleek, modern AI Presentation Template 🧠
For pitch decks, webinars & reports.
#AITemplate #TechPresentation #StartupPitch #Founders #Husprideppt #PitchDeckDesign #DataVisuals #AIStartup


4
85

28 Mar 2025
World of Vibe Coding!
Feel the mood...feel the Agi...
#gaming #datavisuals #websites #apps #adrejkarpathy #ageofai
2
3
5
289

You should always be reading @fc_mossman — he’s a brilliant LaLiga analyst who combines top-notch datavisuals, statistical analysis, and in-game breakdowns.
4
6,801

14 May 2024
Struggling with clunky dashboard wireframing tools? Meet Mokkup.ai - Build dashboard wireframes that are as easy on the eyes as they are to use. For free!
#data #dashboard #datavisuals #dashboarddesign #dataanalysis #dataviz #designthinking #businessintelligence

1
2
67

25 Jan 2024
How easy is it to create data visuals with #GPT4 and #Python #Streamlit? 🤖 🐍
Super easy! I love easy! 🥰
With a good dataset and we can peel off #charts and #maps, giving us deep stories - data at depth.
Let me show you how!
👇👇
tinyurl.com/4va7sfvp
#datavisuals
1
5
137
7 Dec 2023
How Good Are Your Data Visual Skills?📈
Want to up your game? 🚀📊
Take my FREE course on Prompting GPT-4 For Data Visualization Optimization.
Sign up Here:
👇 👇
tinyurl.com/2mjsj5ah
#datavisuals #GPT4 #prompts
5
407

22 Aug 2023
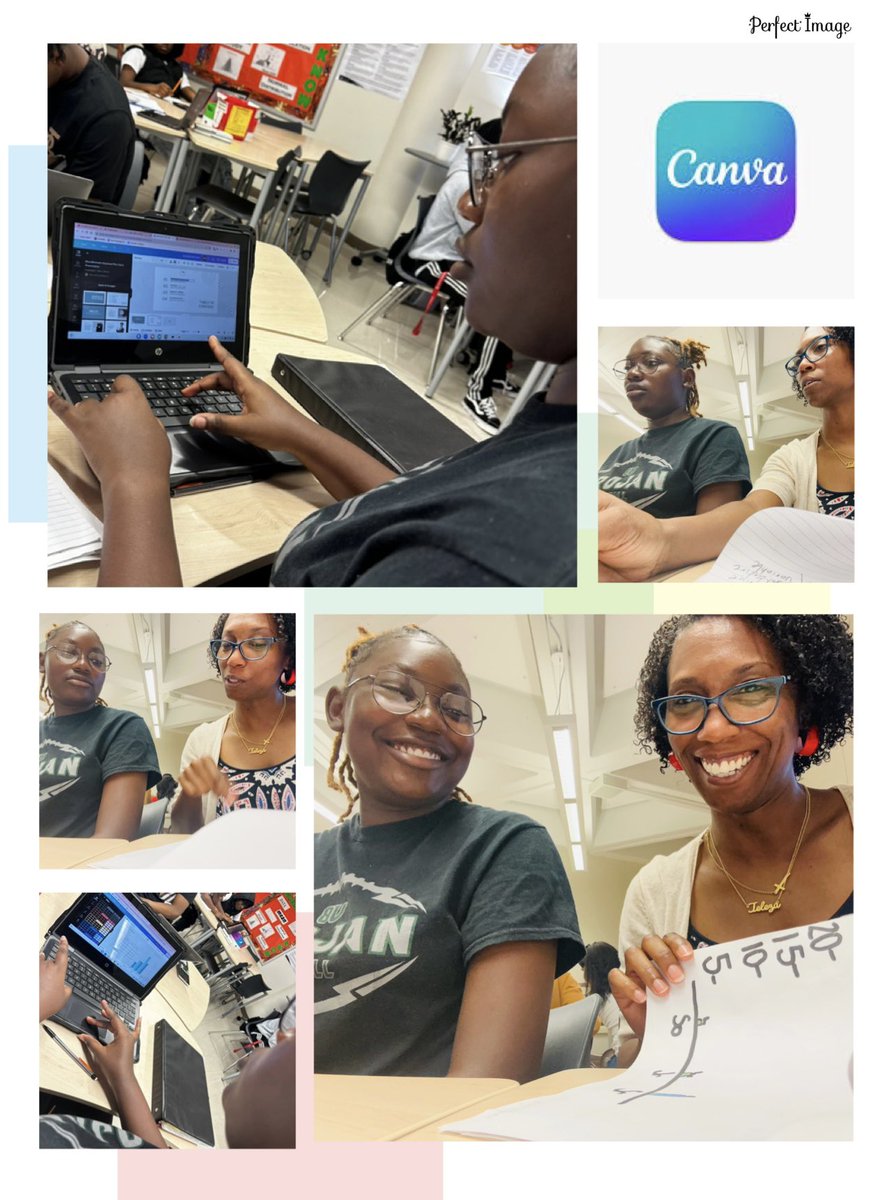
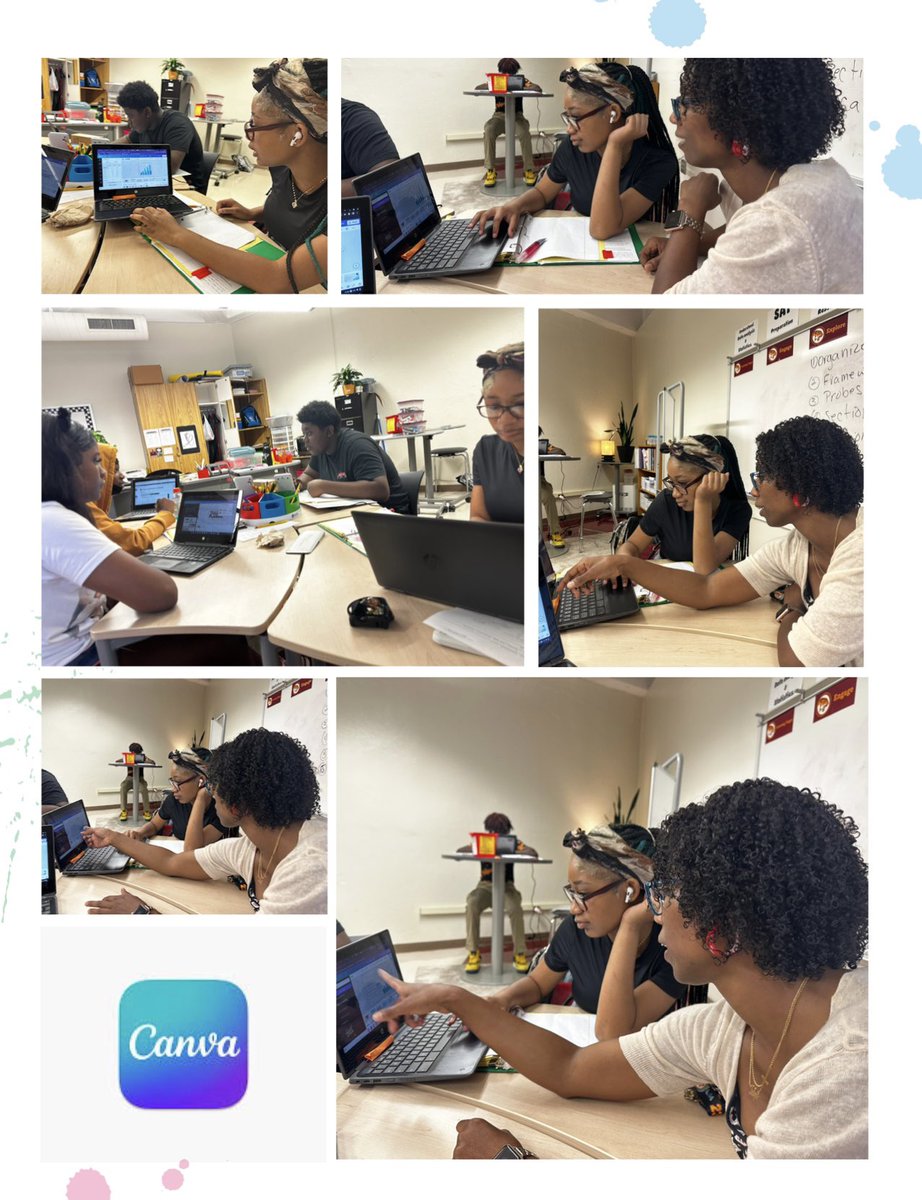
Big shoutout to Mr. Leaks for letting me co-teach in his class &for embracing innovative learning & to his brilliant students for turning data into art! 🙌Let’s keep the @canva creations coming! @apsitnatasha @ahrosser @APSMHJHSJaguars @APSInstructTech #coteaching #dataVisuals
4
786

1 Jun 2022
📣@FlorenceRabier Director-General of @ECMWF and expert in Numerical Weather Prediction will be part of the judging panel at #VisMetHack #Hackathon
➡️Have💡on how to improve #weather #datavisuals
➡️#hack it
➡️win🥇
Register👉events.ecmwf.int/event/305/r…
11/12 Jun @ECMWF, Reading, UK
11
24
25 May 2022
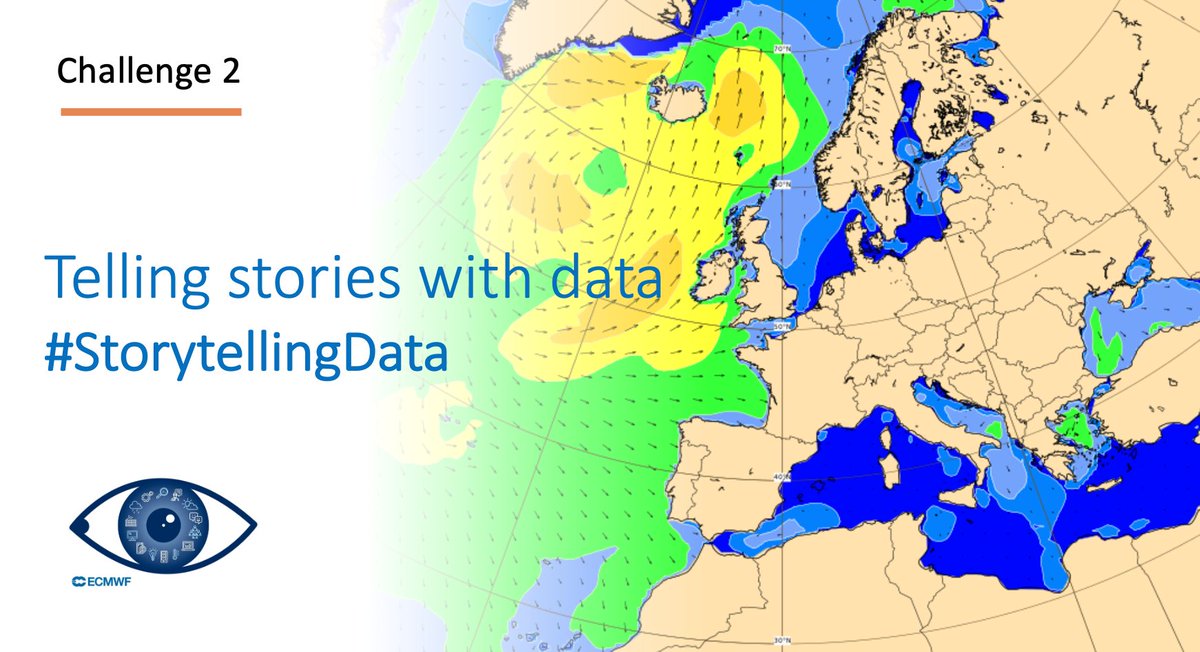
Challenge 2️⃣ proposed by #VisMetHack #hackathon @ECMWF on 11/12 June:
💡 on how to develop #datavisuals to tell a story about weather and climate #StorytellingData #waveheight #extremeevent
Start the 💬: github.com/vismethack/challe…
Register👉events.ecmwf.int/event/305/r…
1
3
7

23 Apr 2022
Check out this race chart to see how the number of users on content sharing sites has changed over time.
#racechart #datavisuals #datavisualisation #datavisualization #datascience #contentplatforms #socialmediastats #outgrow #datareel
1
2


7 Feb 2022
QUESTION | Community, how do you handle Alt-text for datavisuals? I'm working on a year in review with multiple visualisations and am wondering how to approach those. Just give the highlights? There's going to be text as well, think magazinesque
3
2

4 Feb 2022
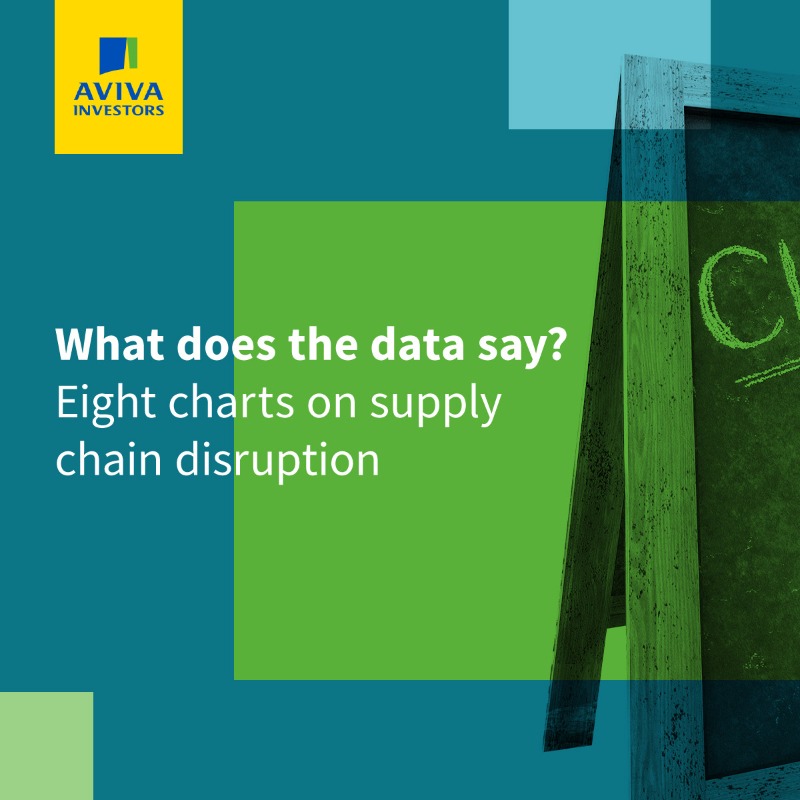
🚚 What are the implications of the continued disruption to supply chains?
Our latest data series explores in eight charts 👉 avivainvestors.com/en-gb/vie…
#datavisuals #dataviz #supplychain #charts #shipping #delivery #labour
1
3

20 Dec 2021
𝐍𝐢𝐞𝐮𝐰𝐞 𝐬𝐩𝐚𝐫𝐤𝐥𝐢𝐧𝐞-𝐟𝐮𝐧𝐜𝐭𝐢𝐨𝐧𝐚𝐥𝐢𝐭𝐞𝐢𝐭 𝐏𝐨𝐰𝐞𝐫 𝐁𝐈
In deze blog deelt onze Power BI expert, Dennis de Kock, een overzicht van de wijzigingen van deze maand.
proanalytics.nl/power-bi/nie…
#powerbi #sparkline #data #datastories #datavisuals
2
3

10 Dec 2021
🤪 Where to begin?
Merci voor het voorbeeld, kan ik meteen gebruiken in mijn lessen over kleurschema's in datavisuals 😅😅
1
5 Dec 2021
Parcels, the (other) Amazon and COVID19.
Read our latest data series to find out the stats 👉 avivainvestors.com/en-gb/vie…
#datavisuals #dataviz #deforestation #rainforest #amazon #climatechange #cop26 #brazil #covid19 #europe #pandemic #amazon #fedex #ups #shipments #supplychains
1
2

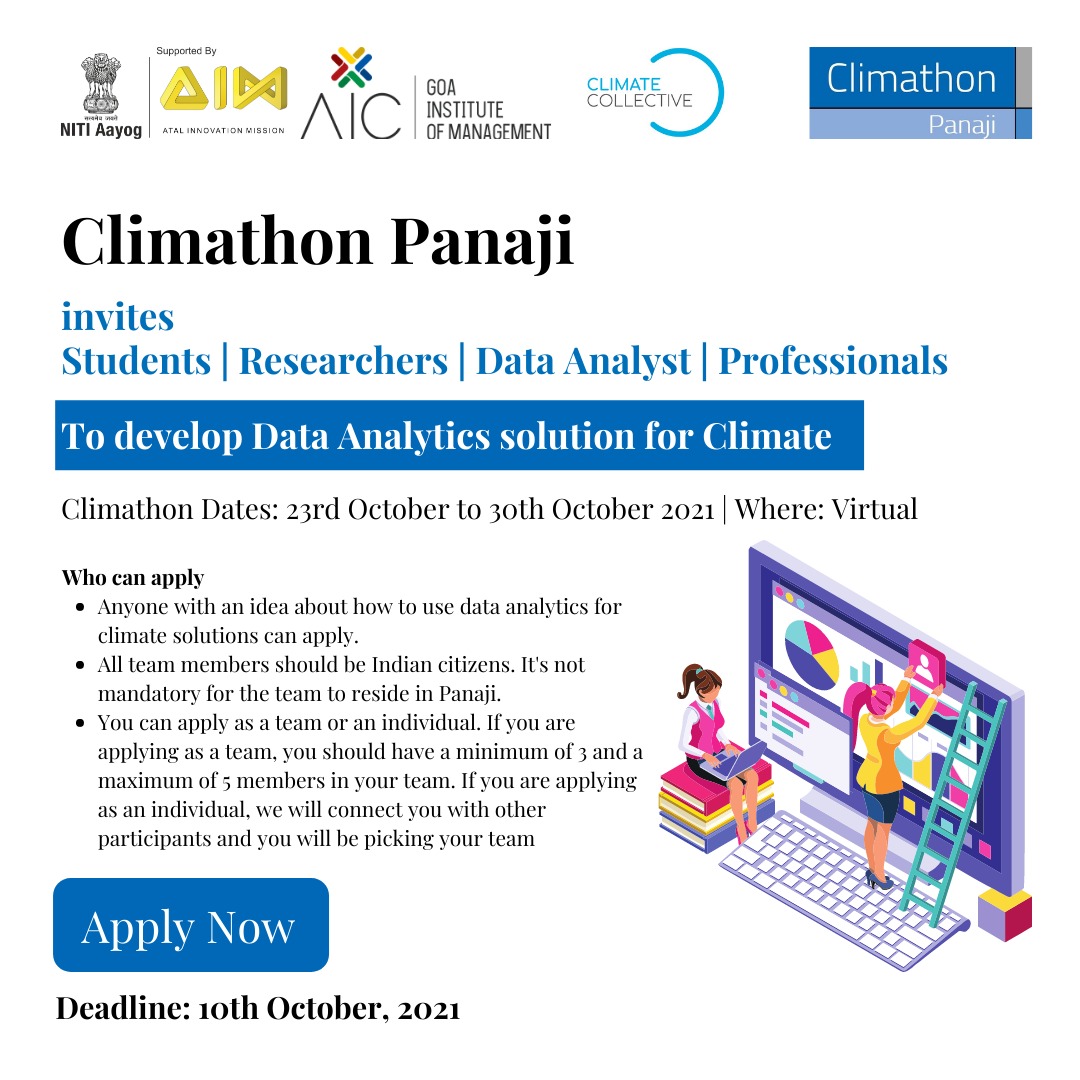
Join us to be a part of this thrilling experience at Climathon Panaji 2021 with the mentors, experts and coaches!
Apply now - climathon.climate-kic.org/as…
#climathon #climathonpanaji #dataanalytics #dataanalyticsforclimate #dataforgood #climatechange #data #datavisuals #dataworld
3
3
12 Sep 2021
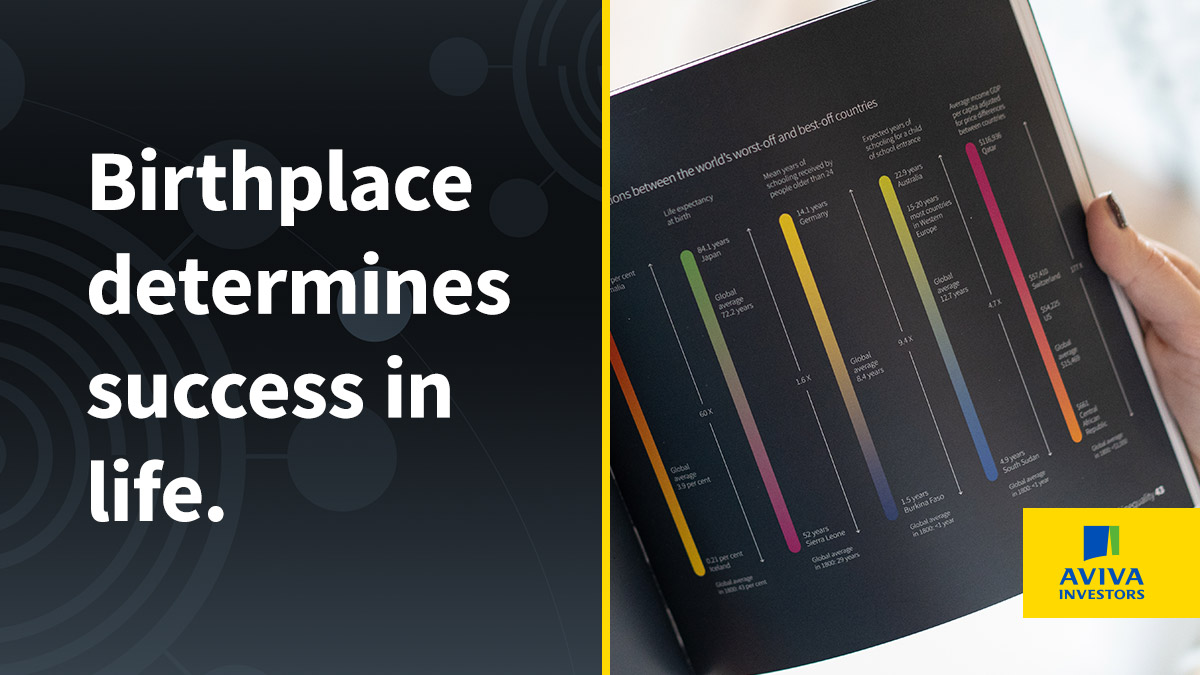
The Little Book of Data explores how birthplace determines success in life. The global average life expectancy is 72.2 years. What do you think this is for someone from Sierra Leone? avivainvestors.com/en-gb/vie…
#datavis #dataviz #datavisuals
1
2
20 Aug 2021
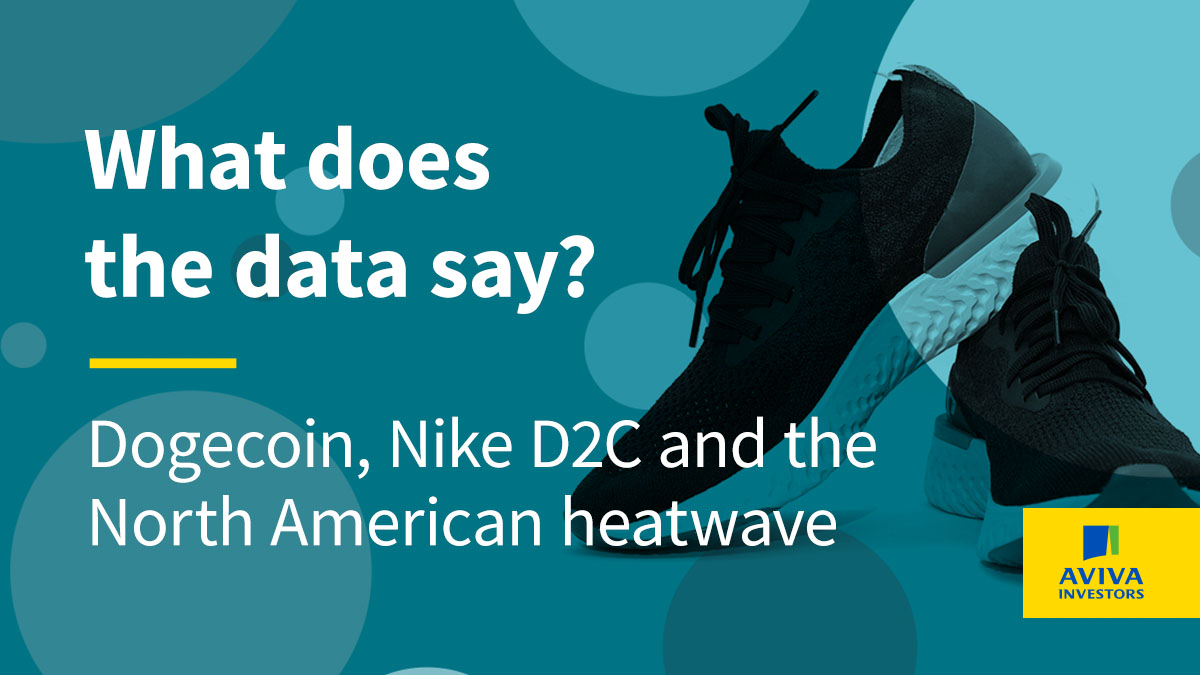
We look at @Dogecoin, @Nike D2C and the North American heatwave in our latest data series.
Explore this month’s highlights now: avivainvestors.com/en-gb/vie…
#datavisuals #dataviz #lytton
1
1
2