Once upon a time, there was a hardworking Project Manager who believed passion, long hours, and positive intent were enough to deliver success. He trusted his team, approved changes with a smile, and focused on deadlines—while costs quietly slipped through his fingers. One day, the numbers finally spoke. The budget was broken. Stakeholders lost trust. The project survived, but his confidence did not. That moment taught him a painful truth: projects don’t fail loudly… they fail silently through poor cost control.
The Art & Science of Cost Management : lnkd.in/dWDjt-PR
📉 The Hidden Reality of Project Cost Management
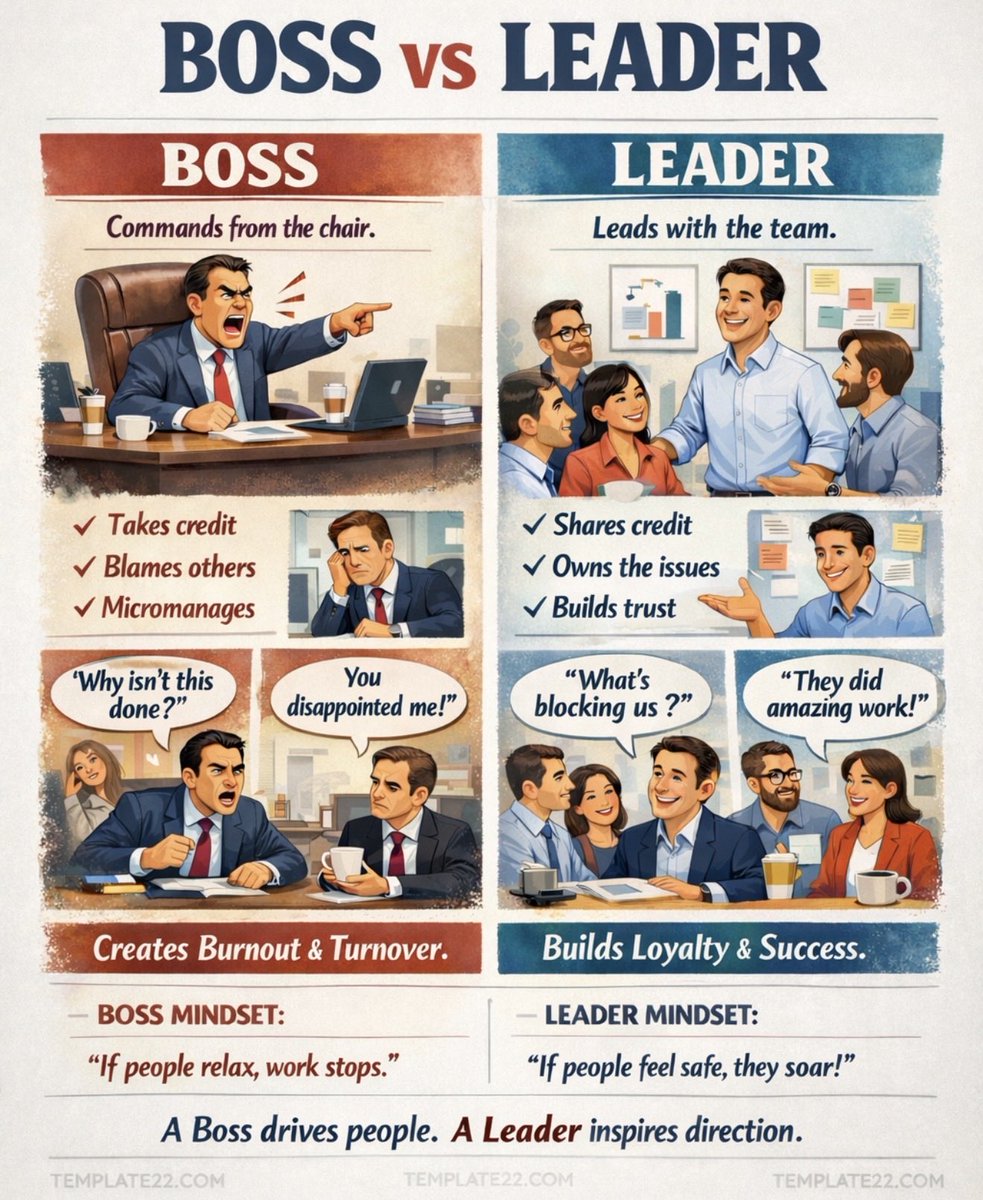
According to PMI, nearly 48% of projects exceed their original budgets, not because teams lack skill, but because cost is not actively managed. Cost Management is not accounting. It is leadership. It is the ability to see financial signals early and act before damage becomes irreversible.
🧠 Why Cost Planning Changes Everything
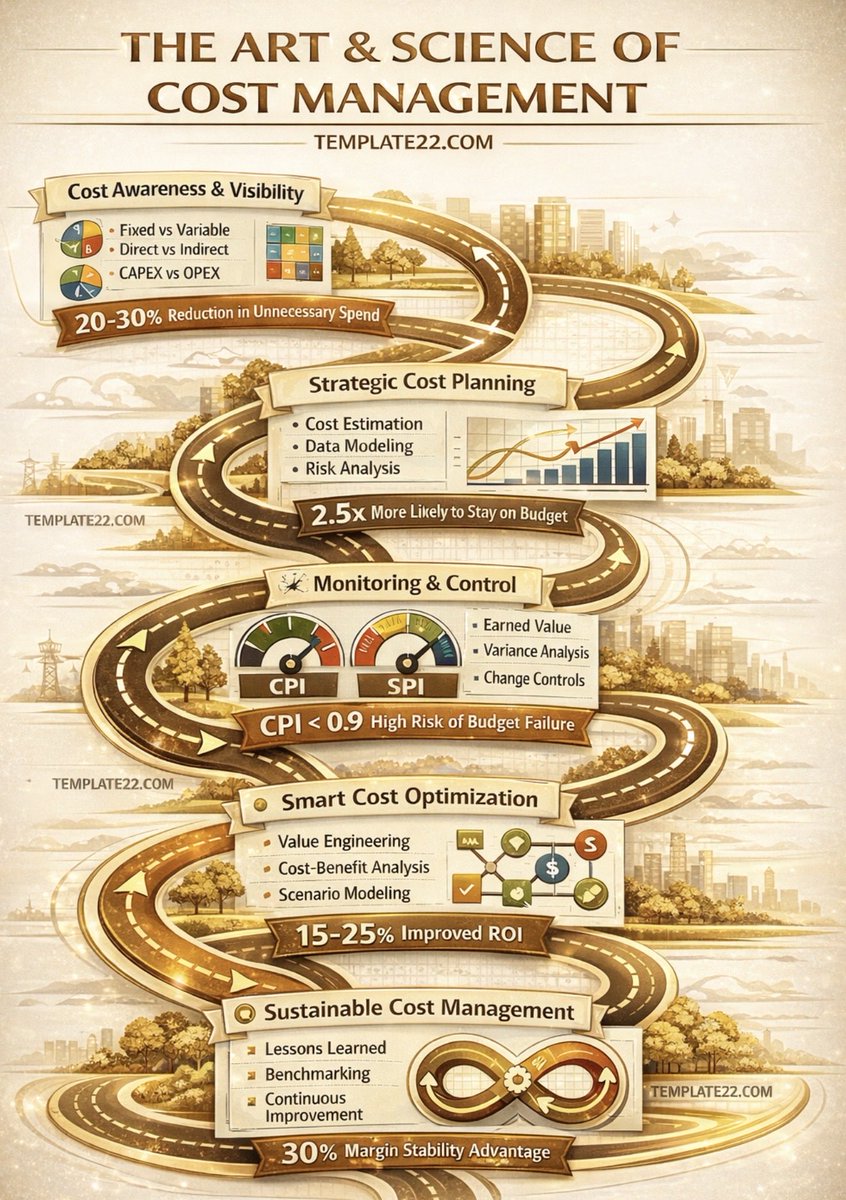
Projects that clearly define cost strategies upfront improve financial predictability by 35%. Cost planning sets rules, accuracy levels, thresholds, and reporting rhythms. Without it, decisions become emotional instead of data-driven.
📊 Icon Insight: Planning today prevents panic tomorrow.
📐 Estimation Is Not Guesswork
Organizations using structured estimation techniques such as bottom-up and three-point estimation achieve 30–40% better cost accuracy. Estimation is where discipline beats optimism. When numbers are grounded, confidence grows.
📈 Formula Power = Logic over assumptions.
💰 Budgeting Creates Financial Discipline
Projects with approved cost baselines are 2x more likely to finish within budget. Budgeting transforms scattered estimates into a controlled financial roadmap. It aligns time, scope, and money into one visible baseline.
🧭 Think of budgeting as your financial GPS.
📊 Cost Control Is Where Leaders Are Made
Earned Value Management is not complex—it is clarity. CPI below 0.9 is a danger signal. CPI above 1.0 is control. Projects using active cost control recover from deviations 25% faster than those reacting late.
🚦 Data does not judge. It guides.
🔮 Forecasting Turns Fear Into Confidence
Early forecasting reduces final overruns by up to 25%. When leaders forecast EAC, ETC, and VAC regularly, surprises disappear. Control replaces chaos.
📉 The future becomes manageable when you measure it.
📢 Reporting Builds Trust
Transparent cost reporting improves executive confidence by 60%. When stakeholders see truth early, they support decisions instead of questioning them.
🤝 Trust is built on visibility.
🚀 Your Next Step Starts Now
Cost Management is not optional. It is the difference between surviving projects and leading them. If you are ready to move from effort to control, from stress to certainty, equip yourself with proven systems
👉 Buy The Art & Science of Cost Management : lnkd.in/dWDjt-PR
#ProjectCostManagement #CostControl #EarnedValue #PMTools #Template22
1
2
9
3,526
Once upon a time, there was a hardworking Project Manager who believed passion, long hours, and positive intent were enough to deliver success. He trusted his team, approved changes with a smile, and focused on deadlines—while costs quietly slipped through his fingers. One day, the numbers finally spoke. The budget was broken. Stakeholders lost trust. The project survived, but his confidence did not. That moment taught him a painful truth: projects don’t fail loudly… they fail silently through poor cost control.
The Art & Science of Cost Management : lnkd.in/dWDjt-PR
📉 The Hidden Reality of Project Cost Management
According to PMI, nearly 48% of projects exceed their original budgets, not because teams lack skill, but because cost is not actively managed. Cost Management is not accounting. It is leadership. It is the ability to see financial signals early and act before damage becomes irreversible.
🧠 Why Cost Planning Changes Everything
Projects that clearly define cost strategies upfront improve financial predictability by 35%. Cost planning sets rules, accuracy levels, thresholds, and reporting rhythms. Without it, decisions become emotional instead of data-driven.
📊 Icon Insight: Planning today prevents panic tomorrow.
📐 Estimation Is Not Guesswork
Organizations using structured estimation techniques such as bottom-up and three-point estimation achieve 30–40% better cost accuracy. Estimation is where discipline beats optimism. When numbers are grounded, confidence grows.
📈 Formula Power = Logic over assumptions.
💰 Budgeting Creates Financial Discipline
Projects with approved cost baselines are 2x more likely to finish within budget. Budgeting transforms scattered estimates into a controlled financial roadmap. It aligns time, scope, and money into one visible baseline.
🧭 Think of budgeting as your financial GPS.
📊 Cost Control Is Where Leaders Are Made
Earned Value Management is not complex—it is clarity. CPI below 0.9 is a danger signal. CPI above 1.0 is control. Projects using active cost control recover from deviations 25% faster than those reacting late.
🚦 Data does not judge. It guides.
🔮 Forecasting Turns Fear Into Confidence
Early forecasting reduces final overruns by up to 25%. When leaders forecast EAC, ETC, and VAC regularly, surprises disappear. Control replaces chaos.
📉 The future becomes manageable when you measure it.
📢 Reporting Builds Trust
Transparent cost reporting improves executive confidence by 60%. When stakeholders see truth early, they support decisions instead of questioning them.
🤝 Trust is built on visibility.
🚀 Your Next Step Starts Now
Cost Management is not optional. It is the difference between surviving projects and leading them. If you are ready to move from effort to control, from stress to certainty, equip yourself with proven systems
👉 Buy The Art & Science of Cost Management : lnkd.in/dWDjt-PR
#ProjectCostManagement #CostControl #EarnedValue #PMTools #Template22
2
10
3,570
Once upon a time, there was a hardworking Project Manager who believed passion, long hours, and positive intent were enough to deliver success. He trusted his team, approved changes with a smile, and focused on deadlines—while costs quietly slipped through his fingers. One day, the numbers finally spoke. The budget was broken. Stakeholders lost trust. The project survived, but his confidence did not. That moment taught him a painful truth: projects don’t fail loudly… they fail silently through poor cost control.
The Art & Science of Cost Management : lnkd.in/dWDjt-PR
📉 The Hidden Reality of Project Cost Management
According to PMI, nearly 48% of projects exceed their original budgets, not because teams lack skill, but because cost is not actively managed. Cost Management is not accounting. It is leadership. It is the ability to see financial signals early and act before damage becomes irreversible.
🧠 Why Cost Planning Changes Everything
Projects that clearly define cost strategies upfront improve financial predictability by 35%. Cost planning sets rules, accuracy levels, thresholds, and reporting rhythms. Without it, decisions become emotional instead of data-driven.
📊 Icon Insight: Planning today prevents panic tomorrow.
📐 Estimation Is Not Guesswork
Organizations using structured estimation techniques such as bottom-up and three-point estimation achieve 30–40% better cost accuracy. Estimation is where discipline beats optimism. When numbers are grounded, confidence grows.
📈 Formula Power = Logic over assumptions.
💰 Budgeting Creates Financial Discipline
Projects with approved cost baselines are 2x more likely to finish within budget. Budgeting transforms scattered estimates into a controlled financial roadmap. It aligns time, scope, and money into one visible baseline.
🧭 Think of budgeting as your financial GPS.
📊 Cost Control Is Where Leaders Are Made
Earned Value Management is not complex—it is clarity. CPI below 0.9 is a danger signal. CPI above 1.0 is control. Projects using active cost control recover from deviations 25% faster than those reacting late.
🚦 Data does not judge. It guides.
🔮 Forecasting Turns Fear Into Confidence
Early forecasting reduces final overruns by up to 25%. When leaders forecast EAC, ETC, and VAC regularly, surprises disappear. Control replaces chaos.
📉 The future becomes manageable when you measure it.
📢 Reporting Builds Trust
Transparent cost reporting improves executive confidence by 60%. When stakeholders see truth early, they support decisions instead of questioning them.
🤝 Trust is built on visibility.
🚀 Your Next Step Starts Now
Cost Management is not optional. It is the difference between surviving projects and leading them. If you are ready to move from effort to control, from stress to certainty, equip yourself with proven systems
👉 Buy The Art & Science of Cost Management : lnkd.in/dWDjt-PR
#ProjectCostManagement #CostControl #EarnedValue #PMTools #Template22
1
6
3,962
Once upon a time, there was a hardworking Project Manager who believed passion, long hours, and positive intent were enough to deliver success. He trusted his team, approved changes with a smile, and focused on deadlines—while costs quietly slipped through his fingers. One day, the numbers finally spoke. The budget was broken. Stakeholders lost trust. The project survived, but his confidence did not. That moment taught him a painful truth: projects don’t fail loudly… they fail silently through poor cost control.
The Art & Science of Cost Management : lnkd.in/dWDjt-PR
📉 The Hidden Reality of Project Cost Management
According to PMI, nearly 48% of projects exceed their original budgets, not because teams lack skill, but because cost is not actively managed. Cost Management is not accounting. It is leadership. It is the ability to see financial signals early and act before damage becomes irreversible.
🧠 Why Cost Planning Changes Everything
Projects that clearly define cost strategies upfront improve financial predictability by 35%. Cost planning sets rules, accuracy levels, thresholds, and reporting rhythms. Without it, decisions become emotional instead of data-driven.
📊 Icon Insight: Planning today prevents panic tomorrow.
📐 Estimation Is Not Guesswork
Organizations using structured estimation techniques such as bottom-up and three-point estimation achieve 30–40% better cost accuracy. Estimation is where discipline beats optimism. When numbers are grounded, confidence grows.
📈 Formula Power = Logic over assumptions.
💰 Budgeting Creates Financial Discipline
Projects with approved cost baselines are 2x more likely to finish within budget. Budgeting transforms scattered estimates into a controlled financial roadmap. It aligns time, scope, and money into one visible baseline.
🧭 Think of budgeting as your financial GPS.
📊 Cost Control Is Where Leaders Are Made
Earned Value Management is not complex—it is clarity. CPI below 0.9 is a danger signal. CPI above 1.0 is control. Projects using active cost control recover from deviations 25% faster than those reacting late.
🚦 Data does not judge. It guides.
🔮 Forecasting Turns Fear Into Confidence
Early forecasting reduces final overruns by up to 25%. When leaders forecast EAC, ETC, and VAC regularly, surprises disappear. Control replaces chaos.
📉 The future becomes manageable when you measure it.
📢 Reporting Builds Trust
Transparent cost reporting improves executive confidence by 60%. When stakeholders see truth early, they support decisions instead of questioning them.
🤝 Trust is built on visibility.
🚀 Your Next Step Starts Now
Cost Management is not optional. It is the difference between surviving projects and leading them. If you are ready to move from effort to control, from stress to certainty, equip yourself with proven systems
👉 Buy The Art & Science of Cost Management : lnkd.in/dWDjt-PR
#ProjectCostManagement #CostControl #EarnedValue #PMTools #Template22

2
3
503
Once upon a time, there was a hardworking Project Manager who believed passion, long hours, and positive intent were enough to deliver success. He trusted his team, approved changes with a smile, and focused on deadlines—while costs quietly slipped through his fingers. One day, the numbers finally spoke. The budget was broken. Stakeholders lost trust. The project survived, but his confidence did not. That moment taught him a painful truth: projects don’t fail loudly… they fail silently through poor cost control.
The Art & Science of Cost Management : lnkd.in/dWDjt-PR
📉 The Hidden Reality of Project Cost Management
According to PMI, nearly 48% of projects exceed their original budgets, not because teams lack skill, but because cost is not actively managed. Cost Management is not accounting. It is leadership. It is the ability to see financial signals early and act before damage becomes irreversible.
🧠 Why Cost Planning Changes Everything
Projects that clearly define cost strategies upfront improve financial predictability by 35%. Cost planning sets rules, accuracy levels, thresholds, and reporting rhythms. Without it, decisions become emotional instead of data-driven.
📊 Icon Insight: Planning today prevents panic tomorrow.
📐 Estimation Is Not Guesswork
Organizations using structured estimation techniques such as bottom-up and three-point estimation achieve 30–40% better cost accuracy. Estimation is where discipline beats optimism. When numbers are grounded, confidence grows.
📈 Formula Power = Logic over assumptions.
💰 Budgeting Creates Financial Discipline
Projects with approved cost baselines are 2x more likely to finish within budget. Budgeting transforms scattered estimates into a controlled financial roadmap. It aligns time, scope, and money into one visible baseline.
🧭 Think of budgeting as your financial GPS.
📊 Cost Control Is Where Leaders Are Made
Earned Value Management is not complex—it is clarity. CPI below 0.9 is a danger signal. CPI above 1.0 is control. Projects using active cost control recover from deviations 25% faster than those reacting late.
🚦 Data does not judge. It guides.
🔮 Forecasting Turns Fear Into Confidence
Early forecasting reduces final overruns by up to 25%. When leaders forecast EAC, ETC, and VAC regularly, surprises disappear. Control replaces chaos.
📉 The future becomes manageable when you measure it.
📢 Reporting Builds Trust
Transparent cost reporting improves executive confidence by 60%. When stakeholders see truth early, they support decisions instead of questioning them.
🤝 Trust is built on visibility.
🚀 Your Next Step Starts Now
Cost Management is not optional. It is the difference between surviving projects and leading them. If you are ready to move from effort to control, from stress to certainty, equip yourself with proven systems
👉 Buy The Art & Science of Cost Management : lnkd.in/dWDjt-PR
#ProjectCostManagement #CostControl #EarnedValue #PMTools #Template22

3
13
3,118

31 Dec 2025
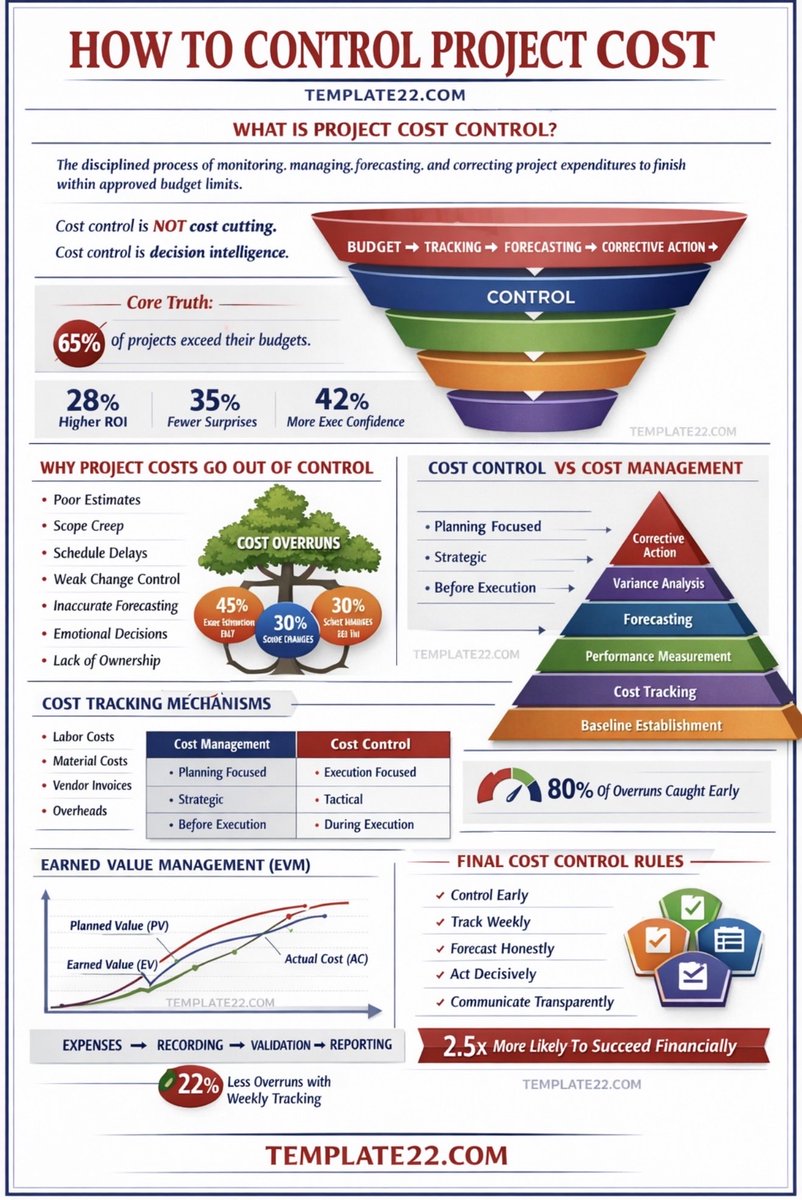
Let’s be honest—project cost control sometimes feels like babysitting a wallet that keeps running away. One minute the budget is smiling at you, the next minute it’s crying in a corner asking for “just one more approval.” Funny thing is, nobody plans to overspend. It just… happens. A small change here, a rushed decision there, a vendor “misunderstanding,” and suddenly your budget is doing cardio without your permission. Cost control isn’t boring finance work—it’s leadership under pressure.
Here’s the truth most people avoid: cost control is not about cutting expenses. It’s about deciding intentionally. Studies show that nearly 65% of projects exceed their original budgets, and poor cost visibility is the number one reason. When leaders don’t see costs clearly, money leaks quietly. When they do, costs obey.
High-Quality Project Management Templates & Documents: lnkd.in/dCGqF98z
Controlling project cost starts with clarity. You define scope so money doesn’t chase undefined work. You break tasks into measurable units so spending becomes visible. Research shows projects using structured cost baselines are 40% more likely to finish within budget. You track actual costs weekly, not monthly, because delays hide problems. Earned Value Management becomes your early warning system—projects with CPI monitoring reduce overruns by up to 25%.
Then comes discipline. Scope changes are approved, not sneaked in. Vendors are verified, not trusted blindly. Rework is reduced through quality checks, because rework alone can consume 20–30% of total project cost. You forecast the final cost early, because waiting until the end is not optimism—it’s denial.
Cost control is also communication. Transparent reporting builds trust. Fast corrective action saves money. According to PMI data, projects with proactive cost governance save an average of 15% compared to reactive teams. That difference decides careers, reputations, and future opportunities.
When you master cost control, something powerful happens. You stop reacting. You start leading. Money becomes a tool, not a threat. And suddenly, stakeholders stop asking, “Are we over budget?”—because they already know you’re in control.
If you’re serious about mastering project cost control with professional structure, clarity, and speed, use proven systems instead of reinventing everything.
👉 Buy our High-Quality Project Management Templates & Documents here: lnkd.in/dCGqF98z
#ProjectManagement #CostControl #ProjectLeadership #BudgetManagement #PMTools #ProjectSuccess #Templates #PMO #EarnedValue #Leadership

1
3
8
3,513
30 Dec 2025
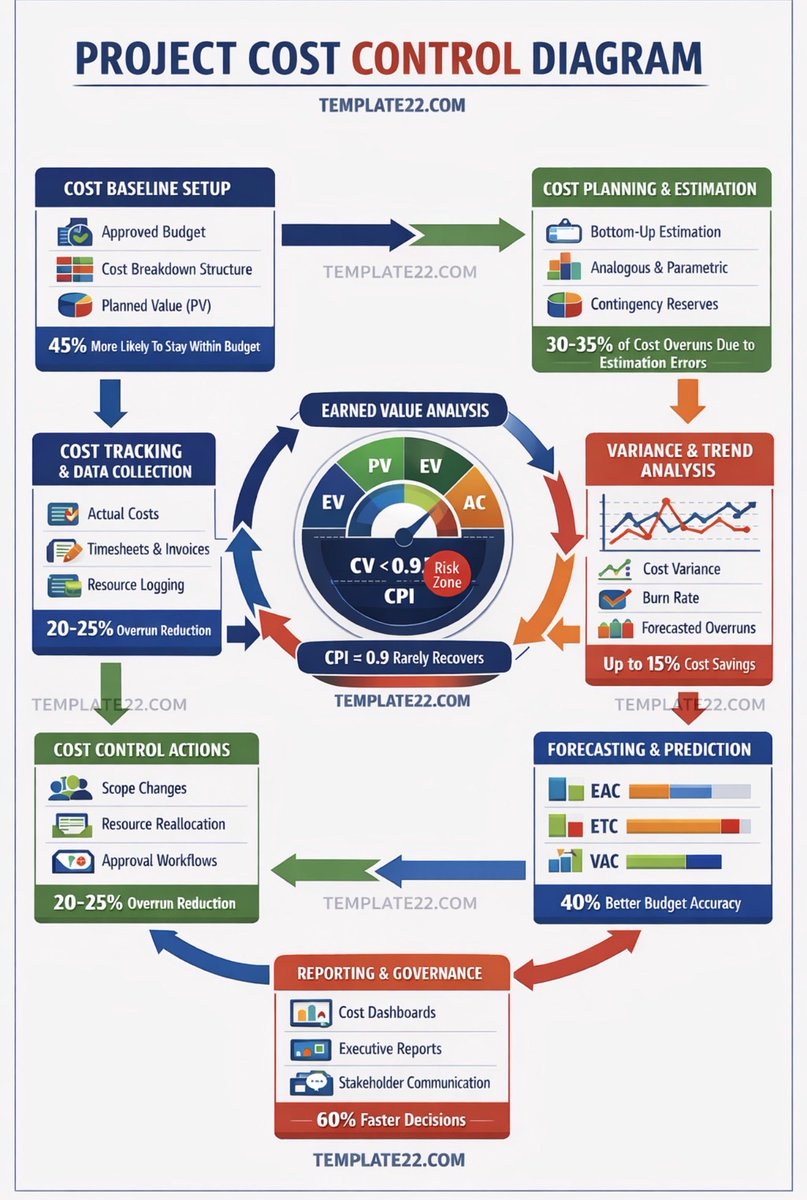
The real project leadership begins the moment you can see where every dollar is going, why it is moving, and what will happen next. Research shows nearly 70% of projects exceed their original budget, not due to bad intent, but due to weak cost visibility. A Project Cost Control Diagram turns confusion into clarity. It gives you a living picture of cost behavior, not static numbers. When leaders can visualize cost flow, decisions become faster, calmer, and smarter.
Project Cost Control Diagram
Strong cost control starts with a solid baseline. Industry data confirms that projects with an approved cost baseline are 45% more likely to finish within budget. The diagram begins by locking scope, budget, and planned value together. This creates financial discipline. From there, cost planning and estimation feed the system using bottom-up and parametric techniques. Studies show that 30–35% of overruns come from poor estimation, which is why visual cost planning blocks matter. You don’t guess costs. You design them.
High-Quality Project Management Templates & Documents: lnkd.in/dCGqF98z
Once the baseline is set, tracking becomes the heartbeat of control. Actual costs, invoices, and resource logs flow continuously into the diagram. Organizations that track costs weekly reduce overruns by 20–25%. At the center sits Earned Value Analysis, the true engine of cost intelligence. Metrics like EV, AC, CV, and CPI transform raw spending into meaning. Data shows that projects with a CPI below 0.9 rarely recover without immediate intervention. The diagram makes risk visible before damage becomes permanent.
Variance and trend analysis turn history into insight. Line charts, burn rates, and deviation indicators reveal whether today’s problem is noise or a real threat. Early variance detection can save up to 15% of total project cost. Forecasting then shifts the focus forward. EAC, ETC, and VAC help leaders see the financial future with confidence. Organizations using forecast-driven control improve budget accuracy by 40%, proving that prediction beats reaction every time.
Cost control actions close the loop. Scope adjustments, resource reallocation, and approval workflows are triggered by data, not emotion. Formal cost governance reduces budget leakage by 28%. Finally, reporting completes the system. Executives using dashboards make decisions 60% faster, because clarity removes hesitation. A Project Cost Control Diagram is not a drawing. It is a leadership mindset that protects profit, credibility, and momentum.
👉 Take control of your projects today. Buy our High-Quality Project Management Templates & Documents:
lnkd.in/dCGqF98z
#ProjectManagement #CostControl #EarnedValue #ProjectLeadership #PMTools #BudgetControl #Template22
3
6
2,887

13 Jul 2025
Trustless systems are meaningless without trustworthy participants.
@vooi_io guarantees human uniqueness without revealing your private data. @KaitoAI_ builds AI that doesn’t just guess, but shows its reasoning and provenance. @cookie_fun makes your time online count by rewarding real engagement.
Together, they build the ethical backbone of Web3, where decentralization meets accountability and value.
Join the future where humans and AI collaborate transparently — and your attention is more than a click.
#VOOI #KaitoAI #CookieFi #DigitalIdentity #AITransparency #EarnedValue

3
3
38

29 Sep 2023
Join the Lawrence Livermore National Laboratory team! See our latest job opening here: bit.ly/3ryKIZY #EarnedValue #NuclearJobs
197

22 Mar 2023
Are you looking for a key performance indicator that can help your project team succeed? Check out the Schedule Performance Index (SPI)! This ratio tells you if you are ahead, on, or behind schedule.
#projectmanagement #spi #scheduleperformanceindex #earnedvalue #plannedvalue
1
6
169

19 Jan 2023
📍 @IngenieriaSCI y #SoyPMICaribe 💪invita a todos los interesados al grupo de interés de buenas prácticas en Proyectos de Construcción. Iniciamos el año con este evento enfocado en MONITOREO Y CONTROL.🔗ow.ly/qS0650Muv4Z #alianzas #earnedvalue #cadavezsomosmas #PMILatam
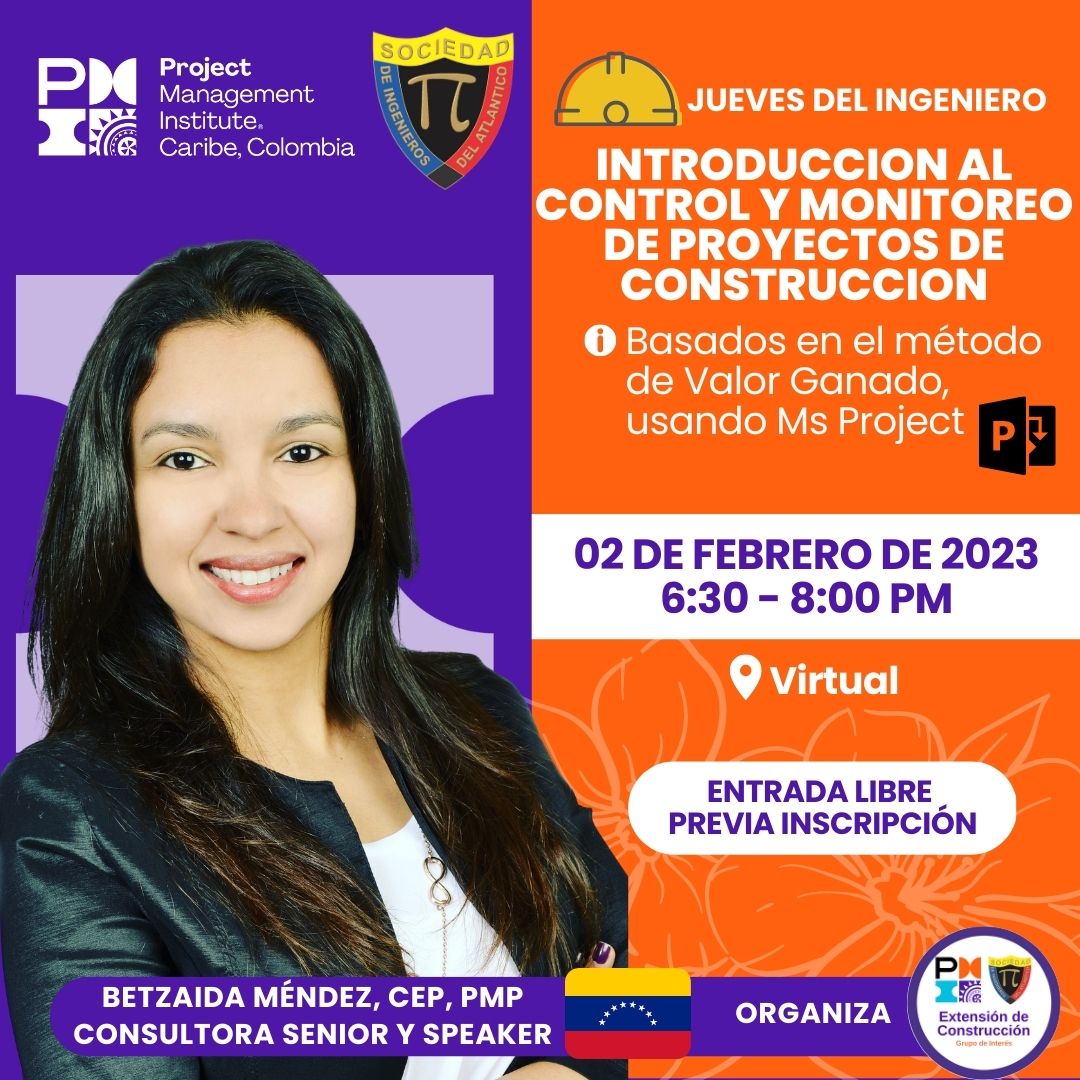
11
808


20 Jun 2022
ClearPlan had an excellent time being in-person and attending the 7th Annual Government Contract Pricing Summit hosted by @ProPricer 💰
📷 Captured below is ClearPlan Manager Lee Miller attending the event along with Dan Chripczuk, and Mike Lee.
#GCPsummit #earnedvalue

2

22 Feb 2022
Attending Advancing Project Controls 2022 this week? Be sure to join MBP's Niyi Ladipo, CCM, CCP, EVP, on Wednesday as she participates on a panel discussing how to combine cost and time in #earnedvalue to increase the level of detail in schedules. bit.ly/3K2ucoP

14 Nov 2021
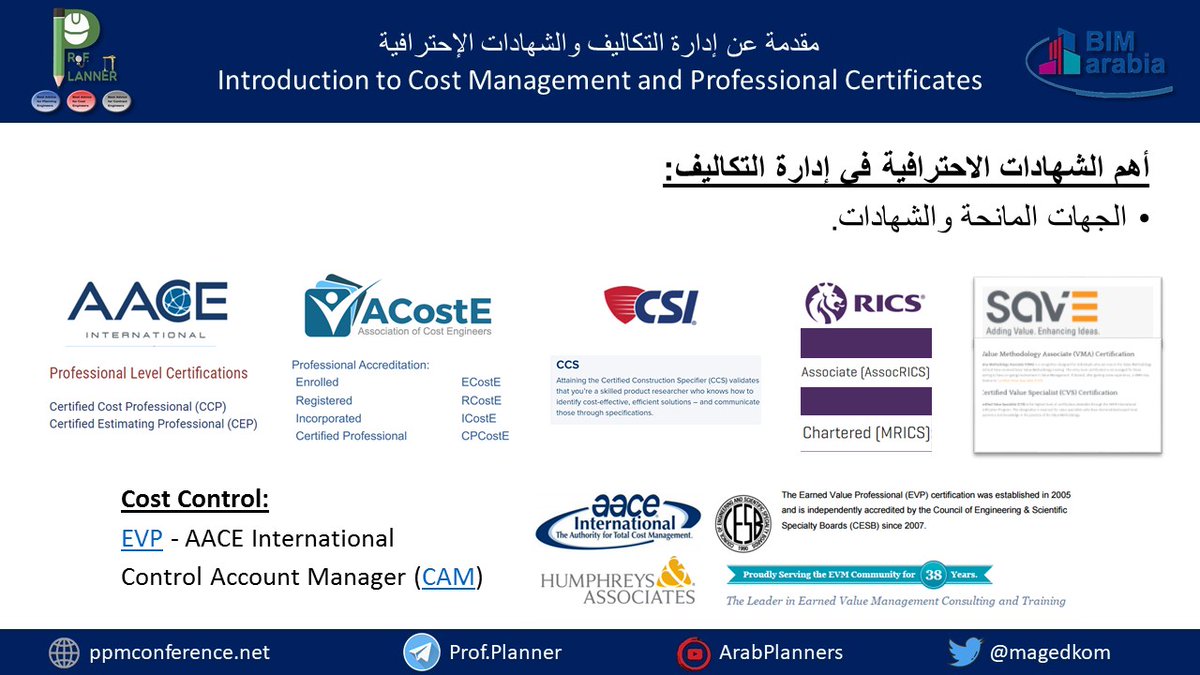
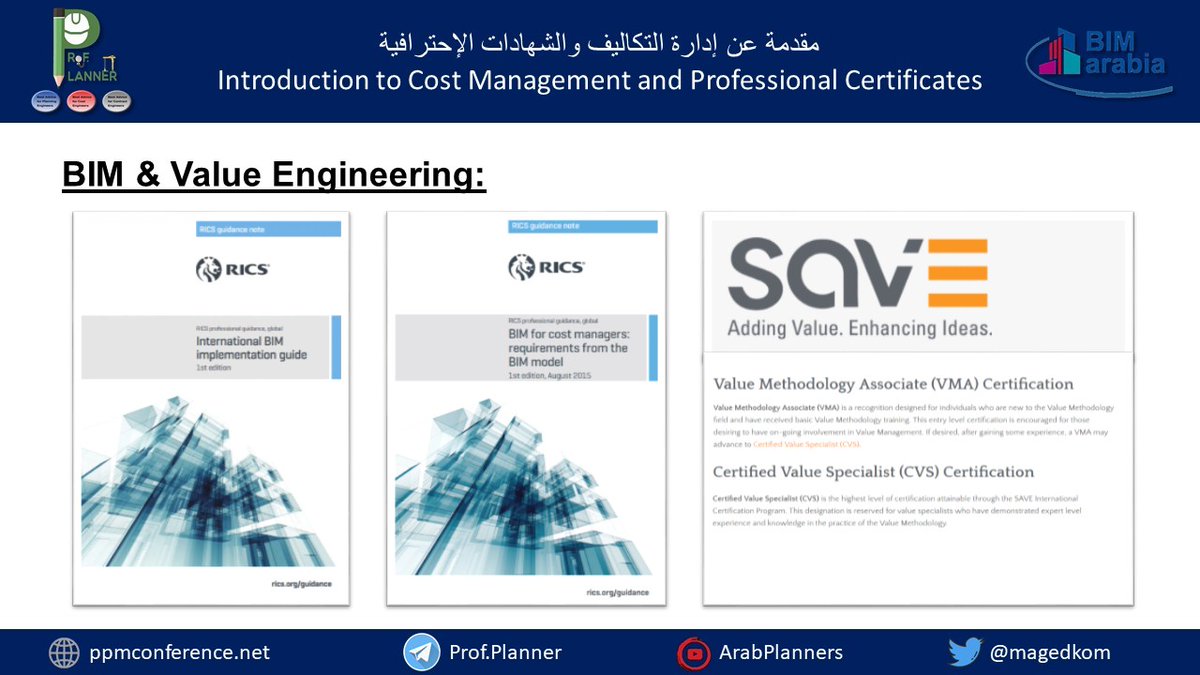
Professional certificates in cost mangement
أهم الشهادات الاحترافية في إدارة التكاليف
EVM (English): luqmanacademy.com/course?cou…
The course in Arabic: luqmanacademy.com/course?cou…
#profplanner #costmanagement #earnedvalue #quantitysurveying #CostEstimating #pmp #ccp #pmi #aacei #RICS
1
1
4

Let’s Take Senior Back! It’s the topic of my Vegas Voice, November 2021 article. What are your thoughts about this topic?
#aging #seniorcitizens #positiveaging #seniors #letstakeseniorback #titles #whodecides #weveearnedit #wisdom #experience #earnedvalue #seniorspeaksvolumes

1
2
10 Nov 2021
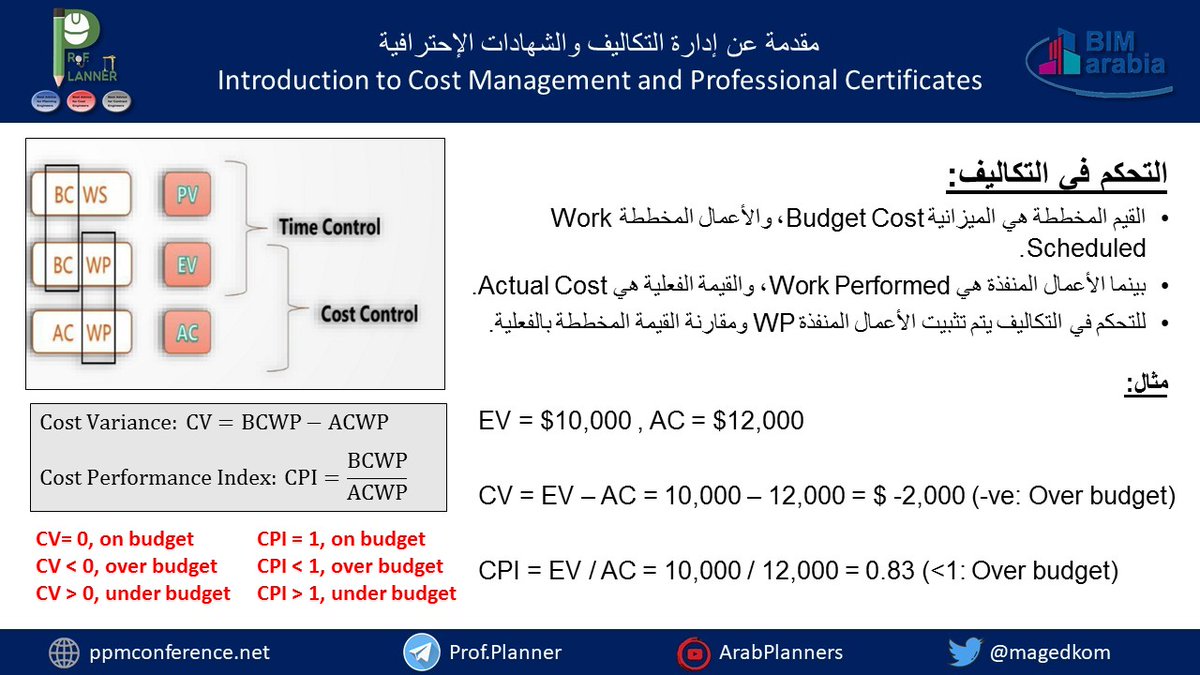
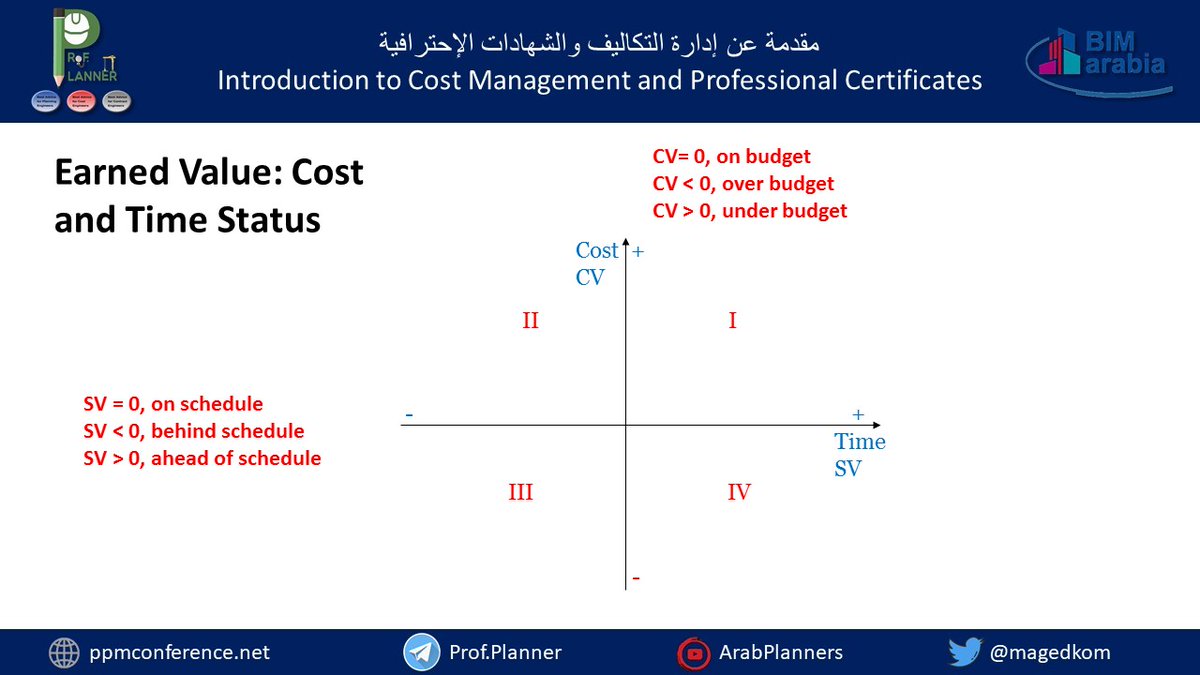
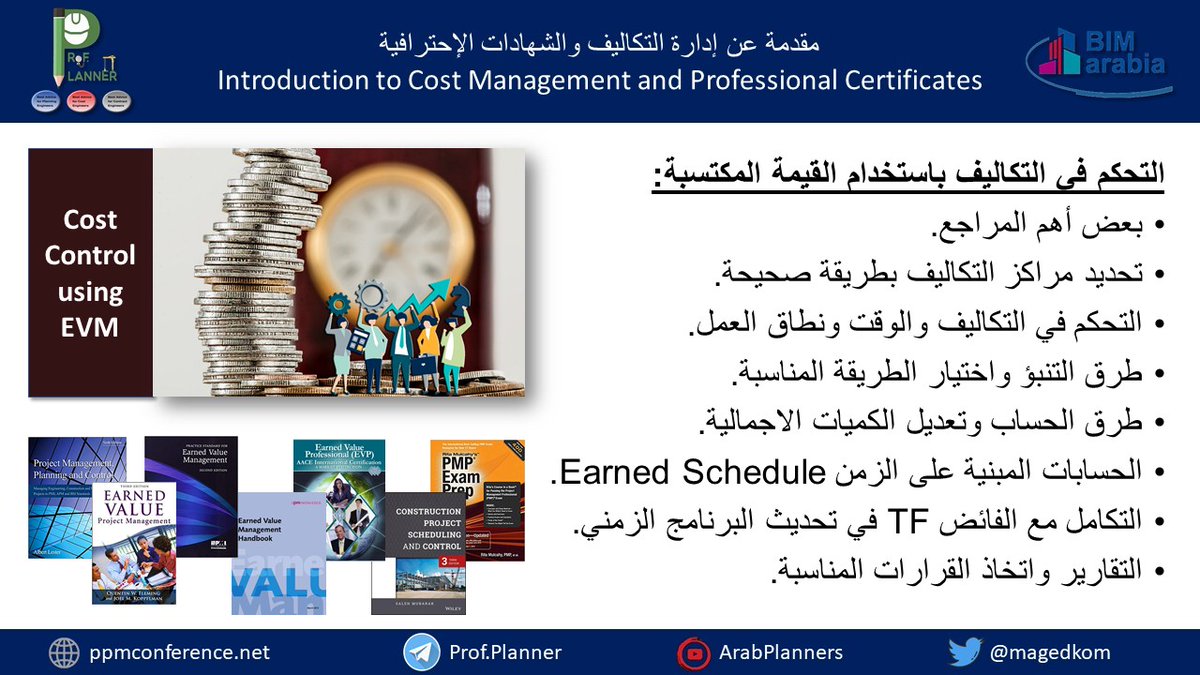
Earned Value Analysis
تحليل القيمة المكتسبة
Project Control Using EVM (English): luqmanacademy.com/course?cou…
The course in Arabic: luqmanacademy.com/course?cou…
#profplanner #costmanagement #earnedvalue #quantitysurveying #CostEstimating #pmp #ccp #pmi #aacei #RICS #ciarb #RSmeans
6
10 Nov 2021
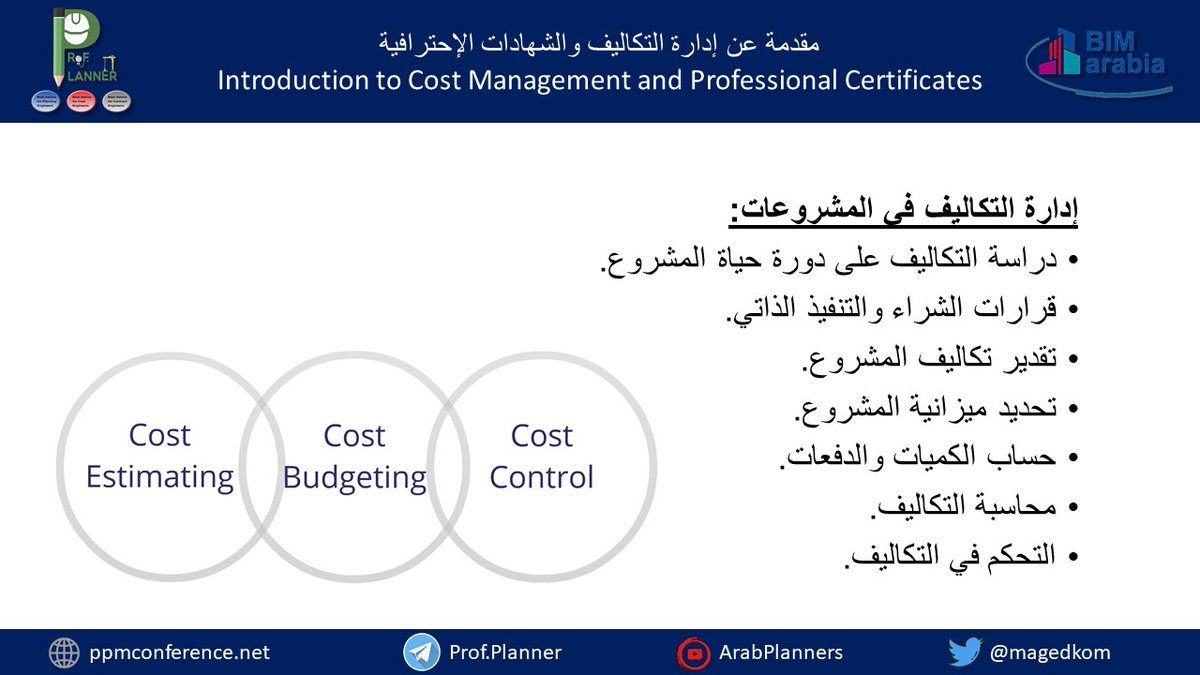
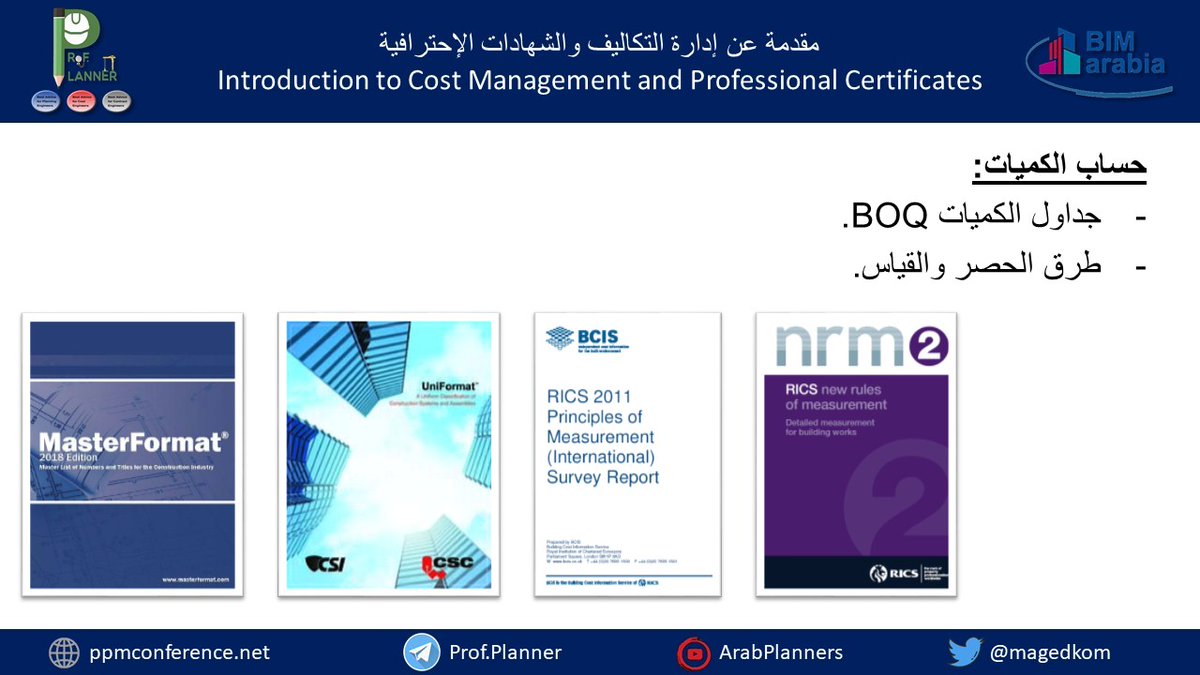
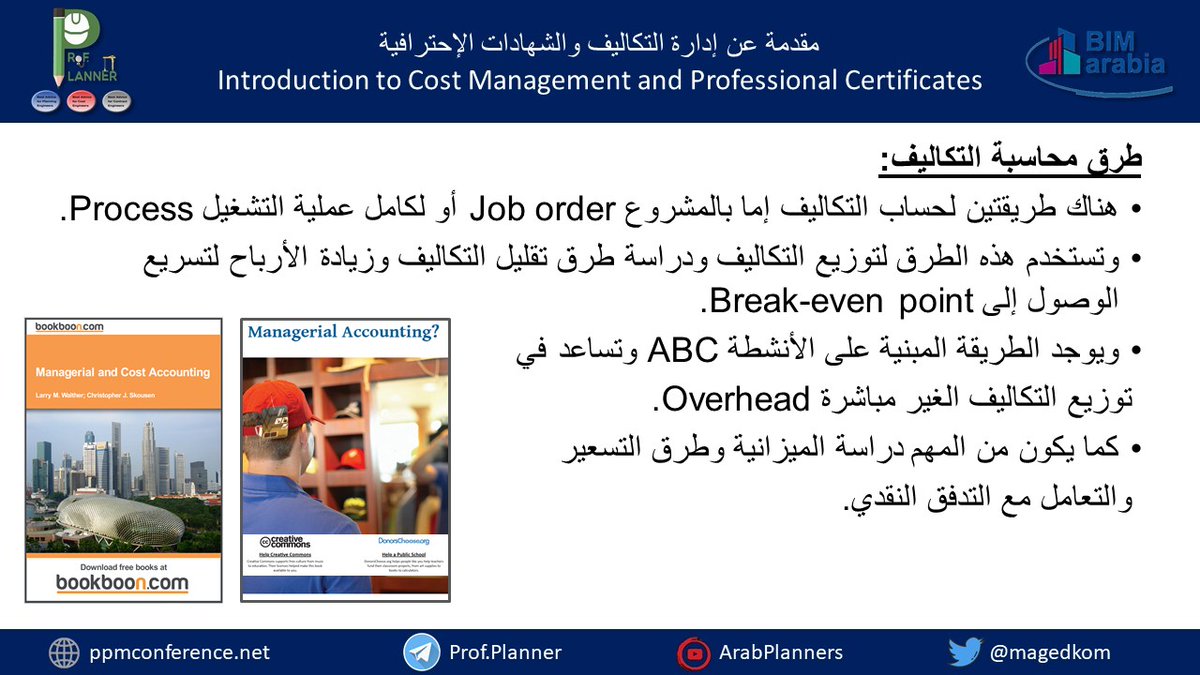
Cost Management (Measurement, Accounting & Control)
الحصر والمحاسبة والتحكم
EVM (English): luqmanacademy.com/course?cou…
The course in Arabic: luqmanacademy.com/course?cou…
#profplanner #costmanagement #earnedvalue #quantitysurveying #pmp #ccp #pmi #aacei #RICS #ciarb #RSmeans #accounting
2
8 Nov 2021
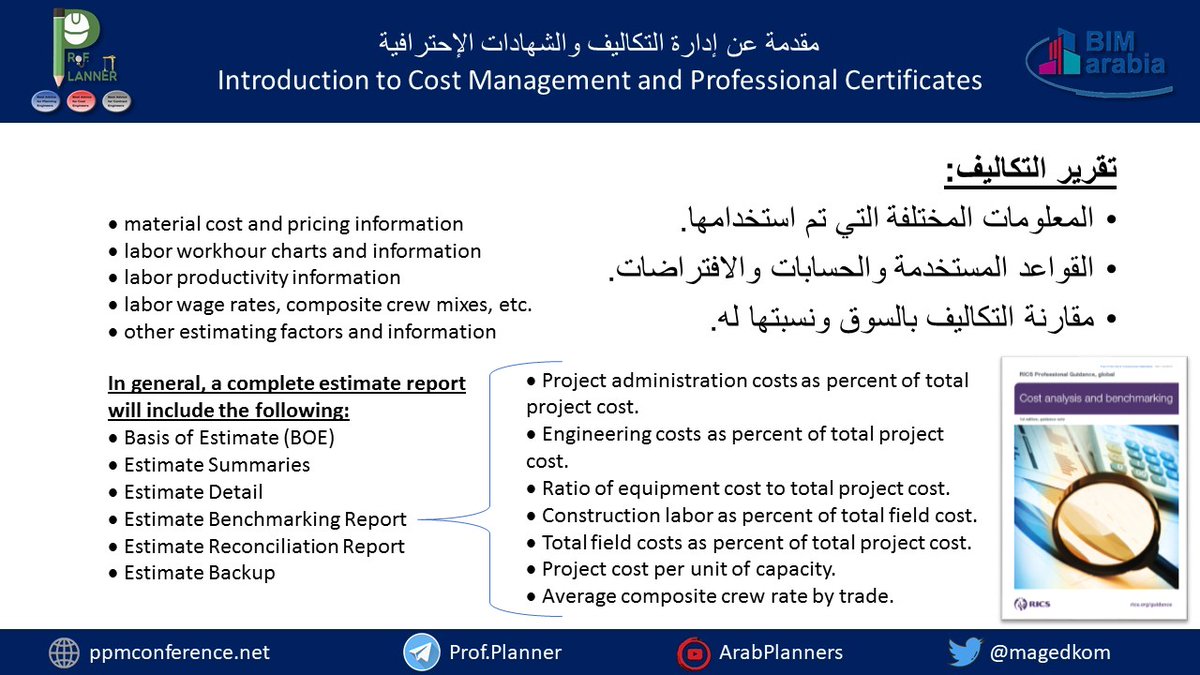
Cost Estimation Report
ما هي مكونات تقرير تقدير التكاليف؟
Project Control Using EVM (English): luqmanacademy.com/course?cou…
The course in Arabic: luqmanacademy.com/course?cou…
#profplanner #earnedvalue #quantitysurveying #CostEstimating #pmp #ccp #pmi #aacei #RICS #ciarb #RSmeans
1
7 Nov 2021
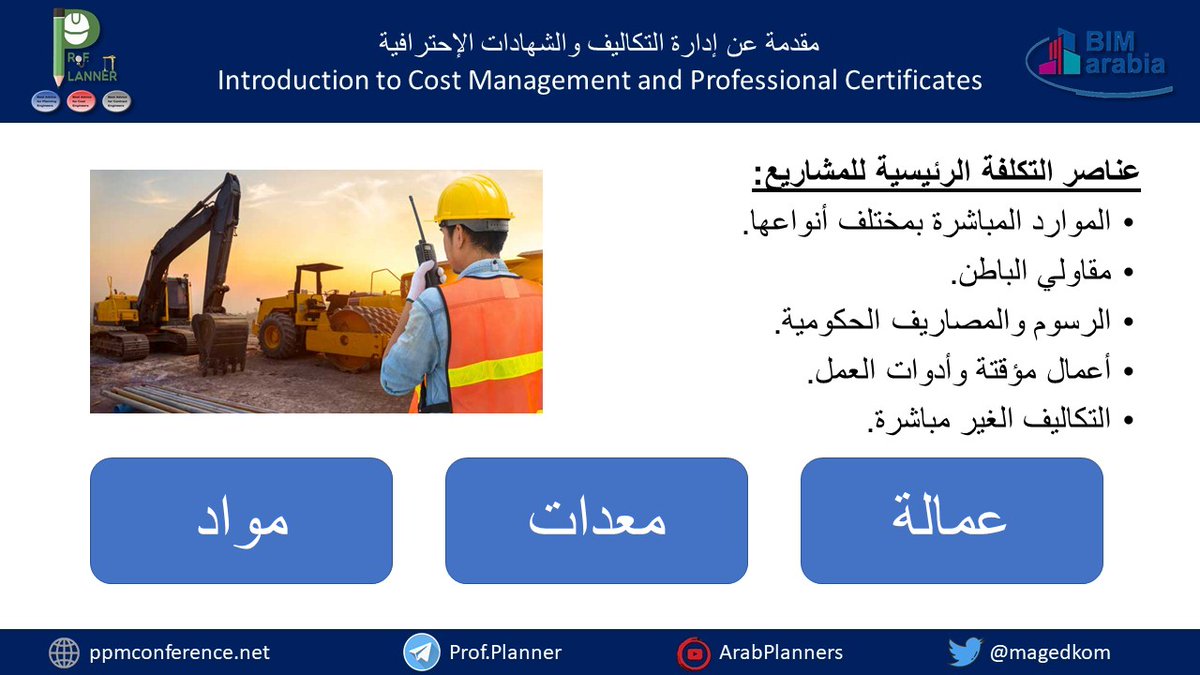
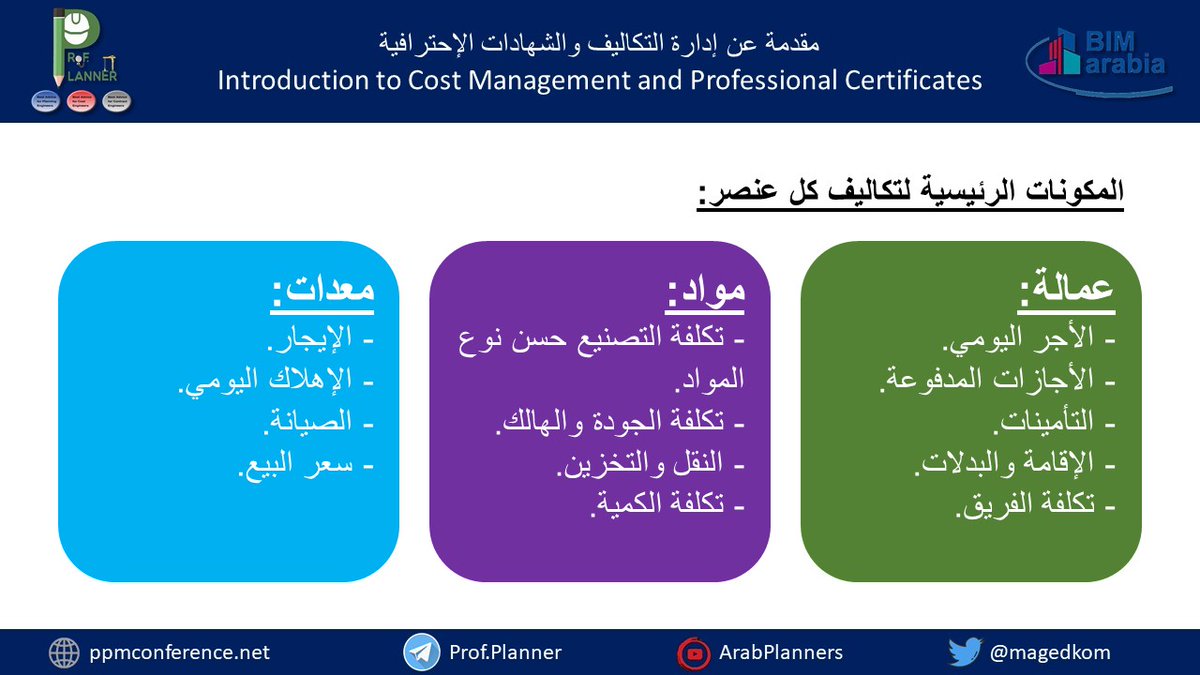
Cost Elements Breakdown
ما هي مكونات عناصر التكلفة الرئيسية؟
Project Control Using EVM (English):luqmanacademy.com/course?cou…
The course in Arabic:luqmanacademy.com/course?cou…
#profplanner #costmanagement #earnedvalue #quantitysurveying #CostEstimating #construction #pmp #ccp #pmi #aacei
1
5