
Jun 13
BI実践ラボ|アメリエフ技術ブログに新規記事を投稿しました。
「空間的遺伝子発現解析入門③」
staffblog.amelieff.jp/entry/…
空間的遺伝子発現解析のうち、イメージングベース (Imaging-based) の代表的なプラットフォーム (Xenium, CosMx) を解説します。
#enrichplot #GO解析 #可視化 #新規記事 #技術ブログ

1
8
706
May 11
BI実践ラボ|アメリエフ技術ブログに新規記事を投稿しました。
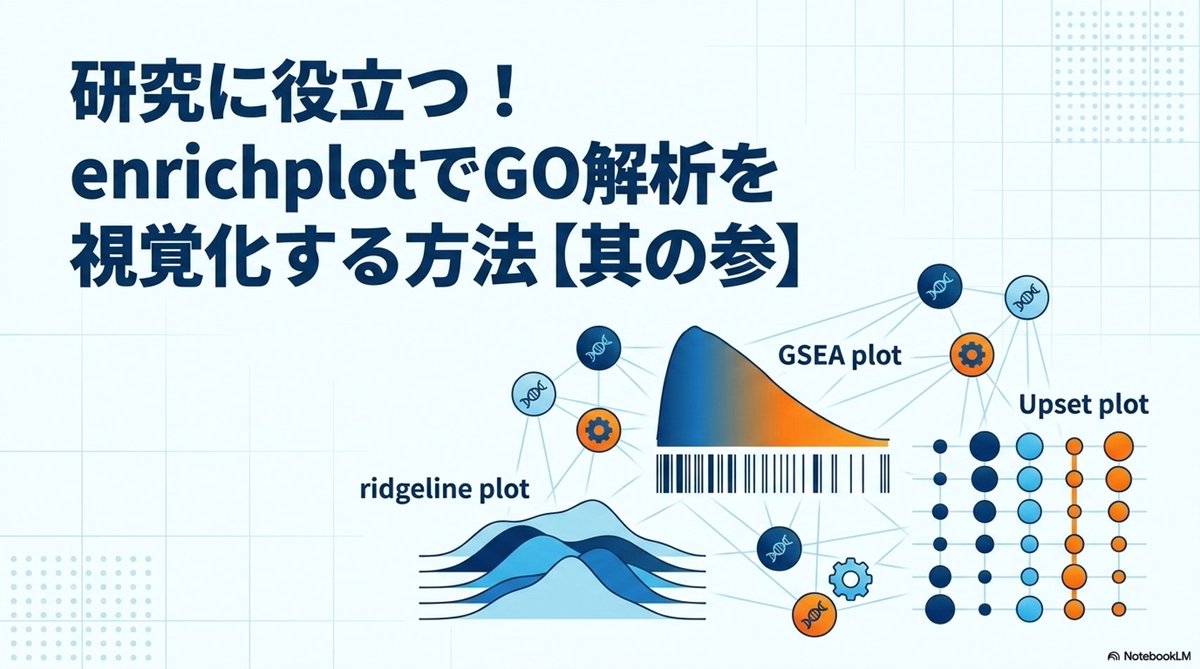
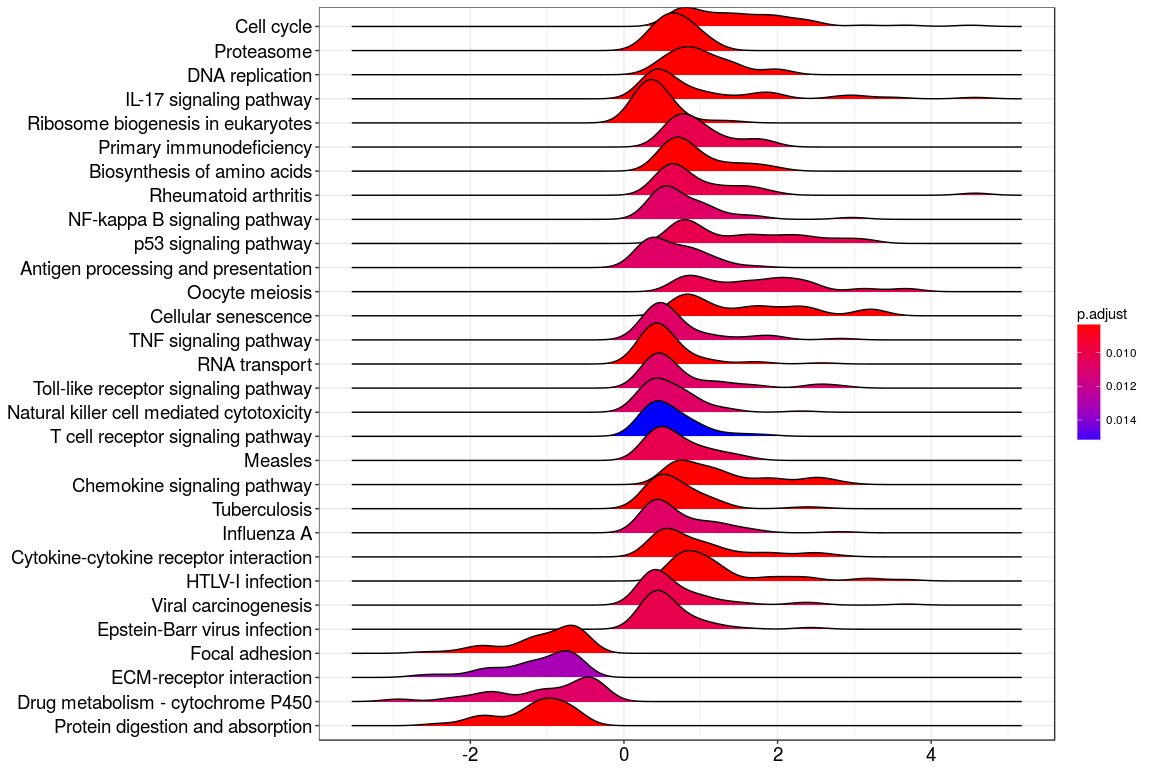
研究に役立つ!enrichplotでGO解析を視覚化する方法【其の参】
staffblog.amelieff.jp/entry/…
GO解析結果の可視化について実践的に解説します。
RNAseq由来の遺伝子セットに対するエンリッチメント解析を題材に、Upset plotやGSEA plotなど多様な図の作成方法を紹介。
必要なパッケージやエラー対応も丁寧に説明し、再現性を意識した内容となっています。
#enrichplot #GO解析 #可視化 #新規記事 #技術ブログ
3
201

RNA-seq解析などで、ターゲット遺伝子を絞り込むために使うエンリッチメント解析は、研究者が生物学的な意味を理解して、洞察を得るためにも可視化がとても重要。
アメリエフの技術ブログで可視化ソフト「enrichplot」の解説をしているので、ご参考までに。
Mar 19

BI実践ラボ|アメリエフ技術ブログに新規記事を投稿しました。
staffblog.amelieff.jp/entry/…
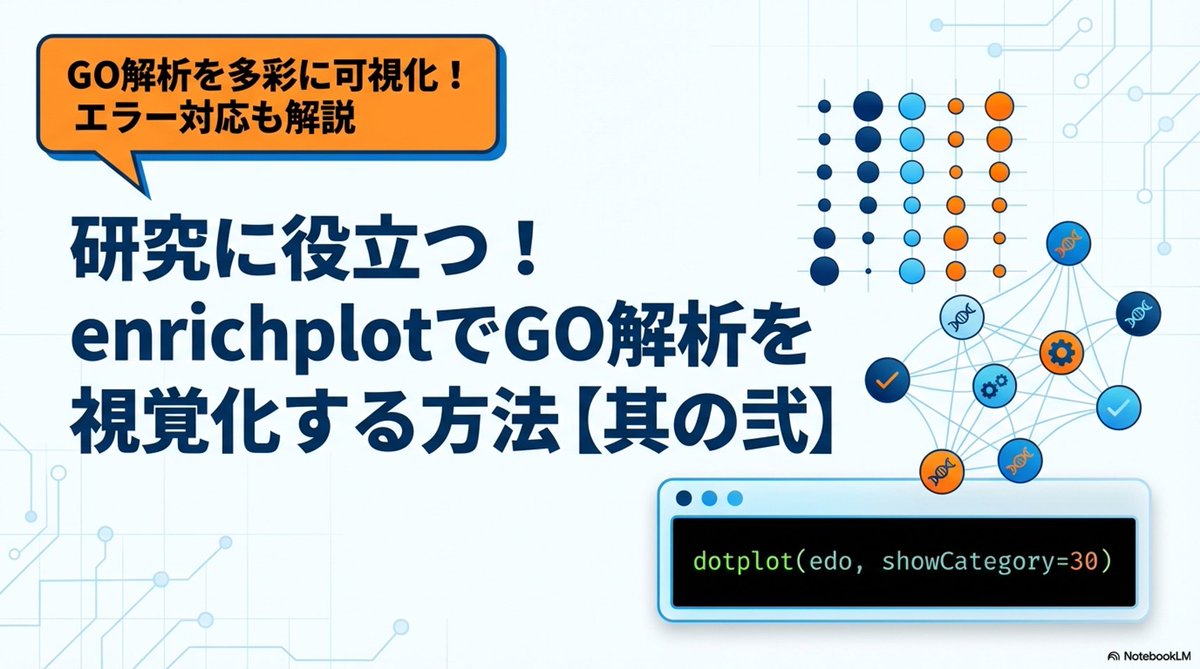
研究に役立つ!
enrichplotでGO解析を視覚化する方法
【其の弐】
enrichplotを用いて
RNAseq由来の遺伝子セットに対する
エンリッチメント解析を多彩な図で表現
エラー対応や再現性の工夫も交え
研究者が自分の環境で再現できるよう
丁寧に紹介いたします。
#enrichplot #GO解析 #可視化 #新規記事 #技術ブログ
1
11
107
12,162
Mar 19
BI実践ラボ|アメリエフ技術ブログに新規記事を投稿しました。
staffblog.amelieff.jp/entry/…
研究に役立つ!
enrichplotでGO解析を視覚化する方法
【其の弐】
enrichplotを用いて
RNAseq由来の遺伝子セットに対する
エンリッチメント解析を多彩な図で表現
エラー対応や再現性の工夫も交え
研究者が自分の環境で再現できるよう
丁寧に紹介いたします。
#enrichplot #GO解析 #可視化 #新規記事 #技術ブログ
3
36
13,451

16 Feb 2024
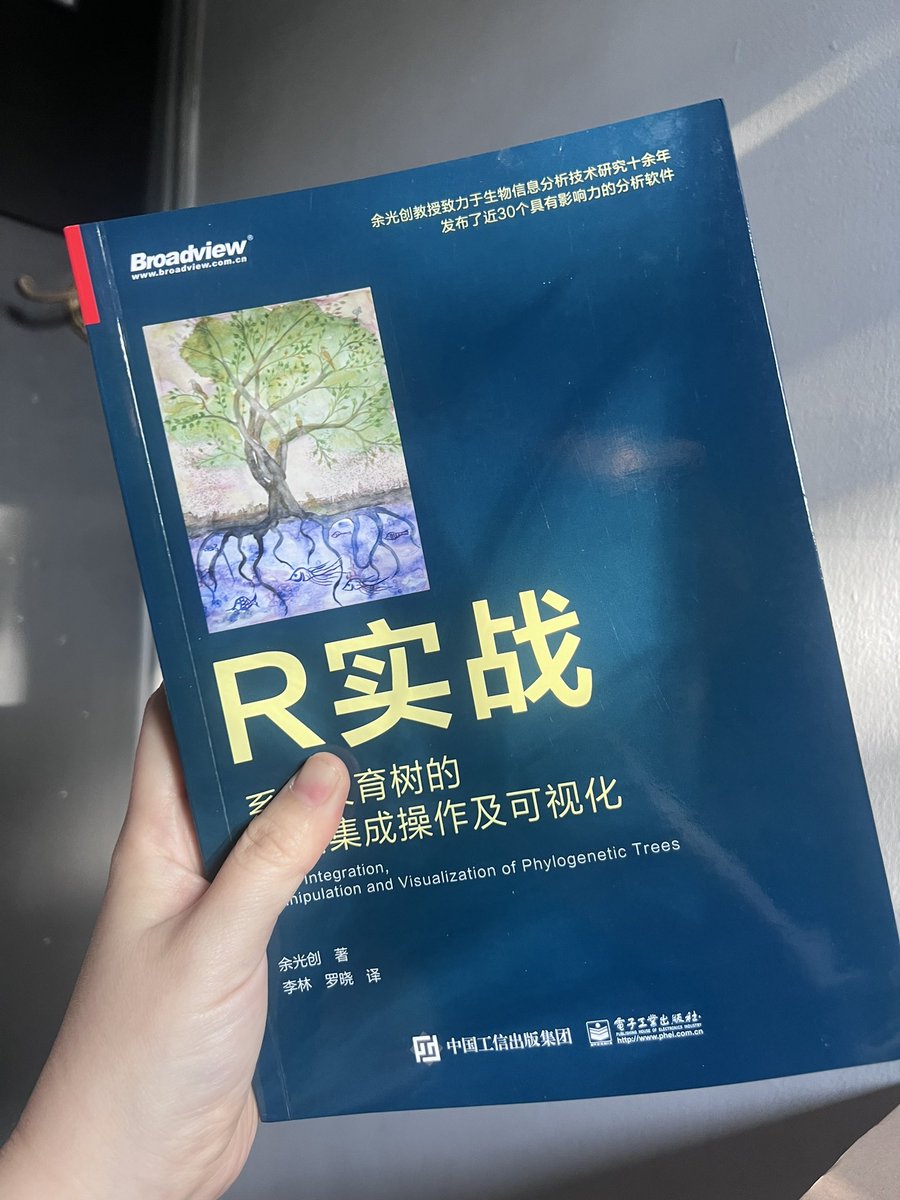
Having been a loyal fan of #R and packages of #DOSE, #clusterProfiler, #enrichplot,#ggplotify , and #ggtree. This book came to Cambridge 🇬🇧 today from @NaSai_Charlotte with @guangchuangyu’s signature!!Tq and definitely a huge motivator to keep me going as a #bioinformatician!🤩🤩

2
12
521

Guangchuang Yu's lab @guangchuangyu have written several great @Bioconductor packages including clusterprofiler and enrichplot...
Of course my fav from the Yu lab has to be emojifont
yulab-smu.top/biomedical-kno…
2
8
985

5 Jun 2023
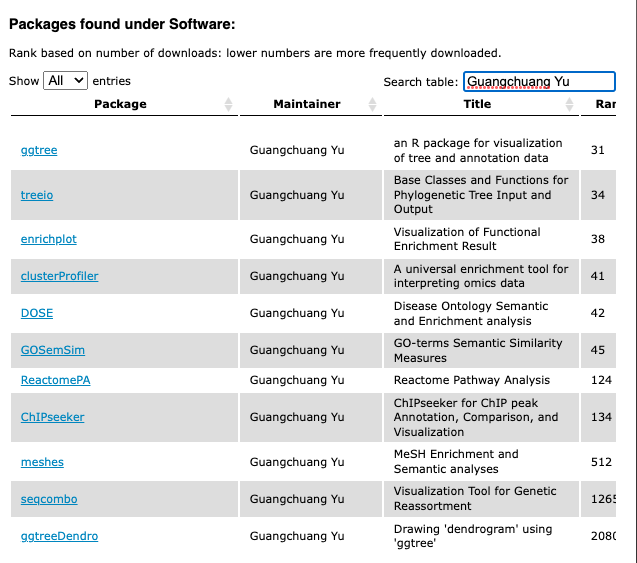
Dr. Yu @guangchuangyu from China contributed 5 (ClusterProfiler, enrichplot, ggtree, DOSE, GOSemSim)! Truly remarkable!
2
1
12
1,589

19 Aug 2022
Customizing graph parameters not explicitly listed as function arguments of enrichplot::treeplot() #tidyverse #rstats stackoverflow.com/questions/…
2
2

28 Jan 2020
emapplot (enrichplot) with compareCluster object does not work ift.tt/2u008Zj ift.tt/1Hph0G0 #clusterprofiler #rstats
1
2
20 Jan 2020
Visualization of Functional Enrichment Result with enrichplot: How to control label size? ift.tt/38ml1N1 ift.tt/1Hph0G0 #clusterprofiler #rstats
1
2
11 May 2019
Using the plotting functions of clusterProfiler / enrichplot with enrichment results from other programs bit.ly/2vT3jzs bit.ly/1Hph0G0 #clusterprofiler #rstats
1
2

2 May 2018
enrichplot: ggplot2-based visualization for functional enrichment from ORA/GSEA analysis bioconductor.org/packages/re…
1
1
14