
16 Feb 2024
Having been a loyal fan of #R and packages of #DOSE, #clusterProfiler, #enrichplot,#ggplotify , and #ggtree. This book came to Cambridge 🇬🇧 today from @NaSai_Charlotte with @guangchuangyu’s signature!!Tq and definitely a huge motivator to keep me going as a #bioinformatician!🤩🤩


2
12
521

17 Aug 2023
How to draw a grid of plots that combines Base R, ggplot2 & lattice. In 2 examples, the article compares the cowplot package vs. ggplotify & patchwork: youtu.be/27DZjCdbMaU
#DataScientist #DataVisualization #Rpackage #tidyverse #RStats #ggplot2 #RStudio
15
1,080
1 Mar 2023
How to draw a grid of plots that combines Base R, ggplot2 & lattice. In 2 examples, the article compares the cowplot package vs. ggplotify & patchwork: statisticsglobe.com/combine-…
#datavis #Rpackage #tidyverse #datascienceenthusiast #programming #RStats #RStudio #ggplot2
1
13
1,447
29 Dec 2022
How to draw a grid of plots that combines Base R, ggplot2 & lattice. In 2 examples, the article compares the cowplot package vs. ggplotify & patchwork: youtu.be/27DZjCdbMaU
#VisualAnalytics #RStats #statisticians #DataVisualization #RStudio
1
3
12
2,618
13 Jul 2022
How to draw a grid of plots that combines Base R, ggplot2 & lattice. In 2 examples, the article compares the cowplot package vs. ggplotify & patchwork: statisticsglobe.com/combine-…
#DataViz #datavis #ggplot2 #datasciencetraining #Rpackage #tidyverse #datascienceeducation #RStats
6
35

26 May 2022
Muchas visualizaciones del R-base son excelentes y fáciles de hacer✅sin embargo, no pueden combinarse con el trazado de ggplot❌
Con as.ggplot() de {ggplotify}📦podemos convertir plots a ggplots y combinarlos 🙌
1
11
49
24 Dec 2021
How to draw a grid of plots that combines Base R, ggplot2 & lattice. In 2 examples, the article compares the cowplot package vs. ggplotify & patchwork: statisticsglobe.com/combine-…
#tidyverse #rstudioglobal #Rpackage #RStats
1
3

3 Sep 2021
CRAN updates: dmlalg fasano.franceschini.test FastGaSP ggplotify quarks troopdata wdnr.gis #rstats
2
1
26 Aug 2021
How to draw a grid of plots that combines Base R, ggplot2 & lattice. In 2 examples, the article compares the cowplot package vs. ggplotify & patchwork: statisticsglobe.com/combine-…
#VisualAnalytics #datavis #Statistics #RStats #tidyverse #RStudio
1
4

22 Jul 2021
Oh wait, I think I found a solution. Just found out about ggplotify which is an amazing package name cran.r-project.org/web/packa…
1

18 Oct 2020
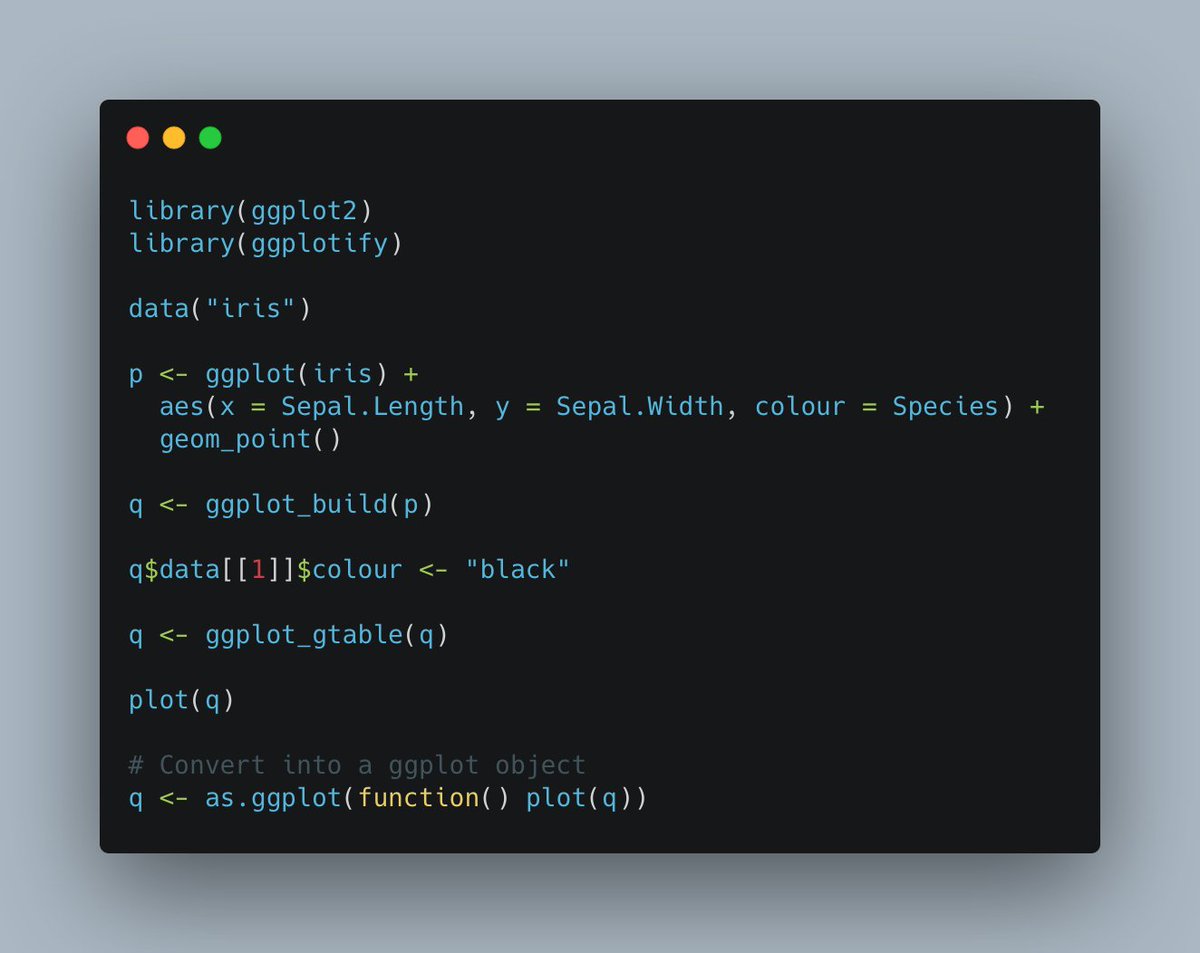
If you would like to convert this plot back into a ggplot object, you will need to use the as.ggplot() function in the {ggplotify} package.
Here's a demonstration
2

27 Jul 2020
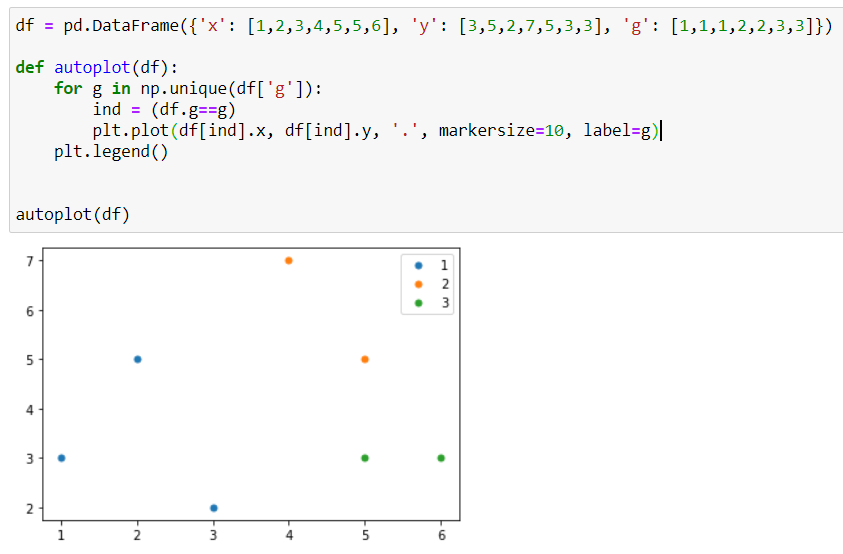
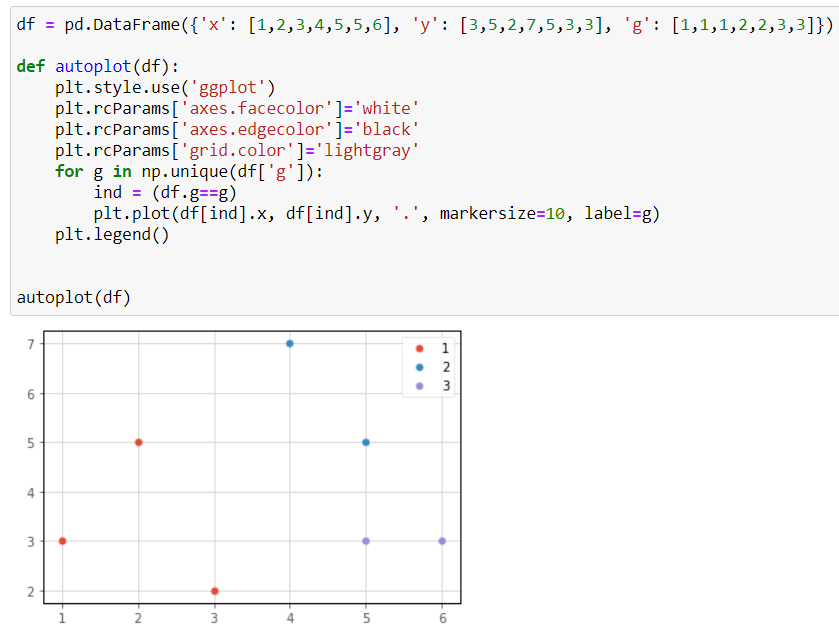
I think the easiest way is still to write your own wrapper. Then you can ggplotify it as much as you want.
Why this wrapper is not a one-liner? idk :) But yep, I end up re-writing it like a boilerplate code every time.
(Unless I misunderstood your question)
2

13 May 2020
yeah I remember I used that! Lots of packages are using #ggplotify , like #PCAtools by @KevinBlighe . Also - I just came across #cowplot wilkelab.org/cowplot/index.h… it offers different ggplot2 theme customization as well - looks interesting!!
3


30 Jan 2020
When working with grobs (as opposed to plot objects) I've had success with the grid and gridExtra packages. I know ggplotify also works, though I've never personally worked with it. The documentation has a specific example for plot-within-plot cran.r-project.org/web/packa…
2

15 Nov 2019
Just found ggplotify package by @guangchuangyu, which removes a gap between two plotting worlds in R (base and grid)! Check it if you want to arrange base plots, such as pheatmap with ggplot.
github.com/GuangchuangYu/ggp…
3
10

30 Oct 2019
library(ComplexHeatmap)
library(ggplotify)
library(cowplot)
library(patchwork)
dat = matrix(1:50,5,10)
h = Heatmap(dat)
grob_h = grid.grabExpr(draw(h))
grob_b = base2grob(~{
plot(1:10)
})
cowplot::plot_grid(grob_h,grob_b,ncol = 2)
patchwork::wrap_plots(list(grob_h,grob_b))
2
1
2

6 Sep 2019
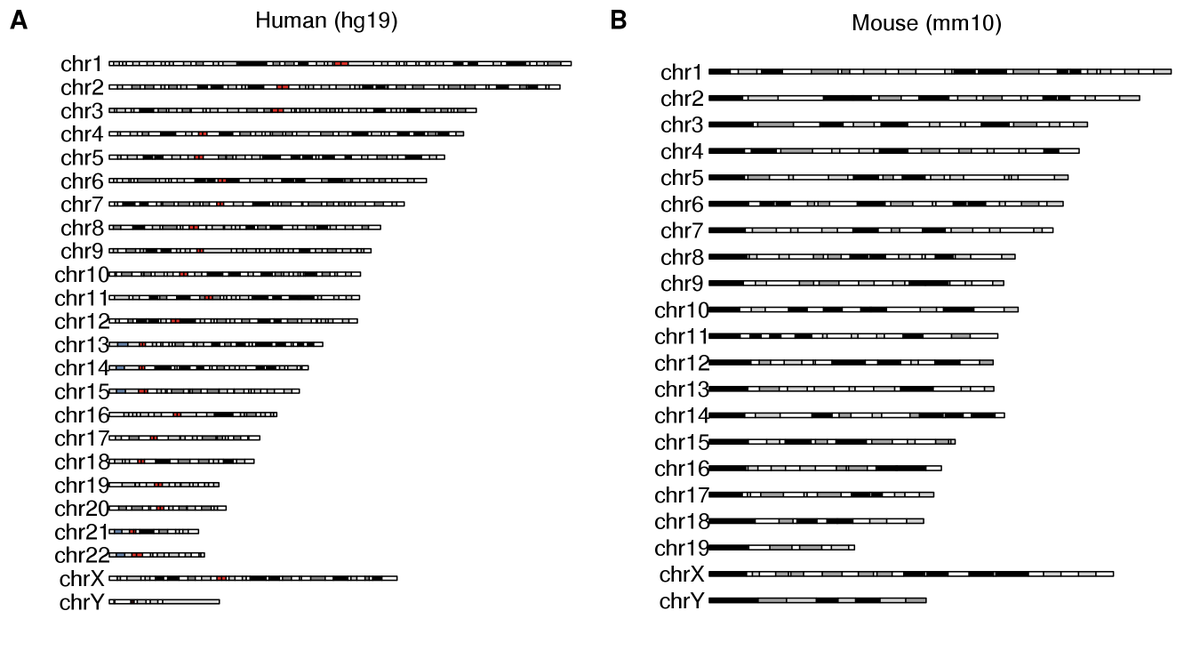
library(karyoploteR)
library(ggplotify)
library(cowplot)
p1 <- as.ggplot(expression(plotKaryotype(main="Human (hg19)")))
p2 <- as.ggplot(expression(plotKaryotype(genome = "mm10", main="Mouse (mm10)")))
plot_grid(p1, p2, ncol=2, labels=LETTERS)
#rstats
1
5
6 Sep 2019
Just found this nifty little package, ggplotify by @guangchuangyu (github.com/GuangchuangYu/ggp…) to convert R base plots to ggplot or grid objects. Makes it really easy to create multipanel figures with #karyoploteR!
#rstats #dataviz #genomics
1
9
17

30 Aug 2018
Answer: assign the baseR plot with function(){ plot(x) } and then ggplotify::as.ggplot(~plot1()) then arrange with cowplot! THANKs @mdsumner you're amazing
1
1