
Mar 19
Anthropic has introduced a new feature in Claude that allows users to see interactive diagrams and charts directly inside the chat.
Instead of only reading text, people can now view visuals like graphs, flowcharts, and heat maps that make information easier to understand.
These visuals appear instantly in the conversation, and users can move their cursor over them, click on different parts, and explore more details without opening any other software.
This makes it much simpler to understand complex ideas or large amounts of data, helping people such as data analysts quickly notice patterns, product managers test ideas for apps or websites, and creators explain their thoughts more clearly using visuals rather than long explanations.
Here's How Claude Generates These Visuals:👇
.
.
.
.
.
.
#ClaudeAI #MultimodalAI #AgenticAI #GenerativeVisuals #BuildingAIthatWorks #TechificialAI
1
2
5
131

Playing around with some unreleased ideas for simple camera automation, using the new shaders for a CRT-style effect. Going for nostalgia of some sort.
#anukari #synth #sounddesign #vst #electronicmusic #audioreactive #generativevisuals
1
9
576
Here's the latest (un-released) Anukari prototype running a generative audio preset with one of the new reactive audio shaders.
#anukari #synth #sounddesign #vst #electronicmusic #audioreactive #generativevisuals
1
7
337
Now that the 0.9.26 release is out, I'm back to prototyping features for the next release. First on my list is user-customizable audio-reactive shaders for Anukari's visuals. Here's a sampling of the presets so far. Don't forget, Anukari can run as an effect plugin, so all of these can be applied to any signal chain, not just Anukari as an instrument. Food for thought... :D
#anukari #synth #sounddesign #vst #electronicmusic #audioreactive #generativevisuals
7
243

Audio-Reactive Wireframe Geometry.
#audioreactivevisuals #touchdesigner #tdpops #gridbasedgeometry #proximitydriven #wireframecubes #generativevisuals #realtimegraphics #sounddrivenmotion #abstractgeometry
1
144

13 Oct 2025
📢 We continued our collaboration with #DeLaurentis, this time on the main stage of @gaitelyrique for a live show 360
A beautiful show that ended with our collaborative music interactive #generativevisuals project ‘#Sinvocea’ designed by our researcher #AlexisAndre @MacTuitui
5
8
626

4 Jun 2025
Full Video on YouTube @grasspatchbum - youtu.be/iuhGMIP5xvQ
#ai #musicvideo #musician #airforce #psytech #psytechno #aimusic #GenerativeVisuals #fyp #viral #tiktokmusic #aivideo #aiart #newmusic #electronicmusic #glitchart #futuremusic #visualizer #trending #foryoupage
1
5
83

7 May 2025
The dream speaks in patterns 🔮, not words. Geometry hums 🧿, color sings 🌈, and rhythm opens doors 🚪 to forgotten thoughts. Watch it once. Then again. And again. 🌀 @comfyui @edenartlab #aiart #patternmagic #fluxvideo #comfyui #edenartlab #generativevisuals #motionpo
2
51

AI Reveals Humanity’s Dark Dystopian Future – A Million Years From Now youtu.be/zr9RrH4grI4?si=TTzY… via @YouTube
#AIart #aivideo #generativevisuals #scifi #scifiart #dystopian #farfuture #sciencefiction #midjourney #runwayml #hailuoai #kling_ai #lumalabs #ray2
3
235


1 Mar 2025
cellular automata based on the sine function and the adjacent neighbors
#cellularautomata #cellularautomataart
#p5js #p5jsart
#creativecoding
#creativecodeart #processing #p5jsart
#javascript
#generativevisuals #multimedia #nft
#nftart
#gaudiramone
#apocalysisphotographers
4
72
26 Feb 2025
Infinite Spiral
Source Code:
openprocessing.org/user/4253…
#p5js #p5jsart
#creativecoding
#creativecodeart #processing #p5jsart
#javascript
#noise #electronicmusic
#generativevisuals #multimedia #nft
#nftart #generativeart
#gaudiramone
#apocalysisphotographers
1
6
93

22 Oct 2023
Testing of generative audio and generative image.
#generative #ambient #experimentl #sounddesign #generativevisuals #modularsynth
2
10
1,182

3 Sep 2023
Spent my sunday morning playing with AnimateDiff and all I can say for now is that, yes! comfyUI can animate.
#stablediffusion #comfyui #AnimateDiff #aianimation #aiartcommunity #AIArtworks #generativeai #generativevisuals
6
3
24
1,825

9 Feb 2023
Get on a visual journey with L4wlo and VS - Visual Synthesizer! Double trouble for shining visuals and long sets 🎧.
buff.ly/3DRwNRC
#vs #visualsynthesizer #visuals #livevisuals #reactivevisuals #generativevisuals #generativeart #shaders #visualshaders #vj #visualizer
1
4
250
21 Nov 2022
Make the visualizations of your dreams come to life with VS! Give color and movement to your music with VS - Visual Synthesizer ✨
buff.ly/3TT8LuQ
#vs #visualsynthesizer #visuals #minimalism #minimalismmusic #reactivevisuals #generativevisuals #imaginando

2

18 Nov 2022
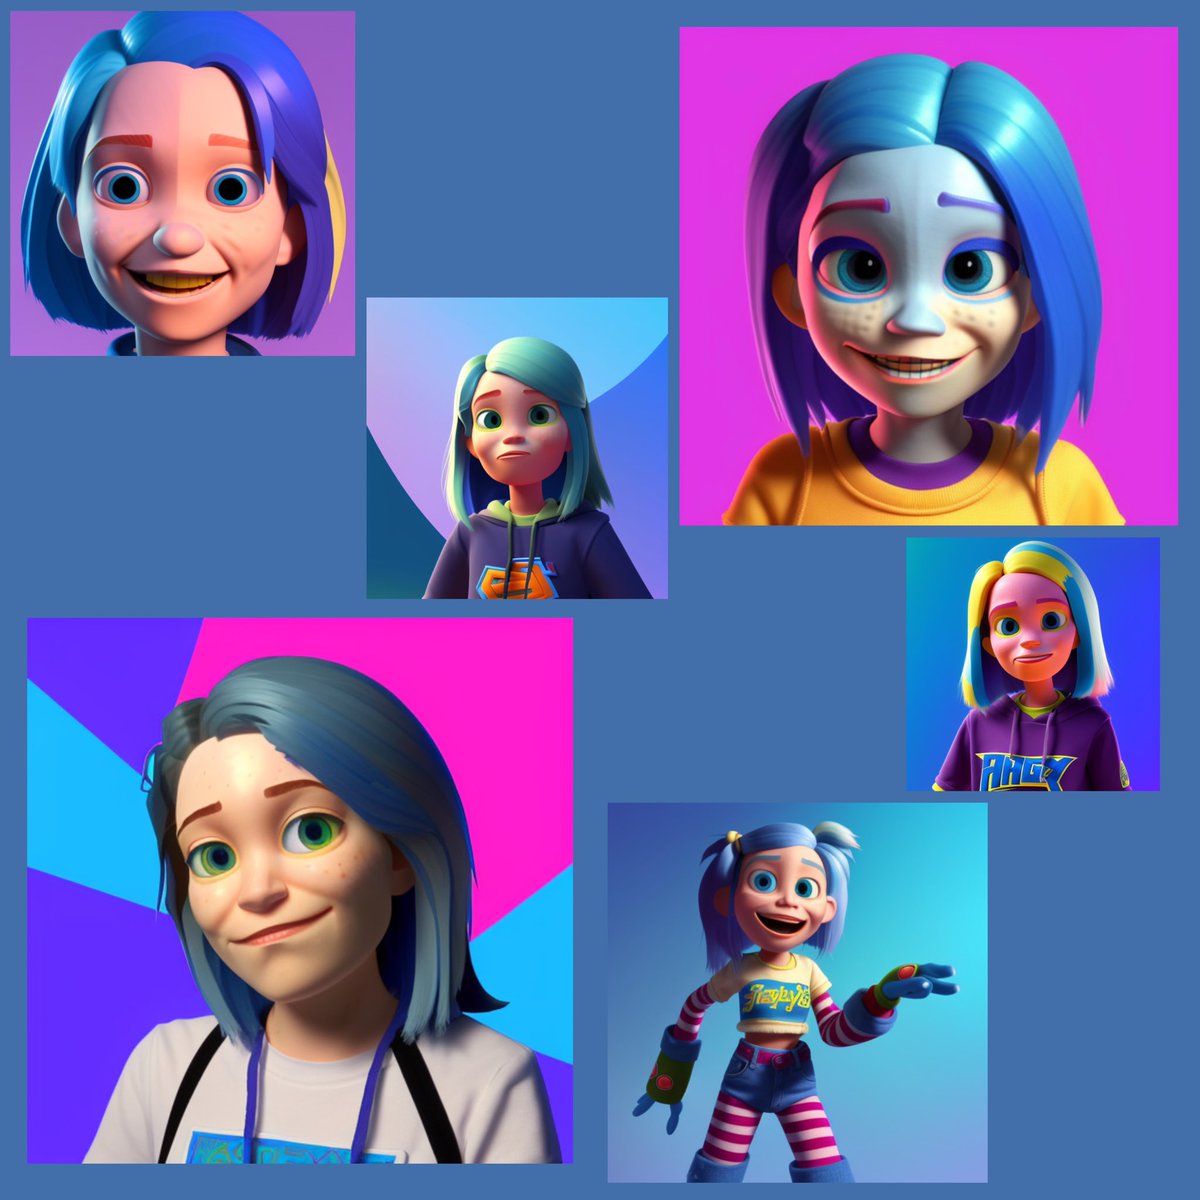
this DreamBooth thing is 🤯
#Dreambooth #stablediffusion #ai #generativeart #aiart #digitalart #visualart #neuralart
#neuralvisual #generativevisuals


3
13 Nov 2022
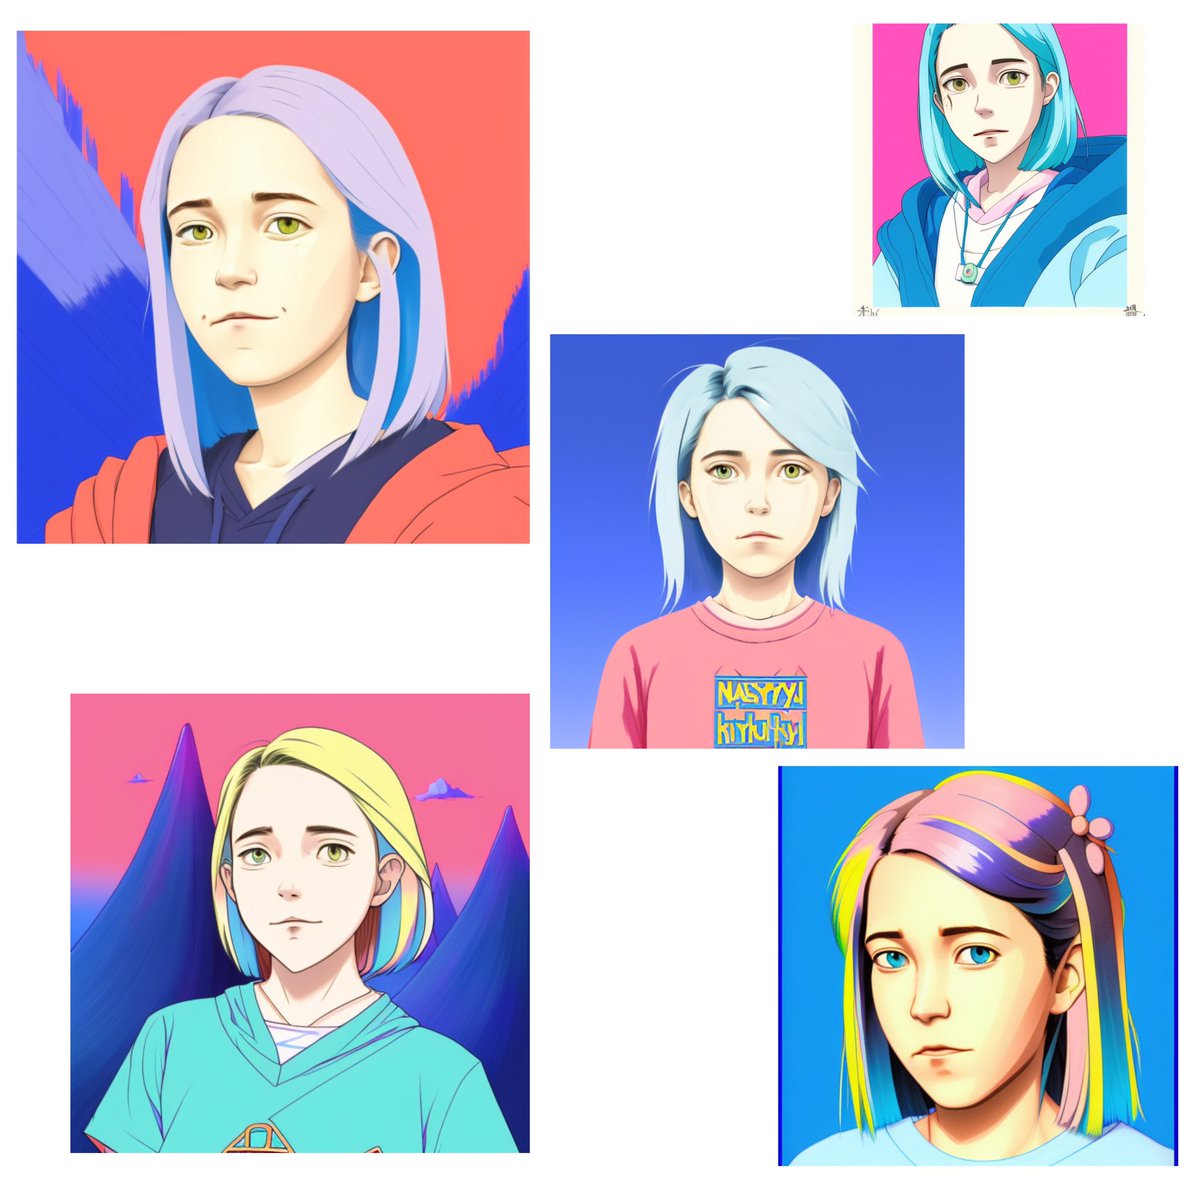
random portrait✨
#stablediffusion #ai #generativeart #aiart #digitalart #visualart #neuralart #neuralvisual #generativevisuals
2
3
9 Nov 2022
It’s time to Disco Diffusion 🪩
#discodiffusion #ai #generativeart #aiart #digitalart #visualart #neuralart #neuralvisual #generativevisuals
1
7
8 Nov 2022
My personal headliner and most beloved work🪄
glory to AI🤤
@SpinArtist #SalvatoreGanacci #EDM
#stablediffusion #ai #generativeart #aiart #digitalart #visualart #neuralart #neuralvisual #generativevisuals
2
7