
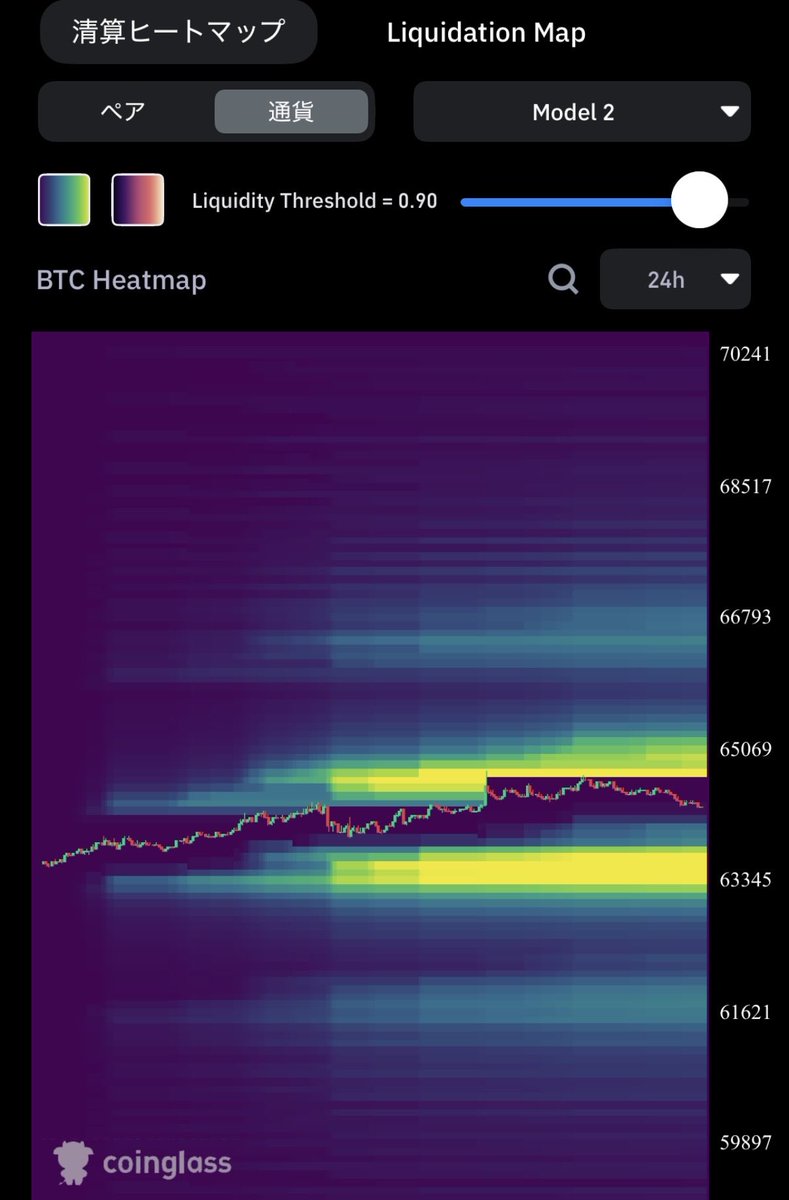
📊 BTC 週間清算ヒートマップ分析
現在価格は 64,000ドル台後半。
ヒートマップを見ると、価格は強い流動性帯を順番に回収しながら上昇しているように見えます👀
✅ 上側の大きな流動性
・64,700~65,500ドル付近
・65,900~67,000ドル付近
このエリアには未回収の流動性が残っており、短期的には上方向を試しやすい構造です。
✅ 下側のサポート
・63,000~63,500ドル
・62,000ドル前後
押し目が入っても、この付近は買い支え候補として注目。
💡個人的には
「上の流動性を回収してから方向感を決める展開」
を意識しています。
流動性は価格を引き寄せる磁石のようなもの。
まずは65,000ドル突破なるかに注目です🚀
#BTC #Bitcoin #仮想通貨 #Crypto #ビットコイン #清算ヒートマップ #LiquidationMap #BTC分析 #CryptoTrading


97
🚨 BTC Liquidation Heatmap Analysis
Current price is hovering around $64.3K, right between major liquidity zones.
🟢 Key Support:
• $63.3K–$63.8K holds a large liquidity cluster
• Strong buying interest may emerge if tested
🔵 Secondary Support:
• $61.2K–$61.8K contains another significant liquidity pool
• A breakdown below $63K could accelerate moves toward this area
🔴 Major Resistance:
• Heavy liquidation liquidity sits around $66.8K–$68.5K
• A breakout above $65.5K could trigger a short squeeze and fuel further upside
📊 What I’m Watching:
✅ Support at $63K
✅ Liquidity buildup above current price
✅ Potential short-squeeze setup toward $67K
The market often moves where liquidity is concentrated.
Right now, BTC is sitting at a key decision point. 👀
#Bitcoin #BTC #Crypto #Trading #LiquidationMap #CryptoTrading #BitcoinAnalysis #CryptoMarket
78
#BTC #ビットコイン
Liquidation Mapを見ると、現在価格は 64.5K付近。
注目ポイントは、すぐ上の 65K〜65.2Kゾーンに大きなショート流動性が集中 していること👀
価格は流動性を求める傾向があるため、
📈 65K突破
↓
📈 ショート清算
↓
📈 踏み上げ加速
というシナリオは十分考えられそうです。
一方で、直下の大きな流動性は既にかなり回収されており、短期的には上側を試しに行く方が自然な構造に見えます。
ただし65K付近は大口の利確も入りやすいポイント。
突破できるか、それとも一度振り落としが入るかに注目です。
🎯注目価格帯
・65.0K〜65.2K → 次のターゲット
・66.3K付近 → その上の流動性
・64.0K割れ → 短期弱気転換
流動性マップ的には、まだ上を狙う余地が残っている印象です🚀
#Bitcoin #BTC #Crypto #仮想通貨 #BTC分析 #LiquidationMap


1
2
195

16h
$VVV – Liquidation Map (7D) – Index ~16.91
📍 Price is currently around 16.91, sitting in a fairly thin liquidity zone between the long-liq cluster below and the short-liq cluster above. This is a sensitive area, where fast movement may appear if price breaks out of the current balance range.
🟢 Above the current level, short-liq starts to appear from 17.19–17.46, then becomes denser around 17.67–18.15 and stands out near 18.30–18.60. If price breaks above 17.19 and holds momentum, a short-liquidation sweep could gradually push the asset toward higher zones.
🔴 Below, long-liq is clearer around 16.77–16.17, followed by 16.02–15.57. If price loses the current buffer area, long liquidations could accelerate the downside move into the liquidity clusters below.
⚖️ The preferred scenario is to wait for confirmation around 16.77–17.19. A stable breakout higher could open the path toward 17.46–17.67, then 18.15–18.60. On the other hand, losing 16.77 would increase the risk of a pullback toward 16.53–16.17.
🛡️ Liquidity above is denser with larger clusters farther away, while the area near the current price remains quite thin. Chasing sharp candles may carry higher risk, so it is safer to wait for a clear reaction near 17.19 above or 16.77 below, with a tight stop-loss to reduce liquidity noise.
#LiquidationMap

1
140
19h
$ICP – Liquidation Map (7D) – Index ~2.51
📍 Price is currently around 2.51, sitting in a relatively thin liquidity zone after the long-liq cluster below has sharply declined. This is a sensitive area, where fast movement may appear if price breaks out of the current balance state.
🟢 Above the current level, short-liq starts to become clearer around 2.52–2.56, then extends toward 2.59–2.63. Further above, liquidity is relatively thin around 2.65–2.78. If price breaks above 2.52 and holds momentum, a short-liquidation sweep could gradually push the asset toward higher zones.
🔴 Below, long-liq is heavily concentrated around 2.49–2.46, followed by 2.41–2.33. The largest cluster sits deeper near 2.21–2.19, so losing the current buffer area could allow long liquidations to accelerate the downside move.
⚖️ The preferred scenario is to wait for confirmation around 2.49–2.52. A stable breakout higher could open the path toward 2.54–2.56, then 2.59–2.63. On the other hand, losing 2.49 would increase the risk of a pullback toward 2.46–2.41.
🛡️ Liquidity near the current price is quite thin, while several notable long-liq clusters remain below. Chasing sharp candles may carry higher risk, so it is safer to wait for a clear reaction near 2.52 above or 2.49 below, with a tight stop-loss to reduce liquidity noise.
#LiquidationMap

1
122
20h
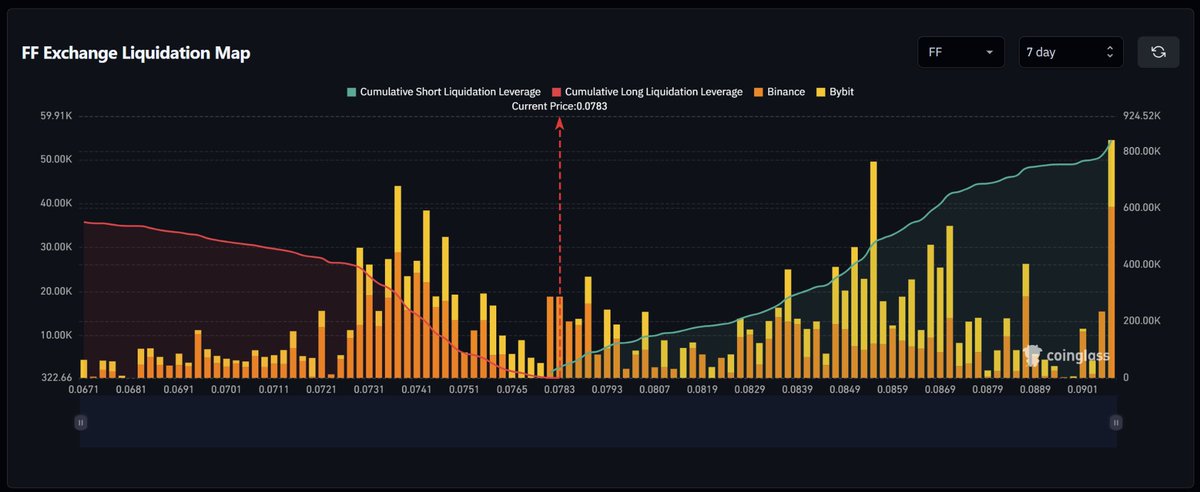
$FF – Liquidation Map (7D) – Index ~0.0783
📍 Price is currently around 0.0783, sitting in a relatively thin liquidity zone after the long-liq cluster below has sharply declined. This is a sensitive area, where fast movement may appear if price breaks out of the current balance range.
🟢 Above the current level, short-liq starts to become clearer around 0.0793–0.0807, then gets denser near 0.0839–0.0869 and extends strongly toward 0.0889–0.0901. If price breaks above 0.0793 and holds momentum, a short-liquidation sweep could gradually push the asset toward higher zones.
🔴 Below, long-liq is concentrated around 0.0765–0.0751, followed by 0.0741–0.0731. If price loses the current buffer area, long liquidations could accelerate the downside move into lower liquidity clusters.
⚖️ The preferred scenario is to wait for confirmation around 0.0765–0.0793. A stable breakout higher could open the path toward 0.0807–0.0839, then 0.0849–0.0869. On the other hand, losing 0.0765 would increase the risk of a pullback toward 0.0751–0.0731.
🛡️ Liquidity above is denser with a larger cluster farther away, while the area near the current price remains thin. Chasing sharp candles may carry higher risk, so it is safer to wait for a clear reaction near 0.0793 above or 0.0765 below, with a tight stop-loss to reduce liquidity noise.
#LiquidationMap
40

Jun 13
Le balene hanno alzato la linea di trincea! 🐋
Nelle ultime ore la mappa termica di Bitcoin ha subito un cambiamento strategico fondamentale: l'enorme muro di supporto istituzionale è stato spostato verso l'alto, cementando l'area tra $62.800 e $63.000 come nuovo pavimento granitico del fine settimana.
Con il prezzo stabile a quota $63.500, ci troviamo pienamente dentro l'area di chiusura ottimale. Sotto i piedi abbiamo uno scudo freschissimo, mentre sopra si è accumulata una prateria densissima di liquidazioni Short tra i $64.200 e i $65.200.
Il Dollaro Index resta debole sotto i 100 punti e non ha la forza di spingere. La via della minore resistenza in questo momento è una sola. La caccia agli Short in alto è aperta. 📈🎯
#Bitcoin #BTC #CryptoMarket #Coinglass #LiquidationMap #BitcoinTrading #MacroAnalysis #CryptoWhales #Bullish

58
Jun 13
$ALLO – Liquidation Map (7D) – Index ~0.3931
📍 Price is currently around 0.3931, sitting in a very thin liquidity zone after the long-liq cluster below has sharply declined. This suggests the market is in a sensitive area, where fast movement may appear if new momentum enters.
🟢 Above the current level, short-liq starts to appear around 0.4011–0.4147, but the more notable clusters sit near 0.4515–0.4571 and further around 0.4795–0.4923. If price breaks above 0.4011 and holds momentum, a short-liquidation sweep could gradually push the asset toward higher zones.
🔴 Below, long-liq is clearer around 0.3835–0.3779, then becomes much denser near 0.3723–0.3611. If price loses the current area, long liquidations could accelerate the downside move into the liquidity clusters below.
⚖️ The preferred scenario is to wait for confirmation around 0.3899–0.4011. A stable breakout higher could open the path toward 0.4083–0.4147, then 0.4515–0.4571. On the other hand, losing 0.3899 would increase the risk of a pullback toward 0.3835–0.3779.
🛡️ Liquidity near the current price is quite thin, while the larger clusters are still farther away. Chasing sharp candles may carry higher risk, so it is safer to wait for a clear reaction near 0.4011 above or 0.3899 below, with a tight stop-loss to reduce liquidity noise.
#LiquidationMap

232
Jun 13
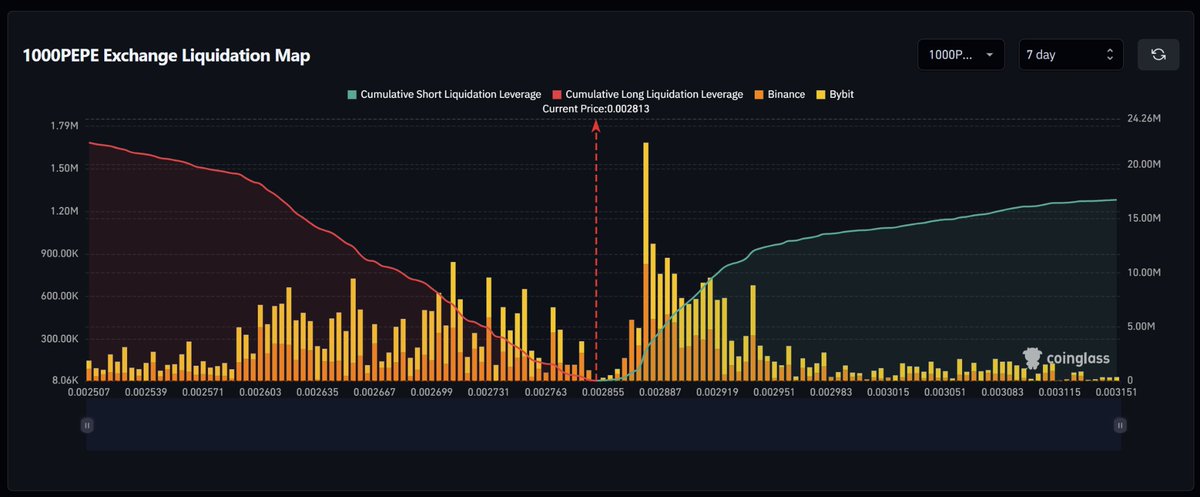
$PEPE – Liquidation Map (7D) – Index ~0.002813
📍 Price is currently around 0.002813, sitting in a relatively thin liquidity zone between the long-liq cluster below and the short-liq cluster above. This suggests the market could move quickly if price breaks out of the current balance area.
🟢 Above the current level, short-liq becomes clearly denser around 0.002855–0.002887, then extends toward 0.002919–0.002951. If price breaks above 0.002855 and holds momentum, a short-liquidation sweep could push the asset quickly toward these zones.
🔴 Below, long-liq is concentrated around 0.002763–0.002731, followed by 0.002699–0.002667. If price loses the nearby buffer area, long liquidations could accelerate the downside move into lower liquidity clusters.
⚖️ The preferred scenario is to wait for confirmation around 0.002763–0.002855. A stable breakout higher could open the path toward 0.002887–0.002919, then 0.002951. On the other hand, losing 0.002763 would increase the risk of a pullback toward 0.002731–0.002699.
🛡️ Liquidity around the current price is relatively thin, while the upside liquidation cluster is closer and denser. Chasing sharp candles may carry higher risk, so it is safer to wait for a clear reaction near 0.002855 above or 0.002763 below, with a tight stop-loss.
#LiquidationMap
5
79
Jun 13
$CRCL – Liquidation Map (7D) – Index ~78.7
📍 Price is currently around 78.7, sitting near a relatively thin liquidity zone after a large long-liq cluster below. This suggests the market could move quickly if price breaks out of the current balance area.
🟢 Above the current level, short-liq starts to appear around 81.4–83.6, while denser clusters sit near 84.8–86.6 and 87.2–88.4. If price breaks above 81.4 and holds momentum, a short-liquidation sweep could push the asset toward higher zones.
🔴 Below, long-liq is heavily concentrated around 77.6–77.0, then extends toward 76.4–75.2 and 74.6–74.0. If price loses the current buffer area, long liquidations could drive a pullback into the dense liquidity clusters below.
⚖️ The preferred scenario is to wait for confirmation around 77.6–81.4. A stable breakout higher could open the path toward 83.6–84.8, then 86.6–88.4. On the other hand, losing 77.6 would increase the risk of a sweep toward 77.0–75.2.
🛡️ The liquidity gap around the current price is fairly wide, so chasing sharp candles may carry higher risk. A safer approach is to wait for reaction near 81.4 above or 77.6 below, while keeping a clear stop-loss to reduce liquidity noise.
#LiquidationMap

258
Jun 13
$INJ – Liquidation Map (7D) – Index ~5.10
📍 Price is currently around 5.10, sitting in a relatively thin liquidity zone between the long-liq cluster below and the short-liq cluster above. This area may trigger fast movement if the market gets enough momentum to break out of the short-term balance range.
🟢 Above the current level, short-liq clusters become clearer around 5.20–5.24, then extend toward 5.32–5.52. If price breaks above 5.16 and holds momentum, a short-liquidation sweep could push the asset toward these zones.
🔴 Below, long-liq is concentrated around 5.04–5.00, followed by 4.88–4.84. If price loses nearby support, long liquidations could accelerate the downside move toward lower levels.
⚖️ The preferred scenario is to wait for confirmation around 5.04–5.16. A stable breakout higher could open the path toward 5.20–5.24, then 5.48–5.52. On the other hand, losing 5.04 would increase the risk of a pullback toward 5.00 and deeper into 4.88.
🛡️ The liquidation cluster above is denser than the area near the current price, but the liquidity gap is still quite wide. Chasing sharp candles may carry higher risk, so it is safer to wait for a clear reaction near 5.16 above or 5.04 below, with a tight stop-loss.
#LiquidationMap

1
58
Jun 12
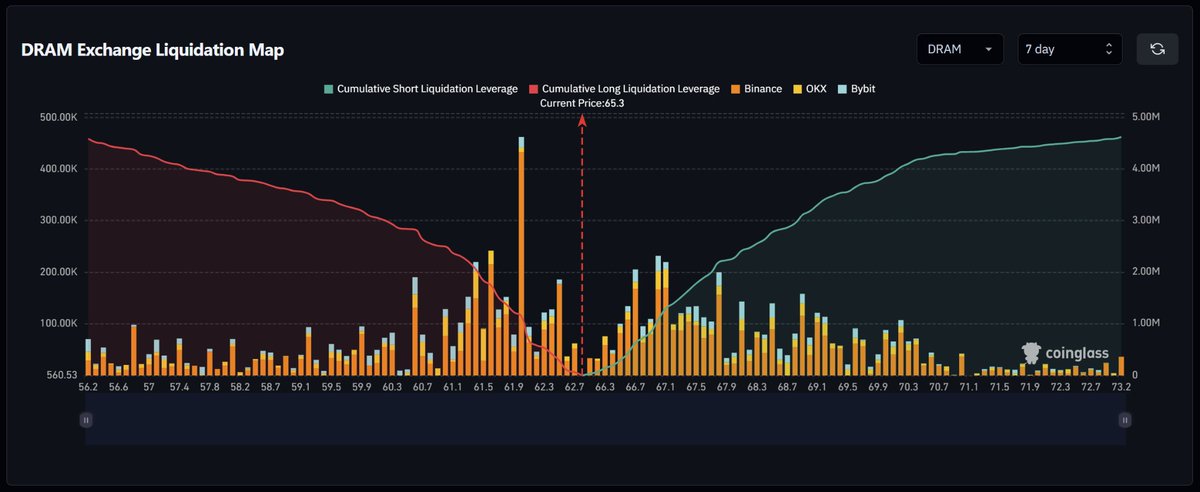
$DRAM – Liquidation Map (7D) – Index ~65.3
📍 Price is currently around 65.3, sitting in a relatively thin liquidity zone between two larger liquidation clusters. This suggests the market could move quickly if price breaks out of the current short-term balance area.
🟢 Above the current level, short-liq clusters start to become clearer around 66.7–67.9, then extend toward 68.3–69.1. If price breaks above 66.3 and holds momentum, a short-liquidation sweep could push the asset toward these zones.
🔴 Below, long-liq is heavily concentrated around 62.7–61.9, with 61.9 standing out as the strongest cluster on the map. If price loses the current buffer area and slips below 62.7, long liquidations could accelerate the move toward 61.5–60.7.
⚖️ The preferred scenario is to wait for confirmation around 62.7–66.3. A stable breakout higher could open the path toward 66.7–67.9, then 69.1. On the other hand, losing 62.7 would increase the risk of a sweep into the major long-liq cluster near 61.9.
🛡️ Liquidity around the current price is not very dense, so chasing sharp candles may carry higher risk. A safer approach is to wait for reaction near 66.3 above or 62.7 below, while keeping a clear stop-loss to reduce liquidity-sweep risk.
#LiquidationMap
1
89
Jun 12
$GOOGL – Liquidation Map (7D) – Index ~360.5
📍 Price is currently around 360.5, sitting near a relatively thin liquidation zone. This suggests short-term volatility could expand quickly if the market breaks out of the current balance area.
🟢 Above the current level, short-liq clusters start to build around 373.7–381.2, with a stronger concentration near 383.7–386.2. If price clears 367.7 and holds momentum, a short-liquidation sweep could push the asset toward these levels.
🔴 Below, long-liq is more visible around 346.7–344.2, followed by 338.7–337.6. These are key downside zones to monitor if price loses nearby support, as long liquidations may accelerate the decline.
⚖️ The preferred scenario is to wait for confirmation outside the 360–367 range. A stable breakout higher could open the path toward 373.7–381.2, then 386.2. On the other hand, losing 360 and slipping below 346.7 would increase the risk of a sweep toward 344.2–337.6.
🛡️ Liquidity around the current price is relatively thin, so chasing sharp candles is risky. A safer approach is to wait for reaction around 367.7 above or 346.7 below, while keeping a clear stop-loss to avoid liquidity noise.
#LiquidationMap

41

Jun 10
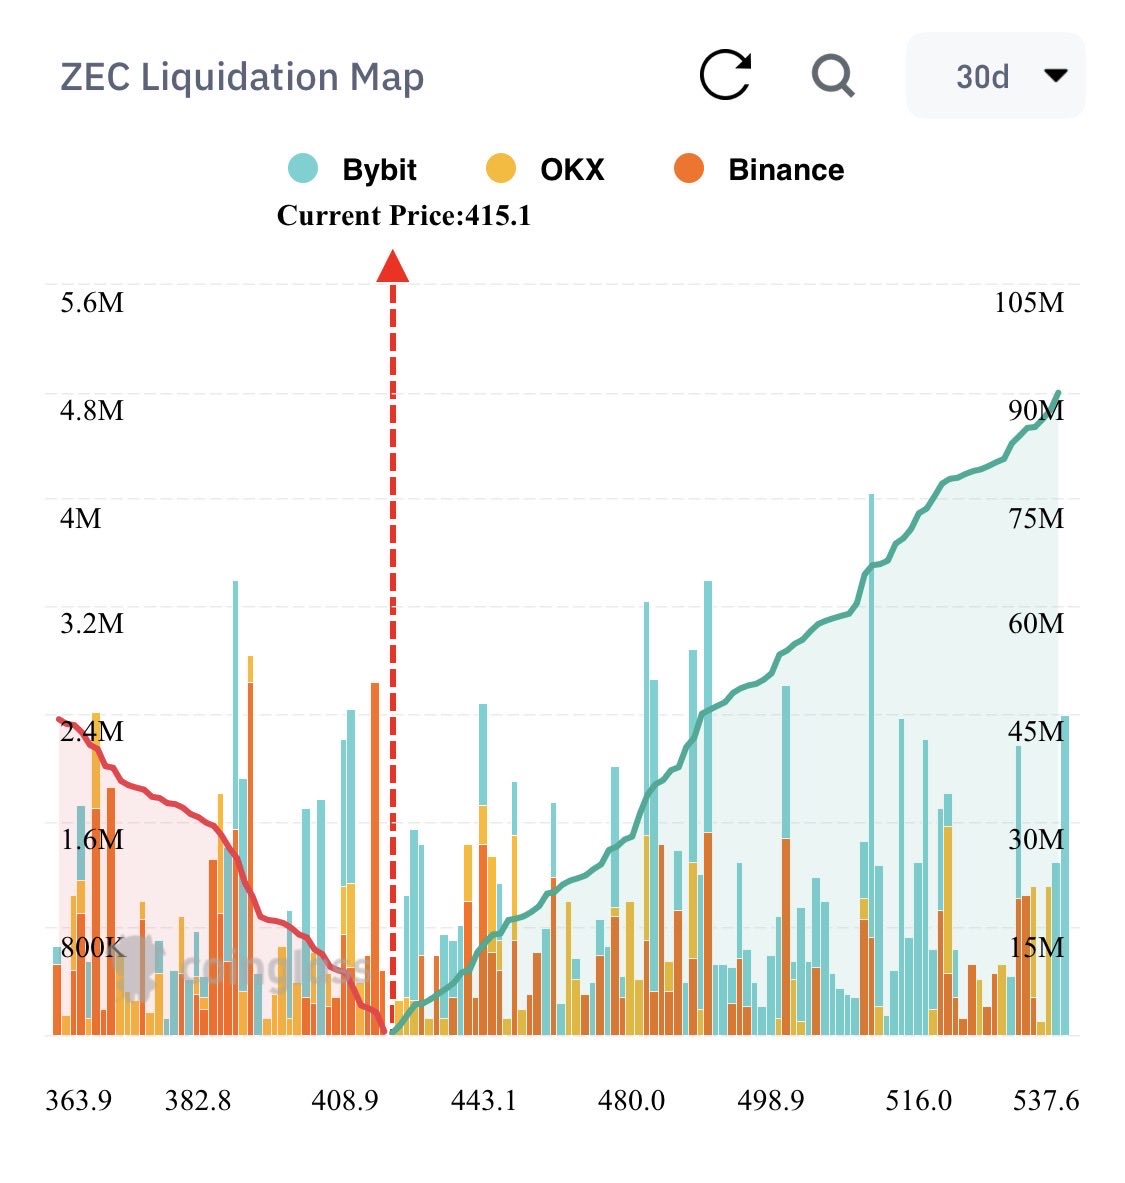
$ZEC Liquidation Heat Map Analysis (30D)
1-Dense liquidation wall right at/around current price (~408-443 zone): Heavy stacked bars (especially teal Bybit orange Binance). This is where a lot of leveraged positions (longs & shorts) are concentrated. A decisive break here could trigger a cascade.
2-Significant upside liquidity from 445 → 498 → 516-537. The green line is climbing aggressively, lots of short liquidations waiting above. If momentum continues, we could see a short squeeze fueling further upside (90M potential on the right axis).
3-Downside support appears thinner below 408, but earlier clusters around 380-400.
4-High volatility expected: Current price is sitting in a hot liquidation zone. Any strong candle (up or down) has the potential to ignite a squeeze.
5-Bullish bias in the short term if we hold above 408-415 and clear the next resistance cluster. The recovery structure building upside liquidity favors continuation toward 480-500 .
#ZECUSDT #liquidationmap #zcash

157

🧐 THE READ
Structure first. Direction second. Without exception.
No edge = no trade. Full stop.
Crowd figures this out the hard way. We already know.
t.me/outthink_the_market
🧵 4/4
#Bitcoin #BTC #CryptoTrading #OutthinkTheMarket #Liquidations #StopHunt #LiquidationMap
2
25

May 24
Theo bản đồ nhiệt 3D, Vùng 74K còn rất mỏng. (do ngày hôm qua giá về 74.289k đã đốt gần hết.
- Hiện nay vùng dưới 74k vùng trên 78K - 78,5K.
Theo anh chị em thì vùng nào sẽ bị thịt trước!
(Hình của coinank).
#BTC #Bitcoin #Liquidationmap

May 23

Bản đồ nhiệt bitcoin khung 3 ngày vùng thanh lý mạnh nằm trong khoảng từ $74k - $75k ! Theo các bạn vùng này có thể về được không?

13
1
30
8,923

May 17
ETH 5m — key level to watch.
At 2200 there is a significant cluster of short orders — clearly visible on the profile.
The question is simple: will aggressive impulsive buying show up at that level?
If yes, those shorts get steamrolled and the resulting move higher can be violent and fast.
If real impulsive buy pressure does not arrive — 2200 remains a ceiling and price gets rejected.
The level is marked. Now we wait to see who moves first.
#VPVR #TPO #LiquidationMap #OrderBook #SmartMoney #InstitutionalTrading #CryptoTrading

1
4
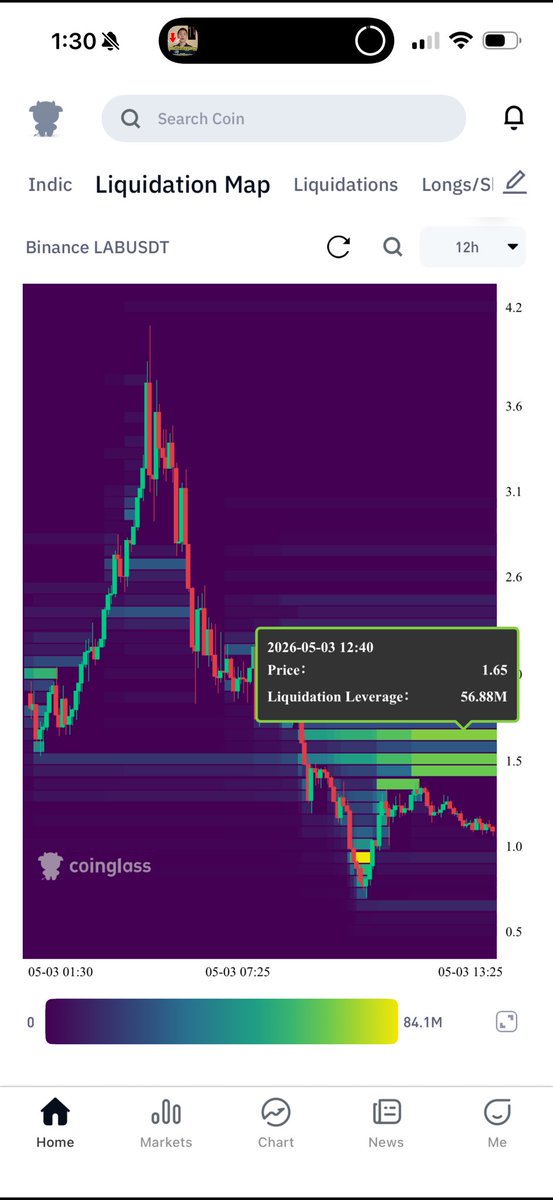
60

Watching the $LAB Liquidation Map closely. Significant liquidity clusters identified around the $1.65 level. Price is reacting exactly where the leverage is highest. 📊🔥#TCH #LABUSDT #CryptoTrading #LiquidationMap #TradingStrategy"
3
108

Apr 30
🧹🧹🧹 #Bitcoin #Liquidationmap
Apr 29

Yesterday I joked that market makers were watching me.
Today, the $80.5K–$82K sell wall is still sitting there.
Over 24 hours. Same perfectly spaced ~$3.3M orders.
Below price, bids are also stacking ,especially around $76.8K and the $75K–$76K zone.

2
161
🔴 THE PLAY
Bear bias dominant. Execution on confirmed rejection. Not assumption.
t.me/outthink_the_market
🧵 4/4
FREE ANAL 🔗t.me/outthink_the_market
#Bitcoin #BTC #CryptoTrading #OutthinkTheMarket #Liquidations #StopHunt #LiquidationMap
2
65