
1 Feb 2024
Revising Javascript After A Long Time || hecoin45
#coding #programming #75hard #75hardchallenge #coding #challenges #matplotlib #matplotlibpyplot #seaborn #python #datascience #data #dataanalytics #datascientist #machinelearning #machine
How To Revise A Coding Language :-
0%
Through Lec/Courses
0%
By Building Projects
0%
By Reading Documentation
0 votes • Final results
2
64

30 Aug 2021
Tutorial #24 . . . . . .
How to add a grid line horizontally to a graph?
#matplotlib #matplotlibpyplot #python #pythonlearning #rizwancode #pythoncode #programmings #DataAnalytics #DataVisualization #DataScientists #plot_labels #programmers #plt #line_graph #DataScience #data

1
6
30 Aug 2021
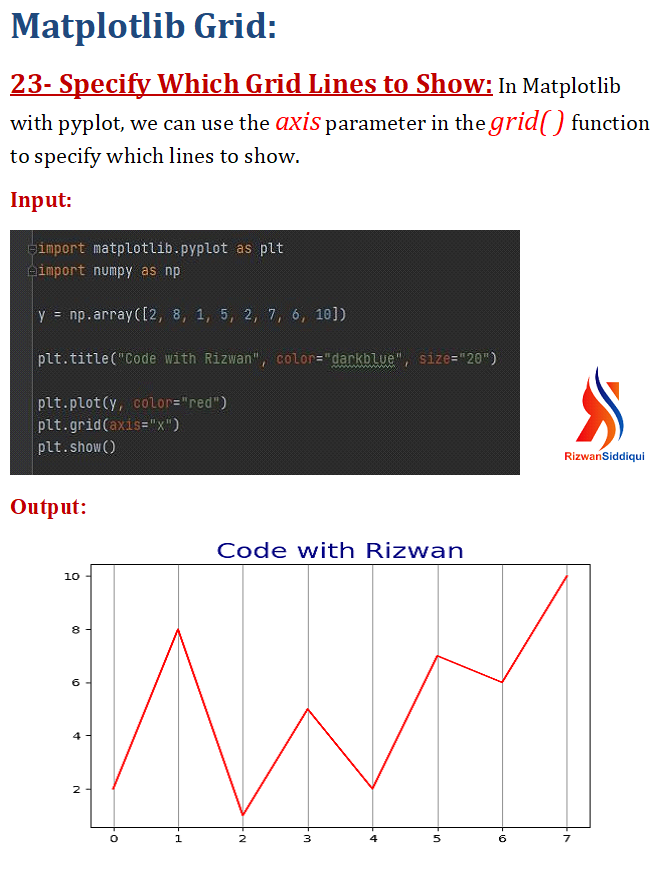
Tutorial #23 . . . . . .
How to add a grid line vertically to a graph?
#matplotlib #matplotlibpyplot #python #pythonlearning #rizwancode #pythoncode #programmings #DataAnalytics #DataVisualization #DataScientists #plot_labels #programmers #plt #line_graph #DataScience #data
2
30 Aug 2021
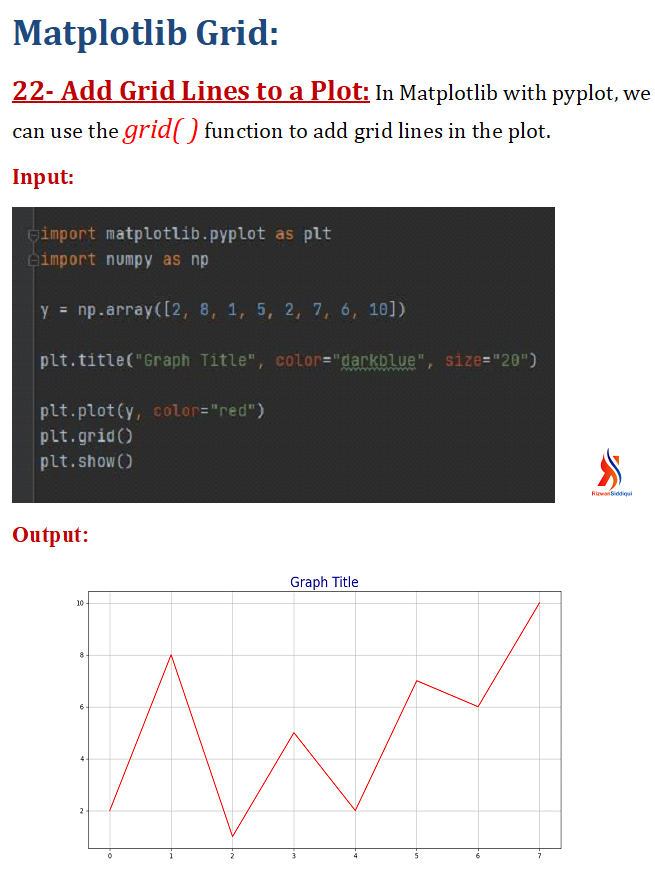
Tutorial #22 . . . . . .
How to add the gridlines in the graph?
#matplotlib #matplotlibpyplot #python #pythonlearning #python3 #rizwancode #pythoncode #programmings #DataAnalytics #DataVisualization #DataScientists #plot_labels #programmers #plt #line_graph #DataScience #data
2
28 Aug 2021
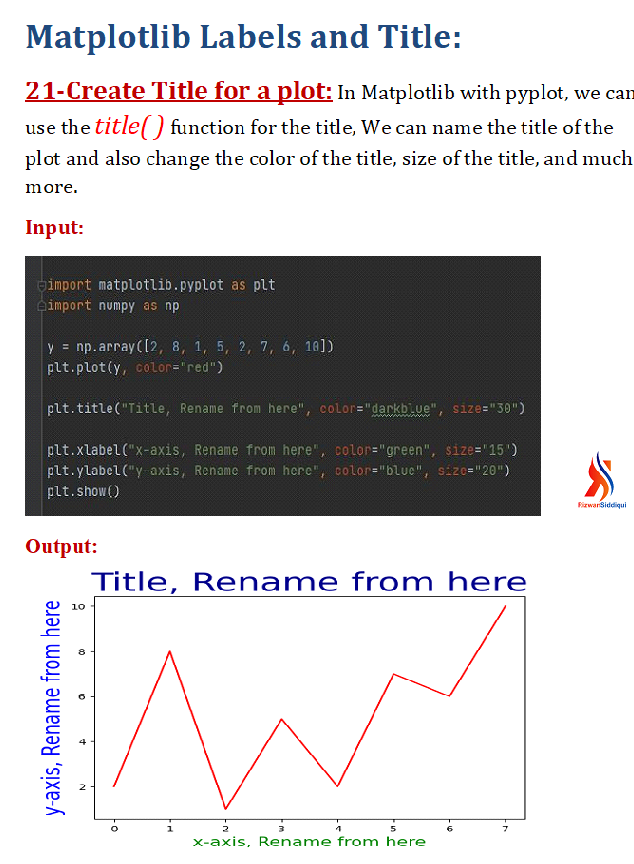
Tutorial #21 . . . . . .
How to create Title for the graphs?
#matplotlib #matplotlibpyplot #python #pythonlearning #python3 #rizwancode #pythoncode #programmings #programmer #plot #plots #graph #plot_labels #programmers #plt #line_graph #line_plot #plot_title #title #graph_title
1
14
18 Aug 2021
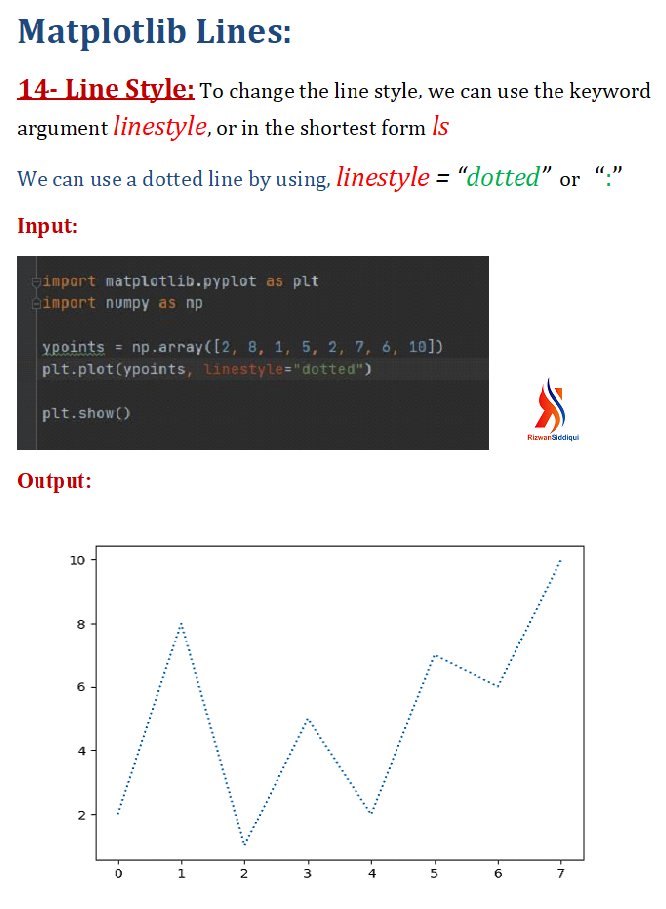
Tutorial #14 ........ How to change the line style of a graph? #Matplotlib #Python #numpy #linestyle #matlib #python_programming #programmer #programming #coding #lines #programminglife #graphs #graphs_in_python #matplotlibpyplot #pyplot #math
1
3
16 Aug 2021
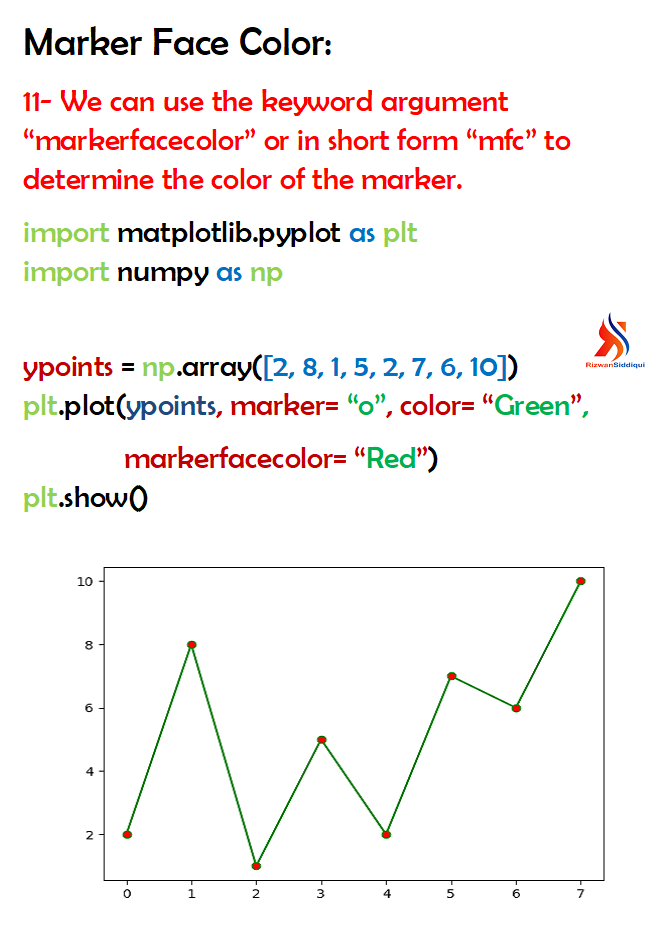
Tutorial #11
How to change the marker face color in a graph.
#python #matplotlib #markerfacecolor #program #programmer #programmers #programming #programmings #programmerlife #matplotlibpyplot #DataAnalytics #DataVisualization #graph #graph_in_python #graphs_in_matplotlib
4
16 Aug 2021
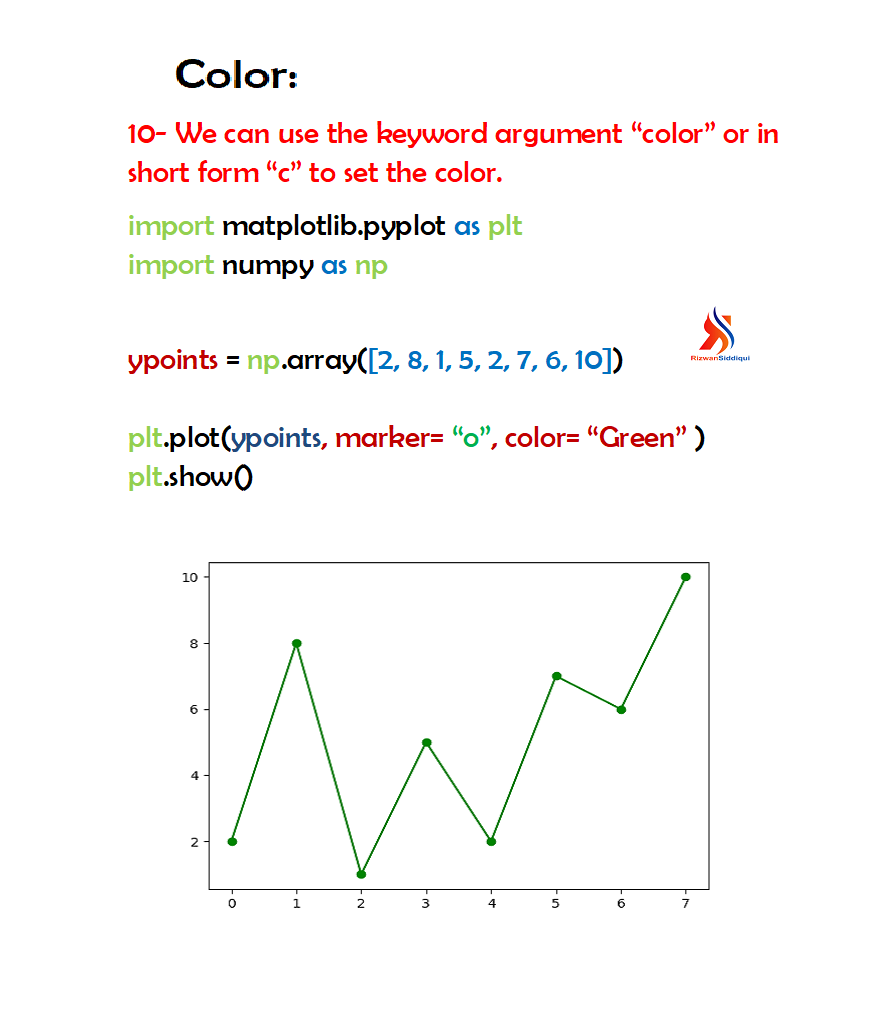
Tutorial #10
How to set the color of the line in a graph.
#python #matplotlib #marker_in_python #program #programmer #programmers #programming #programmings #programmerlife #matplotlibpyplot #DataAnalytics #DataVisualization #graph #graph_in_python #graphs_in_matplotlib
1
11

16 Jan 2021
Customizing the colour of data points in scatter plot in Matplotlib Python
#matplotlib #python #pythonprojects #pythonlearning #pythonprogramming #pythons #matplotlibpyplot #aipython #coding #jupyternotebook #jupyter #scatter #plot #statistics #colors #colours #datavisualization
1
1
15 Jan 2021
Learn to create a simple scatter plot in Matplotlib Python
#matplotlib #python #pythonprojects #pythonlearning #pythonprogramming #pythons #matplotlibpyplot #aipython #coding #jupyternotebook #jupyter #scatter #plot #statistics
2
1
10 Jan 2021
How to display 2 or more plots on the same Graph in Matplotlib Python
#python #matplotlib #aipython #ai #datavisualization #dataanalytics #datascience #pythonlearning #pythonprogramming #plot #pyplot #matplotlibpyplot
2
3
8 Jan 2021
Automatic X-axis assignment for a plot in Matplotlib Python.
#python #pythonlearning #pythonprogramming #pythonprojects #pythons #jupyternotebook #jupyter #matplotlib #matplotlibpyplot #IDE #codeeditor #plot #axis #datavisualization #datascience
@matplotlib @PythonHub
2
2
7 Jan 2021
Format the line style of a plot using several line type, color and width in Matplotlib Python
#python #pythonprogramming #aipython #code #codinglife #codingforkids #codingforbeginners #matplotlibpyplot #matplotlib #pyplot #line #graph #jupyternotebook #jupyter #datavisualization
1
5
7 Jan 2021
Assigning X and Y label to a plot in Matplotlib Python
#aipython #ai #python #matplotlib #matplotlibpyplot #pythonprogramming #pythons #pythonlearning #IDE #plotlabel #label #labels #datavisualization #datascience #plot
2


7 Aug 2017
Trying my hands on matplotlib in python
#bigdata #matplotlib #matplotlibpyplot… instagram.com/p/BXgb51LFibP/