

4 Mar 2024
Also, if you digitize Bjorn's data, the least-squares regression has a p-value of 0.22 and a standard error of 0.15 (on a slope of 0.19), so the regression does not seem to be statistically significant.
But none of that makes PlotLabel -> "Lomborg is a Fraud" any less funny.
10
1,073

28 Feb 2023
In my classes I use @Mathematica to simulate and plot a standard Cauchy distribution for increasingly greater sample sizes (10^i for i from 1 to 6): Table[ListPlot[RandomVariate[CauchyDistribution[], 10^i], Filling->0, PlotLabel->”10^”~~ToString[i], {i, 1, 6}].
1
1
2
366

13 Jan 2021
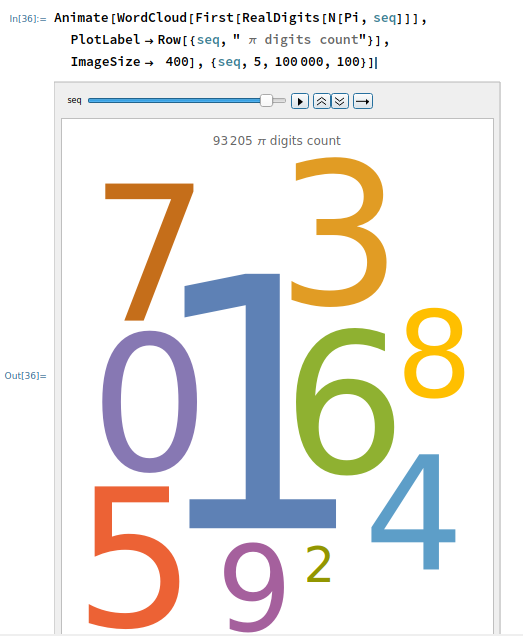
View the count of π digits word cloud animation...
Animate[WordCloud[First[RealDigits[N[Pi, seq]]],
PlotLabel -> Row[{seq, " \[Pi] digits count"}],
ImageSize -> 400], {seq, 5, 100000, 100}]
#math #WolframLanguage #WolfLang
1
2

7 Jan 2021
Assigning X and Y label to a plot in Matplotlib Python
#aipython #ai #python #matplotlib #matplotlibpyplot #pythonprogramming #pythons #pythonlearning #IDE #plotlabel #label #labels #datavisualization #datascience #plot
2

19 Feb 2016
@wolframtap (* Easy GIS in #WolframLanguage *) GeoListPlot[#, PlotLabel -> #["Image"]] &[=["Sagrada Família"]]
1
2

3 Oct 2014
Graph layouts on curves: Table[PathGraph[Range[20], GraphLayout -> l, PlotLabel -> l], {l, {"CircularEmbedding", "SpiralEmbedding"}}]
4
3 Mar 2014
Custom dynamic interface with SetterBar: Dynamic[Plot[Sin[n x], {x, 0, 2 Pi}, PlotLabel -> SetterBar[Dynamic[n], Range[10]]]]
2
6