
📉 The S&P dipped into the 7,250 range, held it twice, and snapped back both times on real volume 💥. That’s not a dead-cat bounce — that’s a support level doing its job 🛡️.
But the recovery stalled.
The Qs are sitting right at resistance, and until the new Fed chair tips his hand on rates Wednesday, this market isn’t going anywhere fast ⏳.
Expect rangebound action, 7,300 to 7,500, with IWM as the quiet outlier — making higher highs and higher lows while the big indexes chop.
Small caps caught a rotation bid and barely flinched on the vol spike 🔄.
That’s a tell.
Volatility spiked early and faded by Friday 📉➡️📈. VIX back near 17, NASDAQ vol back near 26. The fear trade unwound almost as fast as it showed up ⚡.
Summer’s here — volume dries up, vol dries up, rangebound becomes the default ☀️.
Theta-positive, delta-neutral trades were built for exactly this 🧠💰.

11

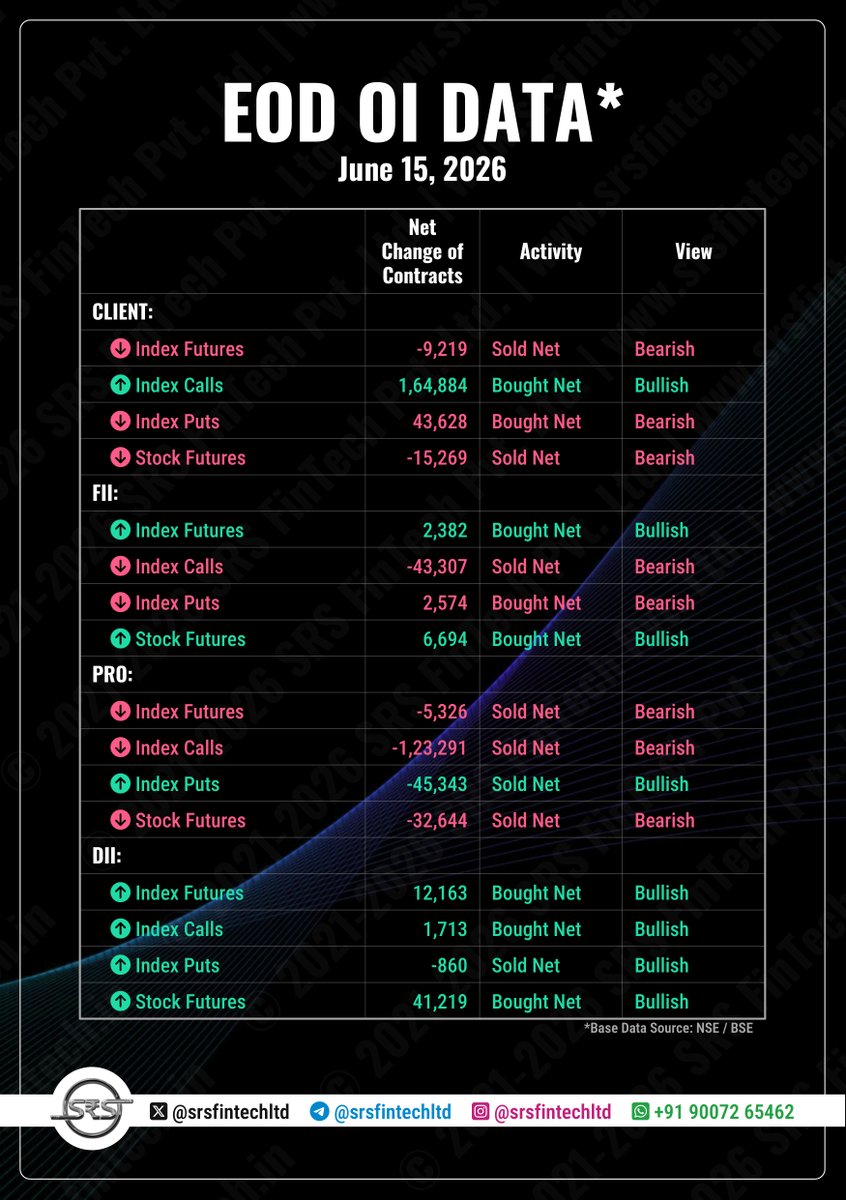
💹 EOD OI Pulse
🗓 15-Jun-2026
FII going 🛡️ Defensive:
🔼 Index Futures: 2382 (Bullish)
🔽 Index Calls: -43307 (Bearish)
🔼 Index Puts: 2574 (Bearish)
🔼 Stock Futures: 6694 (Bullish)
PROs going ⚖️ Hedged:
🔽 Index Futures: -5326 (Bearish)
🔽 Index Calls: -123291 (Bearish)
🔽 Index Puts: -45343 (Bullish)
🔽 Stock Futures: -32644 (Bearish)
Overall Sentiment Interpretation next trading day:
FIIs are cautious, adopting a hedged bearish stance with weak conviction due to decreasing volumes. PROs, however, are aggressively setting up for a rangebound market by selling both Index Calls and Puts with strong volume on the put side, but their futures short adds a mild bearish tilt. This dynamic suggests a struggle between mild bearish sentiment and consolidation within a range.
💡 Final Market View: Sideways to Mildly Bearish
📊 Navigating the nuances, a tight range might be ahead! 🧐
⚠️ Disclaimer: This post is AI-generated and strictly for educational and informational purposes only. It does not constitute, contain, or imply any investment advice, stock recommendations, financial tips, or solicitation to buy or sell any securities or financial instruments. There are no references or suggestions related to Buy/Sell, Entry/Exit, Stop Loss (SL), or Target levels. Any market data or chart images shared are solely to illustrate technical concepts. We are not SEBI Registered Advisors, do not promote, solicit, or endorse trading decisions, and do not accept any liability for actions taken based on this content.
No compensation, association, or financial relationship exists between us and any entities or securities mentioned herein. Viewers are strongly advised to conduct their own research and consult with a certified financial advisor or SEBI registered professional before making any investment or trading decisions.
#StockMarketIndia #Nifty50 #BankNifty #FinTwit #Sensex #Trading #DalalStreet #FII #OptionsTrading #Investing #IndianEconomy #StockMarketNews #Intraday #Nifty #MarketOutlook #ShareMarket #Traders #NSE #BSE #SmartMoney #PriceAction #OpenInterest

80


$DXY
$DXY opened the week with a small gap lower following last week's rejection at horizontal resistance near the upper end of its broad accumulation and low-base consolidation pattern.
The dollar remains trapped within this range, keeping the outlook neutral to bearish overall.
Last week was the 50-day EMA crossing above the 200-day EMA, the first bullish crossover since March 2025 when the decline started to accelerate momentum.
Last week's moving average crossover could provide a layer of support on future pullbacks, but the $DXY has yet to translate into a meaningful breakout or show any real strenght.
As long as the $DXY continues to trade between roughly 96 and 100, price action remains rangebound and the broader outlook stays neutral to bearish until proven otherwise.
$UUP $UDN $EURUSD $USDJPY $GBPUSD $USDCHF $USDCAD $AUDUSD $NZDUSD $FXE #EURUSD #GBPUSD #AUDUSD #USDCAD #USDCHF #NZDUSD #EURJPY #GBPJPY #AUDJPY #EURGBP #EURCHF #GBPCHF #CADJPY #CHFJPY #EURAUD

1
4
743

All data collected. Here's the tweet:
---
Bitcoin is climbing on extreme fear — and that divergence is the most important thing on the chart right now.
BTC is trading at $65,683, pressing up into the Bollinger Band midline at $66,500 — a level that has acted as the pivot of this entire range. The daily RSI sits at 40.96, recovering from deeply oversold territory but not yet reclaimed bullish momentum. The MACD histogram is printing positive bars ($1,004) for the first time in weeks, signalling the early stages of a potential trend shift. Key support is the $63,684 low from this morning's session.
If bulls can close a daily candle above $66,500, the upper Bollinger Band at $76,069 opens up as the next major target — a ~16% move. Funding rates are slightly negative (-0.0046%), meaning shorts are paying longs, which removes a key source of downside pressure. Open interest sits at $2.13B — not overheated, leaving room for a sustained move higher without an immediate liquidation squeeze to the downside.
The thesis breaks if BTC loses $63,500 on a daily close — that would confirm the range lows as resistance-turned-support have failed. Watch the $66,500 midline flip closely. A rejection there keeps us rangebound. A clean break turns this into a re-test of $70K territory.
$BTC #Bitcoin #CryptoMarket #TechnicalAnalysis
23

🚨 CRYPTO MARKET UPDATE
📅 Latest prices (as of ~08:54 UTC on June 15, 2026)
₿ Bitcoin — $65,705
🔴 5 today (0.01%)
🟢 4.36% weekly
🔴 15.74% monthly
🔴 24.75% YTD
🔴 38.36% YoY
(Market Cap: $1.316T)
⧫ Ether — $1,717.27
🔴 7.83 today (0.45%)
🟢 1.78% weekly
🔴 21.09% monthly
🔴 42.02% YTD
🔴 32.31% YoY
(Market Cap: $269.9B)
🔶 Binance Coin (BNB) — $619.00
🟢 2.60 today ( 0.43%)
🟢 2.82% weekly
🔴 5.75% monthly
🔴 28.44% YTD
🔴 4.89% YoY
(Market Cap: $83.3B)
🐳 Cardano (ADA) — $0.1804
🔴 0.0026 today (1.44%)
🟢 6.33% weekly
🔴 29.00% monthly
🔴 45.58% YTD
🔴 71.25% YoY
(Market Cap: $6.59B)
☀ Solana — $71.33
🟢 0.15 today ( 0.21%)
🟢 6.53% weekly
🔴 17.75% monthly
🔴 42.80% YTD
🔴 52.71% YoY
(Market Cap: $41.3B)
✕ XRP — $1.181
🔴 0.004 today (0.35%)
🟢 1.44% weekly
🔴 16.19% monthly
🔴 35.58% YTD
🔴 46.94% YoY
(Market Cap: $73.6B)
🟣 Polkadot — $1.00
🟢 0.01 today ( 0.85%)
🟢 3.25% weekly
🔴 20.74% monthly
🔴 43.78% YTD
❄ Avalanche — $6.78
🟢 0.00 today ( 0.06%)
🟢 0.33% weekly
🔴 27.05% monthly
🔴 44.85% YTD
🔷 Polygon (MATIC) — $0.08
0.00 today (0.00%)
🔴 1.46% weekly
🔴 15.61% monthly
🔴 23.42% YTD
🌌 Cosmos (ATOM) — $1.98
🔴 0.02 today (1.22%)
🟢 12.46% weekly
🔴 3.28% monthly
📈 2.78% YTD
Quick Takeaways:
Crypto mostly flat this morning with very small moves. Bitcoin holding just below $66K, while altcoins are mixed.
Weekly gains remain solid for most majors (BTC 4.36%, Solana 6.53%, Cardano 6.33%, Cosmos 12.46%).
Context: The broader riskon mood from the USIran deal is supporting global markets (Asia & US futures strong), but crypto is in quiet consolidation mode.
Overall tone: Cautious and rangebound after yesterday’s rebound. Still waiting for stronger conviction to break out.
30

Net portfolio return: 16.5% 🚀🚀
Shared these Diwali picks on 19 Oct 2025 with an equal 10% allocation each.
Markets may be rangebound, but alpha is being created stock by stock. 🚀
1. #AXISCADES: 1517 → 1930 ( 27.22%)
2. #SENORES: 715 → 1284 ( 79.58%)
3. #NAM-INDIA: 913 → 1144.4 ( 25.35%)
4. #YATHARTH: 811 → 842.1 ( 3.83%)
5. #ABDL: 552 → 639.95 ( 15.93%)
6. #WAAREENER: 3535 → 3053.1 (-13.63%)
7. #NETWEB: 3833 → 4665 ( 21.71%)
8. #PAYTM: 1285 → 1121.9 (-12.69%)
9. #PRICOLLTD: 525 → 580.45 ( 10.56%)
10. #MARINE: 229 → 249.4 ( 8.91%)
x.com/pocket_bull_/status/19…
19 Oct 2025

Hey X fam!
Happy Diwali! ✨
You know what’s better than sweets and diyas? Sweet returns from Muhurat Trading! Ready to light up your portfolio for 2025?
Let’s check out my top picks for this auspicious occasion.

1
2
7
1,369

10h
It makes sense to me for the market to rip at least until into the 19th when the deal is signed, but wouldn’t be surprised at all about continuation after this day either.
$BTC is at an extreme right now - range lows. We can easily become rangebound here and through the summer time. I think we can get a move back to 70s from this signing
4
3
64
6,117

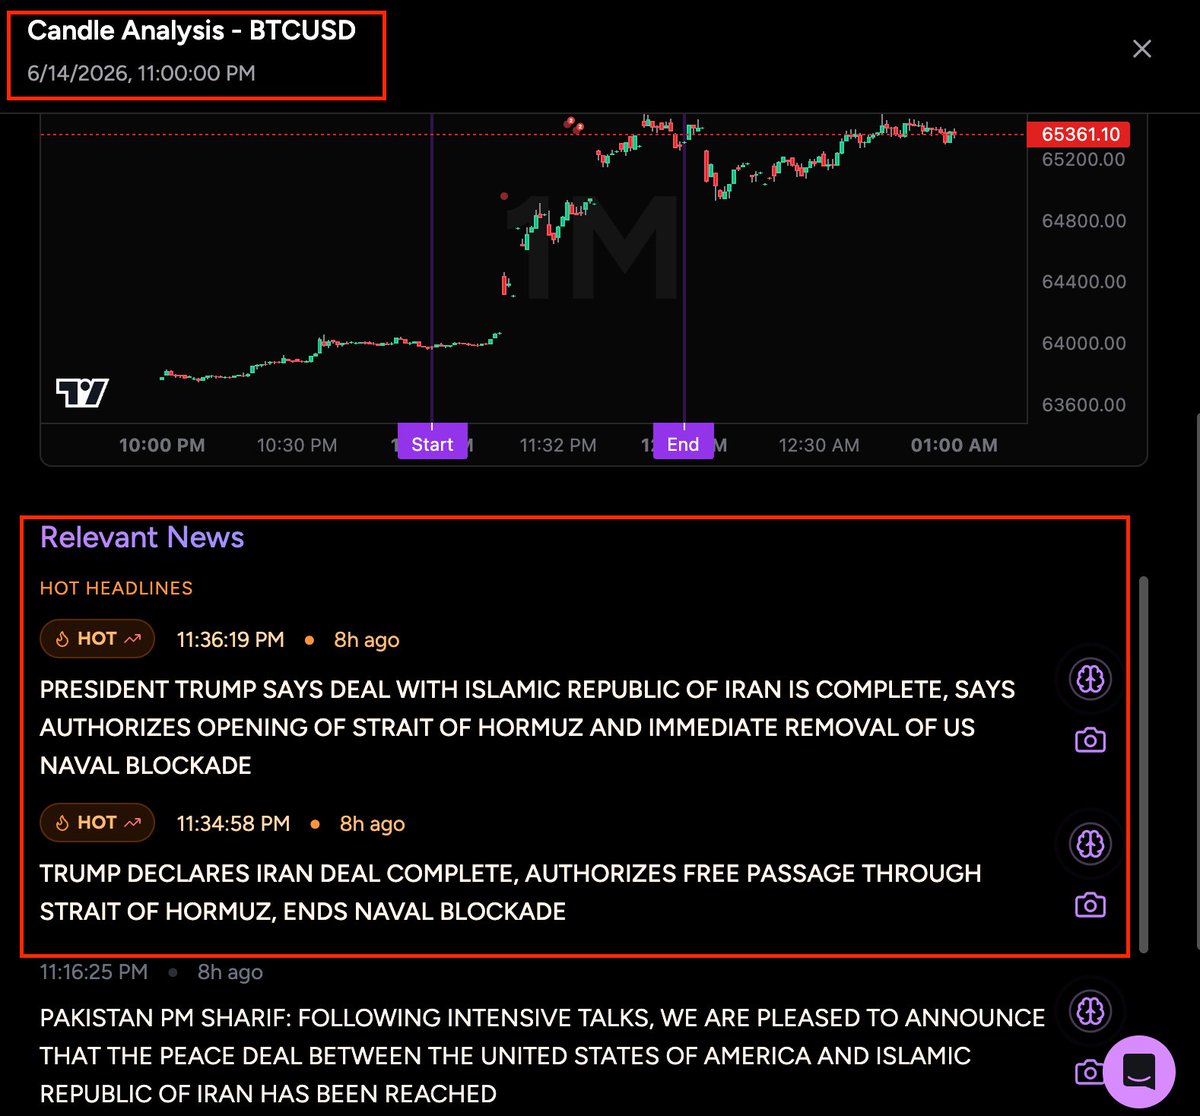
bitcoin:native is LOVING this (Analysis INSANE new feature inside)
Following the optimism around the Pakistan announced peace deal progress between the US and Iran, Bitcoin has started the week with strong bullish price action
What has changed?
BTC, a risky asset, was feeling the pressure from ALL angles.
--> Higher inflation/interest rate outlook
--> Market uncertainty
--> Stronger US Dollar
MRKT has been calling bearish price moves on BTC for the entirety of the war, with analysis being posted here on X as well, accurately predicting sells since 78k
BUT
The shift, at least short term is here!
Bitcoin broke out of its rangebound price action on Sunday, June 14th following the announcement. (Look at the candle breakdown below)
For as long as the deal optimism holds, expect more inflow into BTC as risk appetite grows with geopolitical resolutions. Eventually, IF a deal gets finalized (big if), lower interest rates down the line will fuel BTC longs even more
To come equipped for every possibility, MRKT users just received their newest weapon in the armory for attacking the markets
Enter: Price Scenarios🔥
You now get real visualization of projected price paths for the main bias
MRKT is now literally printing price movement on to the home dashboard, providing you an advanced technical outlook in combination with institutional grade fundamentals
All that's left to do is follow your plan, stick to your entry setup and let the market do the rest!
The innovation NEVER stops


6
431

👀#HAL continues to linger in a sideways range and may be rangebound as long as it trades below 4400, on the lower side 4000 is a key support. It may likely be in the final phase of completing a larger wave e of a presumed Triangle. What comes next is an explosive upside thrust ?
120

Physical spot rangebound for weeks while these producers swing 8%. The equity leverage cuts both ways. What's driving the move today?
45


ZENFLOW WEEK AHEAD. June 15-22 2026.
1. FOMC Decision — June 17
The Fed meets June 16–17. Rate hold is the base case per CME FedWatch, but Powell’s tone on inflation matters. PCE jumped 3.8% in April — any hawkish signal ripples straight into EM flows and the rupee.
2. RIL AGM — June 19
Mukesh Ambani addresses shareholders at the 49th AGM. Market will be listening for one thing: Jio IPO timeline. Any concrete signal on listing plans could re-rate the entire RIL complex.
3. Wipro Buyback Closes — June 17
The ₹15,000 Cr buyback tender window shuts Wednesday. Settlement dynamics and acceptance ratio will drive Wipro price action in the second half of the week. IT sector sentiment follows.
4. Crude Iran-US Geopolitics
Brent has been rangebound above $90 on Strait of Hormuz fears. Any escalation or de-escalation in Iran-US negotiations this week is a direct trigger for energy, OMC, and aviation stocks.
5. FPI Flow Watch
FPIs have been net sellers every month of 2026 except February — ₹62,800 Cr pulled from equities in the first fortnight of June alone. Whether global risk-on sentiment post-FOMC reverses this matters for mid-cap and smallcap breadth.
Five triggers. One week. Stay research-first. — At Zenflow Finance, we track what actually moves markets.
5
449

Think we might see $3 again in a few years. But yeah, we're going to be rangebound between $1-$1,50 for a while!
29

Haha, that's how it goes sometimes.
For now it's still a rangebound mess. I'll be screaming from the rooftops when it's set up to buy again.
1
9
545

Yeah I lost a lot on oil but understood prices would remain rangebound until we ran out of inventories, and seems like Iran surrendered 1 month before that point
1
2
64

FOMC STARTS TOMORROW. WARSH'S FIRST RATE DECISION WEDNESDAY.
Kevin Warsh chairs his first FOMC meeting starting tomorrow. Rate decision Wednesday. Warsh is the most crypto-literate Fed Chair in history but also a monetary hawk and his signals of independence from political pressure for cuts have dashed earlier hopes that a Trump-appointed chair would ease aggressively.
👉Here's the scenario map for Wednesday:
🟢 Hold dovish language -> "watching data, cuts possible later" -> BTC squeezes toward $70K
🟡 Hold neutral -> market stays rangebound -> Iran deal becomes the deciding variable
🔴 Hold hawkish signal -> "prepared to hike if needed" -> BTC retests $60K
👉The inflation data - CPI 4.2%, PPI 6.5% - gives Warsh no room to be dovish. But a confirmed Iran deal between now and Wednesday changes the inflation calculus entirely. Oil down = CPI down = Warsh gets a gift on his first day.
Today's Iran news and Wednesday's FOMC are the same trade. 🏛️
#KevinWarsh #FederalReserve #Bitcoin #BTC #MacroTrading
49

PHILIPPINE stocks are likely to remain rangebound this week as investors cautiously await policy decisions from the Bangko Sentral ng Pilipinas (BSP) and the US Federal Reserve, analysts said. manilatimes.net/2026/06/15/b…
64

$zec still moving sideways, waiting for a breakout. above 21.40 and it gets interesting, but under 20.85 could get rough. just rangebound vibes right now.
1
75

Jun 13
Natural Gas Weekly Outlook - June 8–12, 2026
Top News Story: Bears Reclaim Momentum as 108 Bcf Inventory Build and Sticky Permian Production Stop June Heat Wave in Its Tracks
Natural gas futures suffered a second consecutive week of losses, with the July NYMEX contract settling on Friday at $3.125 as unexpected physical supply looseness dampened early-summer weather enthusiasm.
The primary catalyst for the downward pressure arrived on Thursday morning via the EIA storage print, which caught the market off-guard with a stout 108 Bcf net injection for the week ending June 5.
This came in significantly above consensus market expectations of 99–101 Bcf and outpaced the prior week's 95 Bcf build. Total working gas in underground storage expanded to 2,686 Bcf.
While this keeps domestic inventories 5 Bcf below last year's exceptionally bloated levels, it forced the surplus against the five-year average back up to 151 Bcf (6.0%). Bears seized on the uninspiring data, using the high production backdrop to thoroughly offset a major early-season heat ridge locking down the Western and Central U.S.
Market Notes
The structural supply landscape remains heavier than expected as the industry navigates the first major heat block of June, with production showing resilient year-over-year gains.
Storage Loosening Reverses Progress: The triple-digit 108 Bcf injection erased the inventory progress made during late May. Despite robust daily power burns, the combination of lower industrial holiday demand from Memorial Day carryover and stable baseline injections allowed the broader storage cushion to expands back past 6%.
Permian Associated Supply Resilience: Lower 48 dry production proved remarkably sticky, holding a strong line near 107.5 Bcf/d this week. Year-over-year data indicates that national dry gas output is up 2.6% over the same week in 2025. Rising crude oil prices toward $90/bbl are driving high levels of associated Permian gas, outrunning the voluntary dry gas shut-ins witnessed last month.
LNG Bottlenecks Persist: Lower 48 LNG feedgas demand hovered near 16.5 Bcf/d, remaining well below March's peak of 19.7 Bcf/d due to ongoing midstream maintenance. Traders are eagerly anticipating the June 9–10 expiration of the Sinton compressor station maintenance, which should gradually allow South Texas Corpus Christi receipts to climb back toward their historical 3.7 Bcf/d ceiling.
Macro Risk Lifted: WTI crude trading near $90/bbl and geopolitical tensions in the Middle East continue to provide an underlying floor for long-term winter contracts, but near-term prompt pricing remains heavily dictated by the immediate oversupply of domestic physical molecules.
Price Summary and Recent Movements
A defensive week on the trading floor as prompt-month contracts broke down through near-term support lines under a wave of technical liquidation.
NYMEX Data as of June 12, 2026:
Contract: July 2026 (NGN26)
Last Price: $3.125
Change (Day): -$0.055
Change (Week): -$0.130
Volume: 104,800 (Moderate-High)
Contract: August 2026 (NGQ26)
Last Price: $3.190
Change (Day): -$0.052
Change (Week): -$0.120
Contract: September 2026 (NGU26)
Last Price: $3.165
Change (Day): -$0.048
Change (Week): -$0.110
Contract: October 2026 (NGV26)
Last Price: $3.210
Change (Day): -$0.045
Change (Week): -$0.110
Cash Trade: Spot physical molecules at Henry Hub trended slightly softer following the EIA release, averaging $2.76 as local regional pipeline operators noted comfortable linepack despite regional power spikes.
Technical Picture: The July contract surrendered its 20-day moving average early in the week and closed dangerously close to psychological support at $3.10. Falling daily MACD bars indicate shifting short-term control into the hands of momentum short-sellers, though the RSI has cooled significantly to 44.5.
Key Market Factors
Supply: The international flow remains balanced, with Canadian border crossings injecting 5.4 Bcf/d into Northern pipeline channels to offset minor internal repairs in the Northeast.
Demand: Widespread extreme heat throughout Northern and Central Mexico kept cross-border exports pinned to a near-record pace of 7.5 Bcf/d, keeping regional South Texas cash hubs heavily insulated.
Power Gen Share: According to the EIA’s newly updated June Short-Term Energy Outlook, natural gas is projected to capture more than 44% of total U.S. monthly electricity generation during peak summer weeks, up from prior forecasts due to reduced coal baseload operations.
Weather Shifts: The weather map remains a battlefield. While scorching, unseasonably hot conditions are driving record early power burns across the West Coast and Desert Southwest, weather models have introduced slightly cooler, wet weather blocks into the Great Lakes and Mid-Atlantic regions for the upcoming week, threatening a temporary dip in national cooling degree days (CDDs).
Upcoming Report Expectations
The June 18 EIA Storage Report is preliminary-modeled to reflect a moderately tighter, though seasonally typical injection in the 88–94 Bcf range. Forecasters highlight that the return of full operations at Gulf LNG terminals and intensifying hot weather grids across Texas and the Southeast should finally curb the recent string of triple-digit weekly builds.
Funds Activity
Managed Money accounts heavily liquidated their remaining short-term long positions following Thursday's bearish 108 Bcf storage surprise. However, commodity trading advisors (CTAs) note that institutional long-term buying remains highly active in the calendar 2027 strips. Commercial operators are stepping away from near-term summer hedging, preferring to lock in defensive positions on winter contracts which continue to maintain a steep premium above $3.90.
Outlook for the Week Ahead
The bias for next week is Neutral / Rangebound with Downside Traps. Until production metrics show a clear retreat below 107 Bcf/d or LNG export facilities return to 18.5 Bcf/d capacity, summer weather spikes will likely meet heavy overhead resistance.
Strategy: Industrial procurement end-users should exercise patience, using any technical extensions down into the $3.02–$3.08 support zone to layer in core summer block hedges. Tactical traders should look to sell rallies that approach the $3.22 overhead resistance mark, as current storage cushions leave little room for a sustained near-term breakout.
#NaturalGas #Commodities #LNG

2
224