
Jun 1
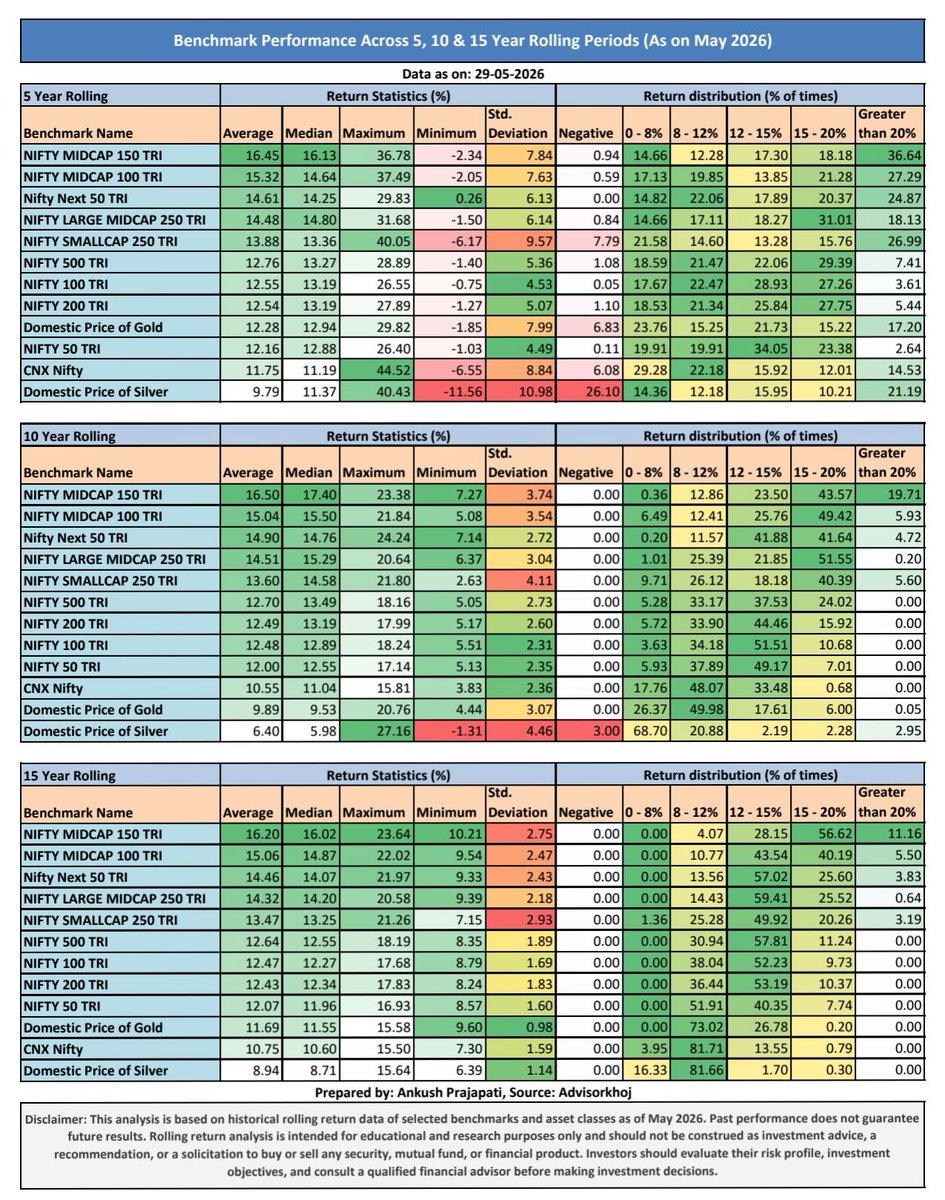
Benchmark Rolling Return Study: Key Findings
🔹 5-Year Rolling Returns
• NIFTY MIDCAP 150 TRI delivered the highest average return (16.45%).
• Midcaps outperformed large caps but with higher volatility.
• NIFTY 50 TRI was the most stable equity benchmark.
• NIFTY NEXT 50 TRI recorded no negative 5-year rolling periods.
• Small Caps saw the deepest drawdowns (-6.17%).
• Midcaps generated >20% returns in up to 36% of observations.
🔹 10-Year Rolling Returns
• NIFTY MIDCAP 150 TRI remained the top performer (16.50%).
• Volatility declined significantly across all benchmarks.
• No equity benchmark delivered negative 10-year rolling returns.
• Large Caps showed strong consistency with most returns clustered in the 12–15% range.
• Midcaps maintained superior return potential without excessive risk.
🔹 15-Year Rolling Returns
• Negative rolling returns disappeared across all equity benchmarks.
• NIFTY MIDCAP 150 TRI continued to lead (16.20% average return).
• Return volatility reduced sharply, improving predictability.
• Most large-cap returns were concentrated between 12–15%.
• Long holding periods significantly improved investment outcomes.
Disclaimer: Past performance is not indicative of future returns. Data is based on benchmark rolling return analysis as of May 2026 and is for educational purposes only.
#RollingReturns #Nifty #MutualFunds #WealthCreation #Investing #MF360WW
2
4
13
1,088

May 25
Rolling Return, Portfolio Change और Risk: SIP से पहले समझिए Fact Sheet का गणित!
Watch : youtube.com/live/RbQBmJH9YME
#mutualfunds #factsheet #sip #investing #portfolio #rollingreturns #thebonus
@PuriPurivicky @devgzb @DivyaCvedi

2
2
49
May 22
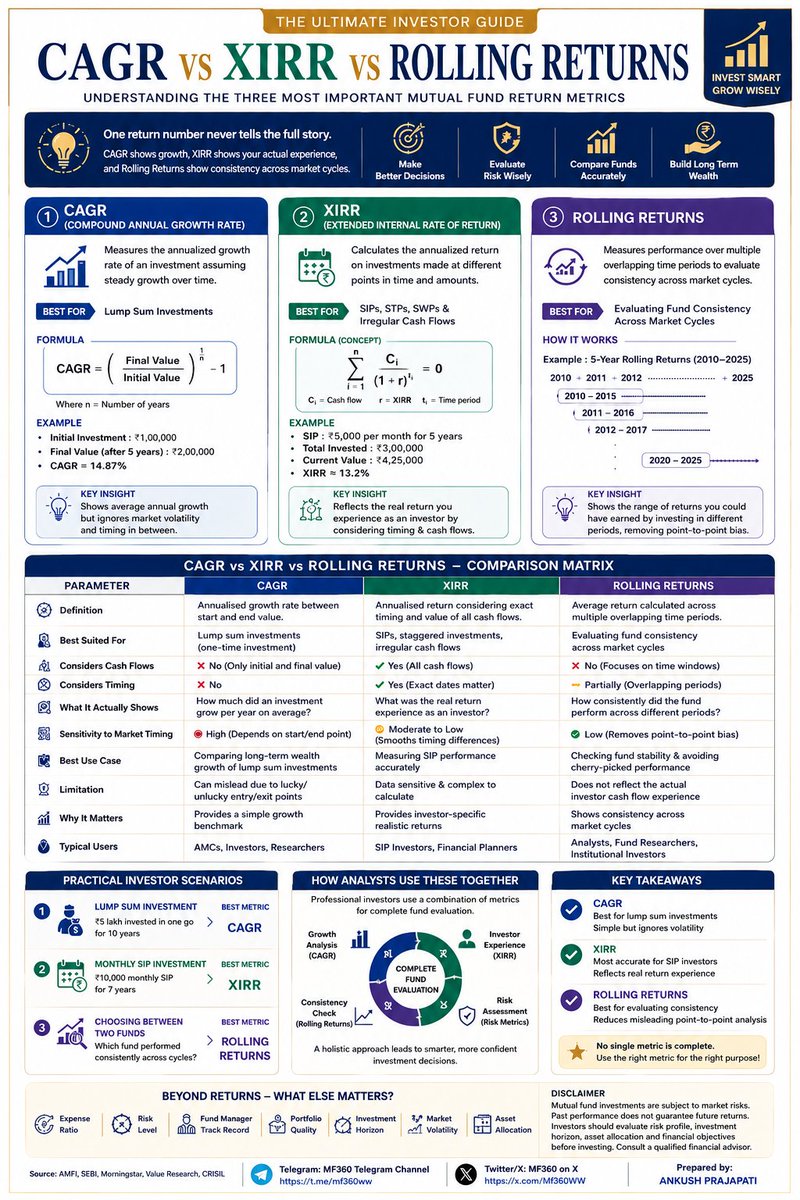
CAGR vs XIRR vs ROLLING RETURNS
📈 CAGR = Wealth Growth
💰 XIRR = Actual Investor Return
📊 Rolling Returns = Performance Consistency
Understanding the difference between these three metrics is essential before selecting any mutual fund.
Disclaimer: Mutual fund investments are subject to market risks. Please read all scheme-related documents carefully before investing.
#Finance #MutualFunds #CAGRvsXIRR #RollingReturns #PersonalFinance #InvestorEducation
1
16
79
3,620
May 11
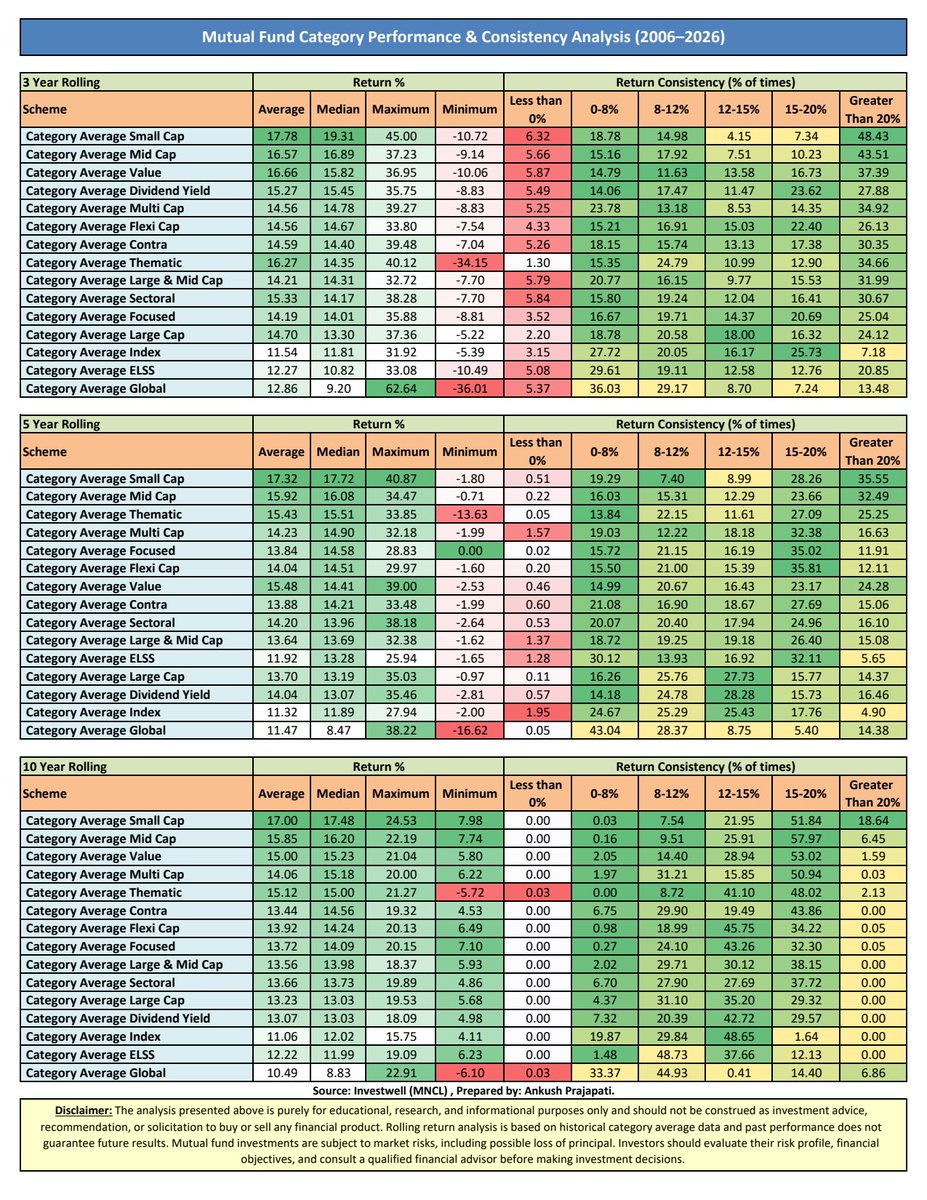
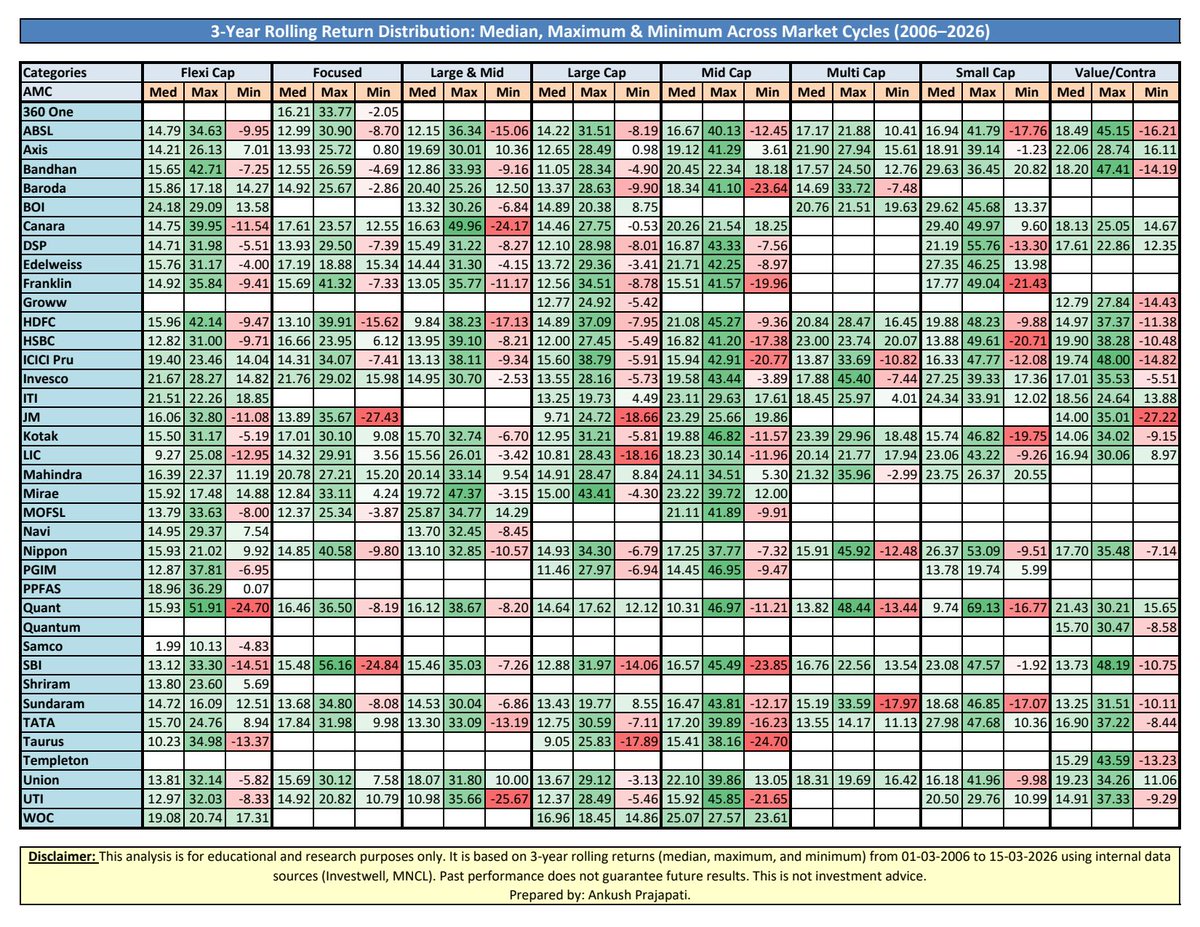
20 years. Multiple market cycles. One important conclusion:
Consistency matters more than temporary outperformance.
This rolling return analysis (2006–2026) evaluates category-wise behaviour across 3-Year, 5-Year, and 10-Year investment horizons to identify return sustainability, downside resilience, and long-term wealth creation potential.
Prepared by: Ankush Prajapati.
#MutualFunds #RollingReturns #WealthManagement #InvestmentStrategy #EquityMarkets
13
790
Apr 28
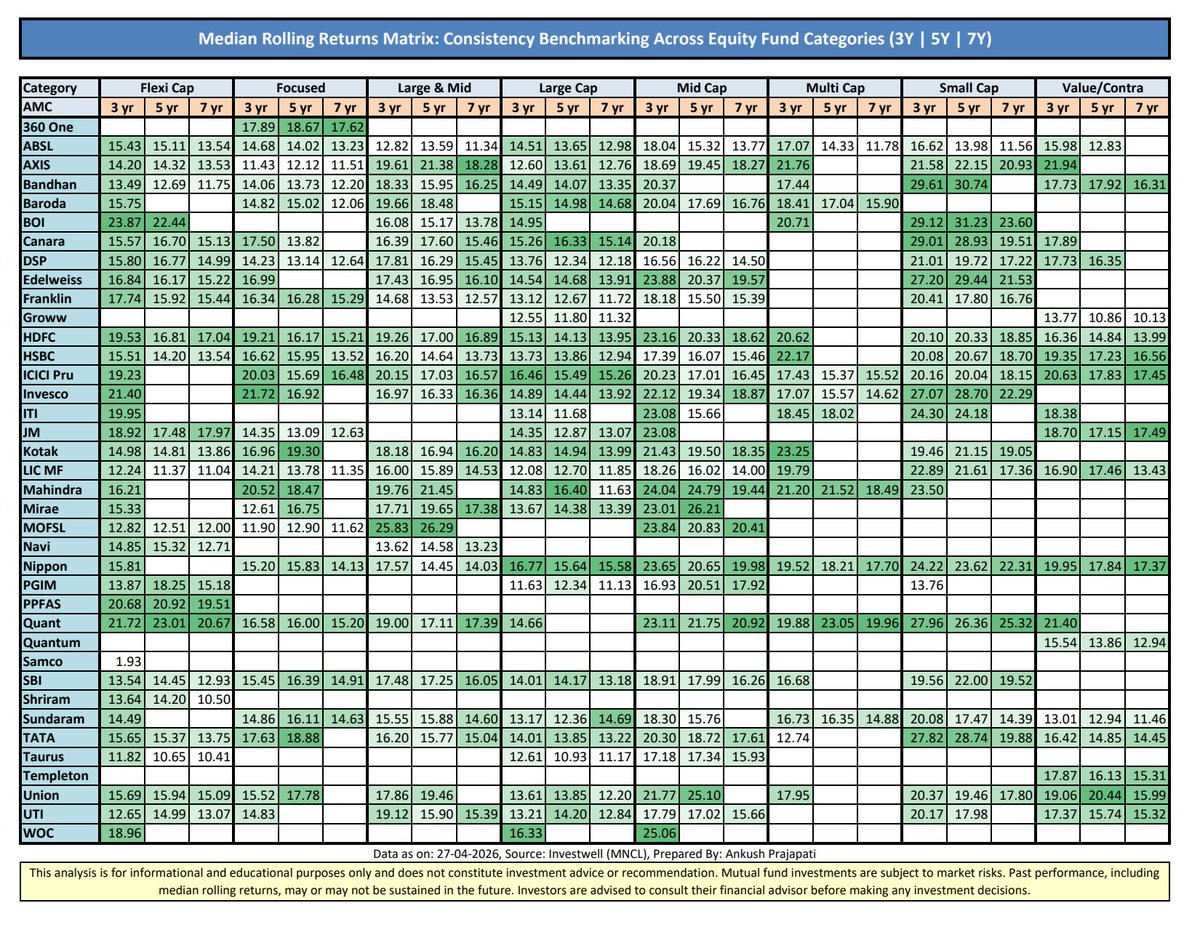
Median Rolling Returns provide a time-tested lens to evaluate consistency by neutralizing entry–exit bias and market cycle distortions.
This matrix highlights funds that demonstrate **sustainable, process-driven performance across 3Y, 5Y, and 7Y horizons**, enabling a more disciplined and data-backed selection framework for long-term portfolios.
Data as on: 27-04-2026
Source: Investwell (MNCL)
Disclaimer: This is for informational purposes only and does not constitute investment advice. Mutual fund investments are subject to market risks. Past performance may not be sustained in the future.
Prepared by: Ankush Prajapati
#MutualFunds #RollingReturns #InvestmentResearch #WealthManagement #PortfolioStrategy
2
1
9
876
Apr 22
Longer Holding Period = Lower Uncertainty
3Y: High dispersion → Small Caps ~53% chances of >20% but ~9% negative
5Y: Stability kicks in → Negatives fade, Mid/Small lead
7Y: Consistency → Return bands tighten
10Y: Predictability → Near-zero downside
Time in market > Timing the market
#MutualFunds #RollingReturns #AssetAllocation #Investing

2
4
39
2,145
Mar 17
This analysis evaluates 3-year rolling returns of active mutual funds through three critical lenses:
• Median → Typical investor experience
• Maximum → Best-case return phase
• Minimum → Worst-case downside phase
Framework Highlights:
• Rolling data period: 01 March 2006 to 15 March 2026
• Captures multiple market cycles including crises and bull phases
• Focuses on return consistency and dispersion, not just point-to-point performance
Key Insight:
Short-term investing (3-year horizon) can deliver widely varying outcomes, reinforcing the importance of time horizon discipline and expectation setting.
PDF available in Telegram Channel: t.me/ MVCmKWU5l6BiYzFl
#MutualFunds #RollingReturns #InvestmentResearch #RiskAnalysis #WealthManagement
1
2
19
1,191
Mar 16
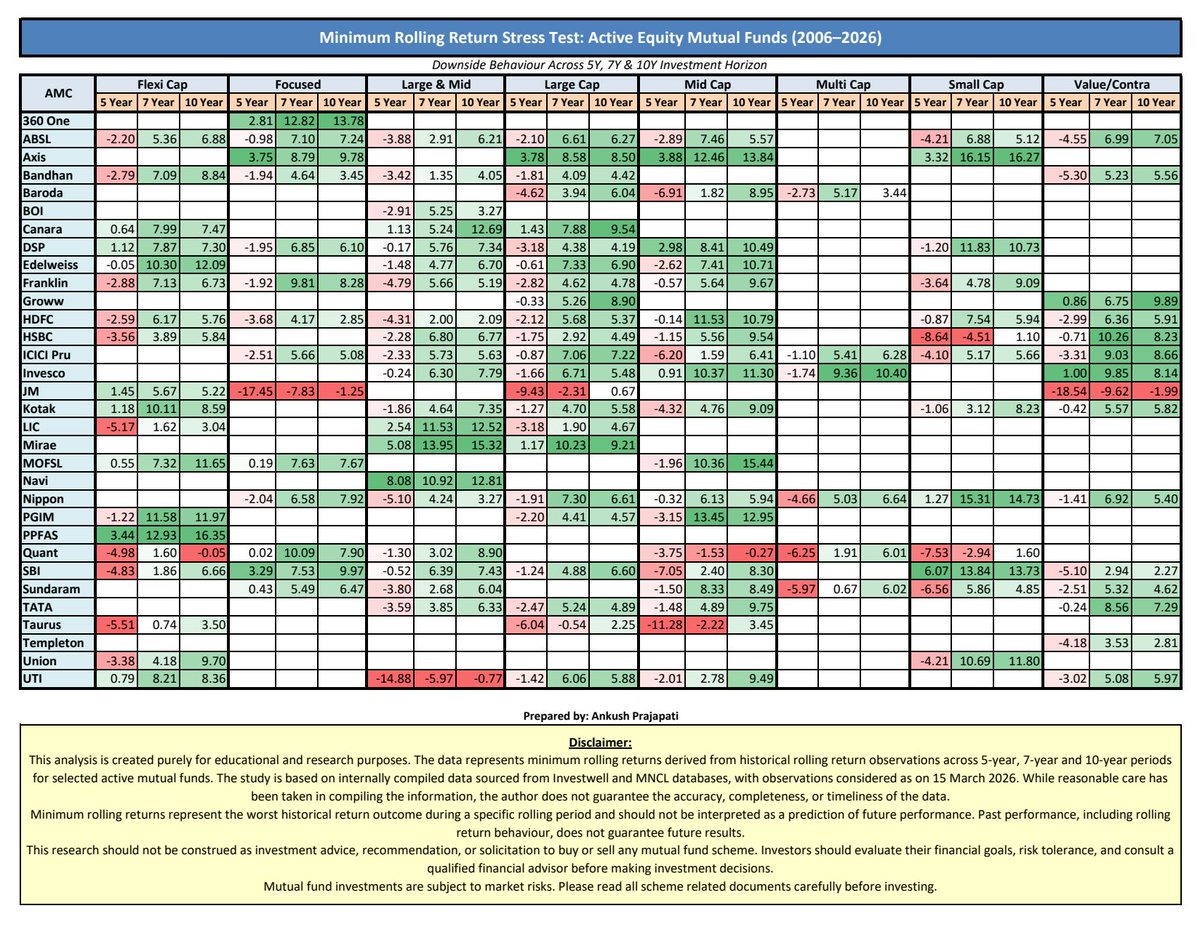
Minimum rolling returns reveal the worst return phase an investor could have experienced during different investment horizons.
This study evaluates minimum rolling returns across 5-year, 7-year, and 10-year rolling periods to understand the downside behaviour of active equity mutual funds across multiple market cycles.
Key framework used in this analysis:
• Only funds with a minimum track record of 10 years have been considered
• Rolling return observations span 01 March 2006 to 15 March 2026
• The objective is to highlight worst-case historical outcomes during different holding periods
Such analysis provides valuable insights into downside risk, volatility experience, and resilience of funds during difficult market phases, enabling investors and advisors to evaluate funds beyond just average or trailing returns.
PDF attached in Telegram Channel: t.me/ MVCmKWU5l6BiYzFl
#MutualFunds #RollingReturns #InvestmentResearch #EquityInvesting #WealthManagement #MFResearch
Prepared by: Ankush Prajapati.
Disclaimer: This analysis is for educational and research purposes only. Past performance does not guarantee future results. This is not investment advice or a recommendation to invest.
1
12
637

Mar 14
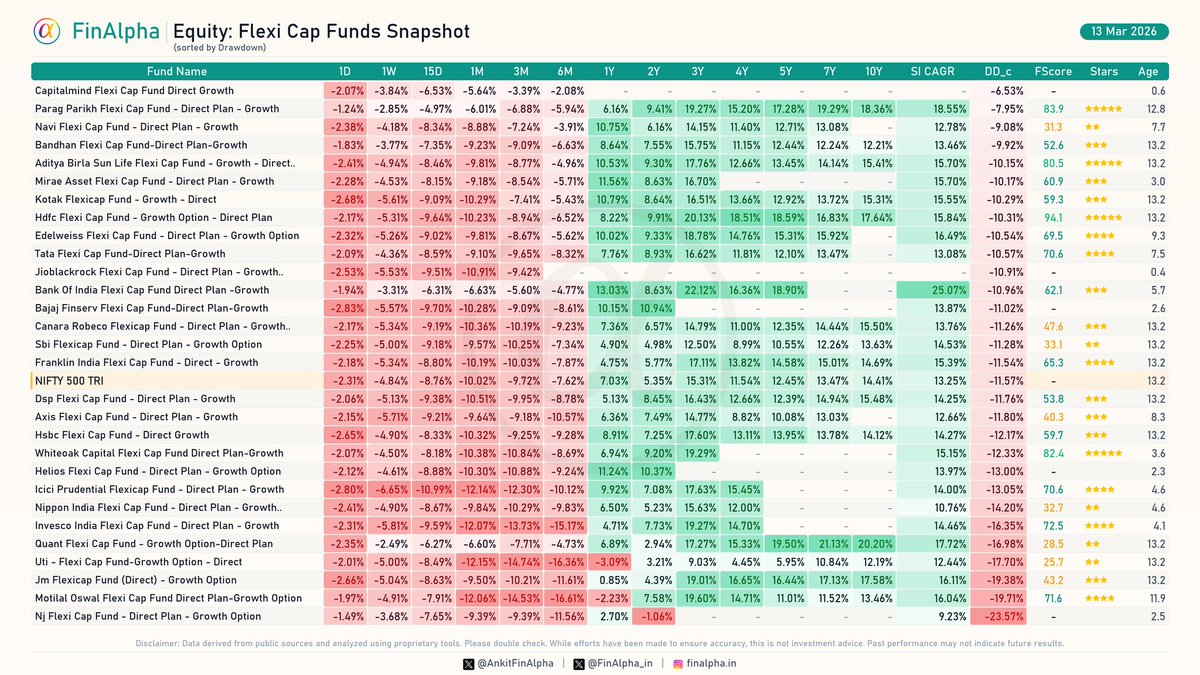
📊 Equity: Flexi Cap Funds Weekly Snapshot | 13 Mar 2026
(Sorted by Current Drawdown)
I've sorted this week's snapshot by current drawdown to highlight the funds (3 years track record) offering the best downside protection right now.
Top Funds by Lowest Drawdown (Age > 3 Years):
🛡️ Parag Parikh Flexi Cap: -7.95%
🛡️ Navi Flexi Cap: -9.08%
🛡️ Bandhan Flexi Cap: -9.92%
For context, the benchmark NIFTY 500 TRI is currently sitting at a drawdown of -11.57%.
💡 Pro Tip: Always use rolling returns to get a better comparison between two funds.
#Flexicap #FinAlpha #FinAlpha1Pager #MutualFunds #PPFAS #Navi #Bandhan #RollingReturns #Nifty500
5
13
74
51,608
Mar 14
📊 Equity: #MidCap Funds Weekly Snapshot | 13 Mar 2026
(Sorted by Current Drawdown)
I've sorted this week's snapshot by current drawdown to highlight the funds (3 years track record) offering the best downside protection right now.
Top Funds by Lowest Drawdown (Age > 3 Years):
🛡️ Nippon India Growth Mid Cap: -8.61%
🛡️ Axis Midcap: -8.76%
🛡️ ICICI Pru Midcap: -8.91%
For context, the benchmark NIFTY Midcap 150 TRI is currently sitting at a drawdown of -10.35%.
💡 Pro Tip: Always use rolling returns to get a better comparison between two funds.
#Midcap #FinAlpha #FinAlpha1Pager #MutualFunds #NipponIndia #Axis #ICICIPru #RollingReturns #NiftyMidcap150

3
4
17
1,163
Mar 14
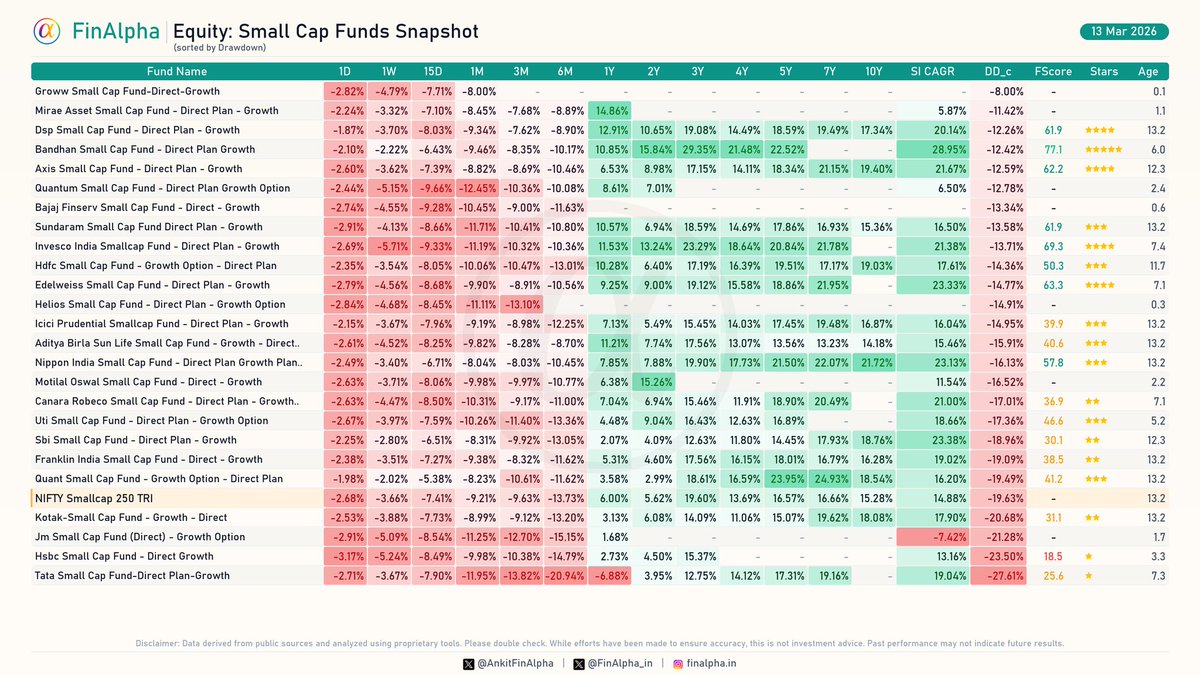
📊 Equity: #SmallCap Funds Weekly Snapshot of Top Funds | Nav: 13 Mar 2026
(Sorted by Current Drawdown)
Small caps continue to face market pressure. We've sorted this week's snapshot by current drawdown to highlight the established funds (3 years track record) showing resilience.
Top Funds by Lowest Drawdown (Age > 3 Years):
🛡️ DSP Small Cap: -12.26%
🛡️ Bandhan Small Cap: -12.42%
🛡️ Axis Small Cap: -12.59%
For context, the benchmark NIFTY Smallcap 250 TRI is currently sitting at a drawdown of -19.63%.
💡 Pro Tip: Always use rolling returns to get a better comparison between two funds.
#SmallCap #FinAlpha #FinAlpha1Pager #MutualFunds #DSP #Bandhan #Axis #RollingReturns #NiftySmallcap250
2
3
21
1,254
Feb 27
Top 5 Mutual Fund Schemes – Rolling Return Consistency Study
In this study, I analysed:
• Top 5 mutual fund schemes
• Multiple rolling periods aligned to ideal investment horizons
• Data from Nov 2017 to Feb 2026
• 10-Year rolling analysis from Nov 2015 onwards
📌 Source: Internal (Investwell, MNCL)
Telegram Channel: t.me/ MVCmKWU5l6BiYzFl
Disclaimer:
This analysis is prepared for educational and research purposes only. Data has been sourced internally from Investwell and MNCL systems. Past performance may or may not be sustained in the future and does not guarantee future returns. The study does not constitute investment advice or a recommendation to buy/sell any scheme. Investors should assess suitability based on their financial goals and risk profile before investing.
#MutualFunds #RollingReturns #WealthManagement #PortfolioConstruction #InvestmentResearch #LongTermInvesting

6
23
132
10,254
Feb 25
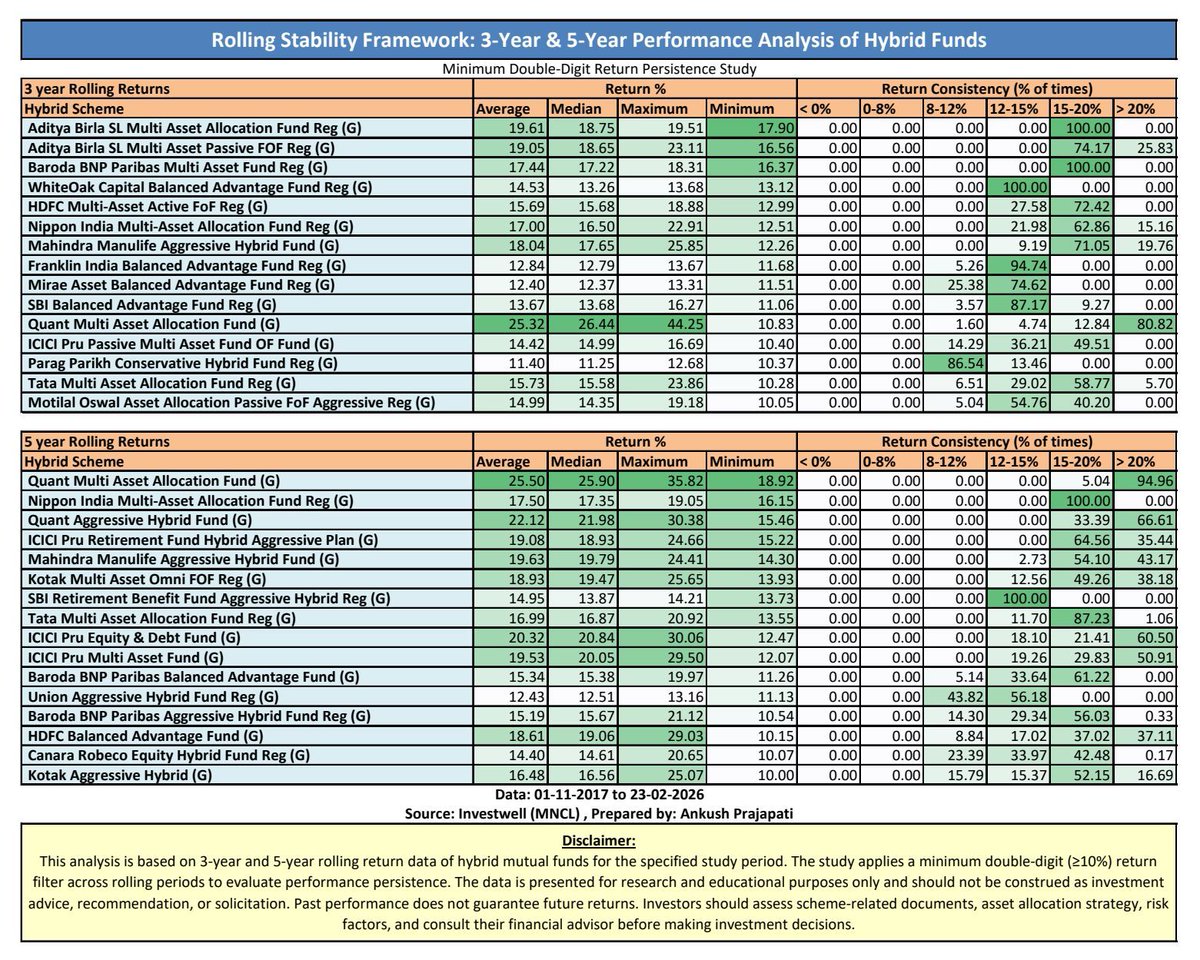
Hybrid Funds: Stability Tested Across Rolling Cycles.
Point-to-point returns can mislead.
Rolling return persistence reveals structural strength.
In this study, I evaluated:
• 3-Year & 5-Year Rolling Returns
• Hybrid Fund Universe (Aggressive, Balanced Advantage, Multi-Asset, Conservative)
• Return consistency across defined return buckets
• Strict filter: Minimum 10% return across rolling periods
Key Observations:
✔ Multi-Asset & Aggressive Hybrid funds demonstrated strong presence in 15–20% and 20% buckets
✔ Select strategies recorded ~90–95% occurrence in the >20% band (5-year rolling)
✔ Balanced Advantage Funds largely concentrated in the 12–15% stability zone
✔ Conservative Hybrid strategies showed disciplined downside control with tight dispersion
This reinforces one critical principle:
Asset allocation moderates risk.
Rolling consistency validates strategy.
Full matrix attached for reference.
Telegram: t.me/ MVCmKWU5l6BiYzFl
Disclaimer: This analysis is based on historical 3-year and 5-year rolling return data and is intended for research and educational purposes only. Past performance does not guarantee future returns. Investors should evaluate scheme-related documents and consult their financial advisor before making investment decisions.
#HybridFunds #RollingReturns #AssetAllocation #MutualFundResearch #WealthManagement
1
7
42
2,861
Feb 24
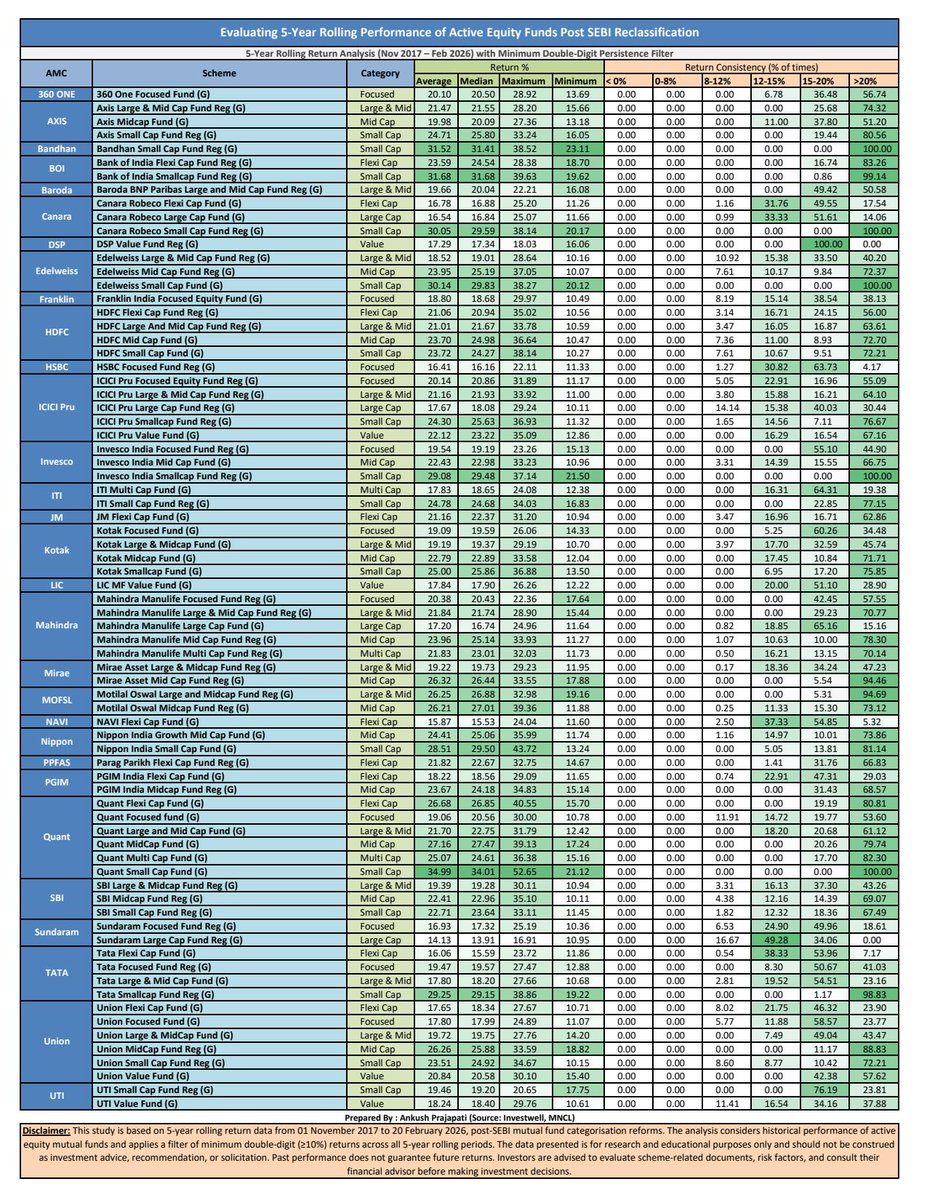
📊 5-Year Rolling Return Study (Post SEBI Categorisation)
Period Covered: Nov 2017 – Feb 2026
Filter Applied: Minimum 10% return across every 5-Year Rolling Period
What the data reveals:
• Small Caps dominated the >20% return frequency bucket
• Midcaps delivered strong double-digit persistence
• Large & Midcaps offered consistency with lower dispersion
• No negative 5-year rolling outcomes in the shortlisted universe
This is not about peak returns.
This is about repeatability across cycles.
Full sheet attached for review.
Telegram: t.me/ MVCmKWU5l6BiYzFl
Disclaimer: Data is historical and for research purposes only. Not investment advice. Past performance does not assure future returns.
#MutualFunds #RollingReturns #EquityInvesting #FundResearch #WealthManagement
2
7
35
2,504
Feb 19
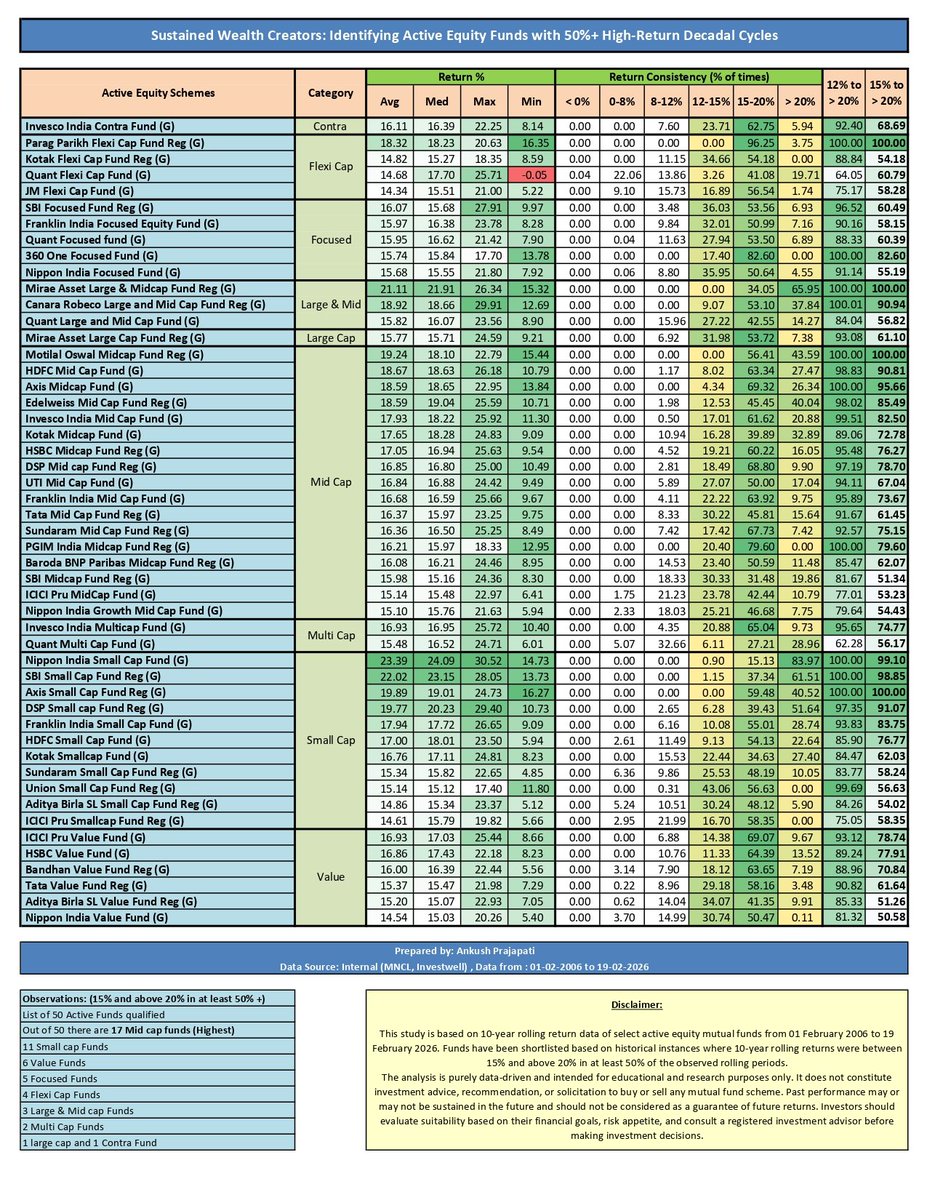
Sustained Wealth Creators: 10-Year Rolling Return Consistency Study (2006–2026)
Instead of chasing point-to-point CAGR, I evaluated performance persistence.
Screening Criteria:
✔ 10-year rolling return analysis
✔ 20-year dataset (Feb 2006 – Feb 2026)
✔ Funds delivering 15% to >20% returns in ≥50% of rolling periods
Outcome:
• 50 Active Equity Funds qualified
• 17 Midcap funds (highest representation)
• 11 Small Cap funds
• 6 Value funds
• 5 Focused funds
• 4 Flexi Cap funds
• Limited representation from Large Cap
Key Insight:
Midcaps and Small Caps dominate long-term high-return probability zones.
Return consistency across decadal cycles is not evenly distributed across categories.
This reinforces a structural reality:
👉 Alpha persistence requires time, volatility tolerance, and disciplined allocation.
Telegram for daily research: t.me/ MVCmKWU5l6BiYzFl
Prepared by: Ankush Prajapati
Disclaimer:
This study is based on historical 10-year rolling return data from 01 February 2006 to 19 February 2026. The analysis is for educational and research purposes only and does not constitute investment advice. Past performance may or may not be sustained in the future.
#MutualFunds #RollingReturns #MidcapFunds #WealthCreation #InvestmentResearch
4
17
68
3,813
Feb 19
📊 Small Cap funds | 1Y rolling returns (start 01 Aug 2024)
Smallcap index topped in Sep 2024 so I ran 1Y rolling returns from 01 Aug 24 across eligible funds.
Data sorted by 1Y LS median returns.
Quick takeaways:
• Top by 1Y LS median: Quantum Small Cap, median ~4.85%. Only ~9% of 1Y LS windows were negative and SIP negatives = 0. SIP median ~10.97%
• Positive LS medians are rare: 10 of 28 funds show a positive 1Y LS median; most funds are negative. Short windows are brutal for smallcaps.
• Big negative medians: Tata, Kotak, Franklin and LIC, roughly -6% to -8%
• SIP vs LS: SIP medians often flip to positive, showing SIPs smooth timing risk even in a short volatile window
• Treat this as a volatility map, not a verdict. One year is too short to judge a funds performance.
#FinAlpha #MutualFunds #FinAlpha1Pager #SmallCap #RollingReturns #SIP #Quantum

2
2
26
1,595
Feb 18
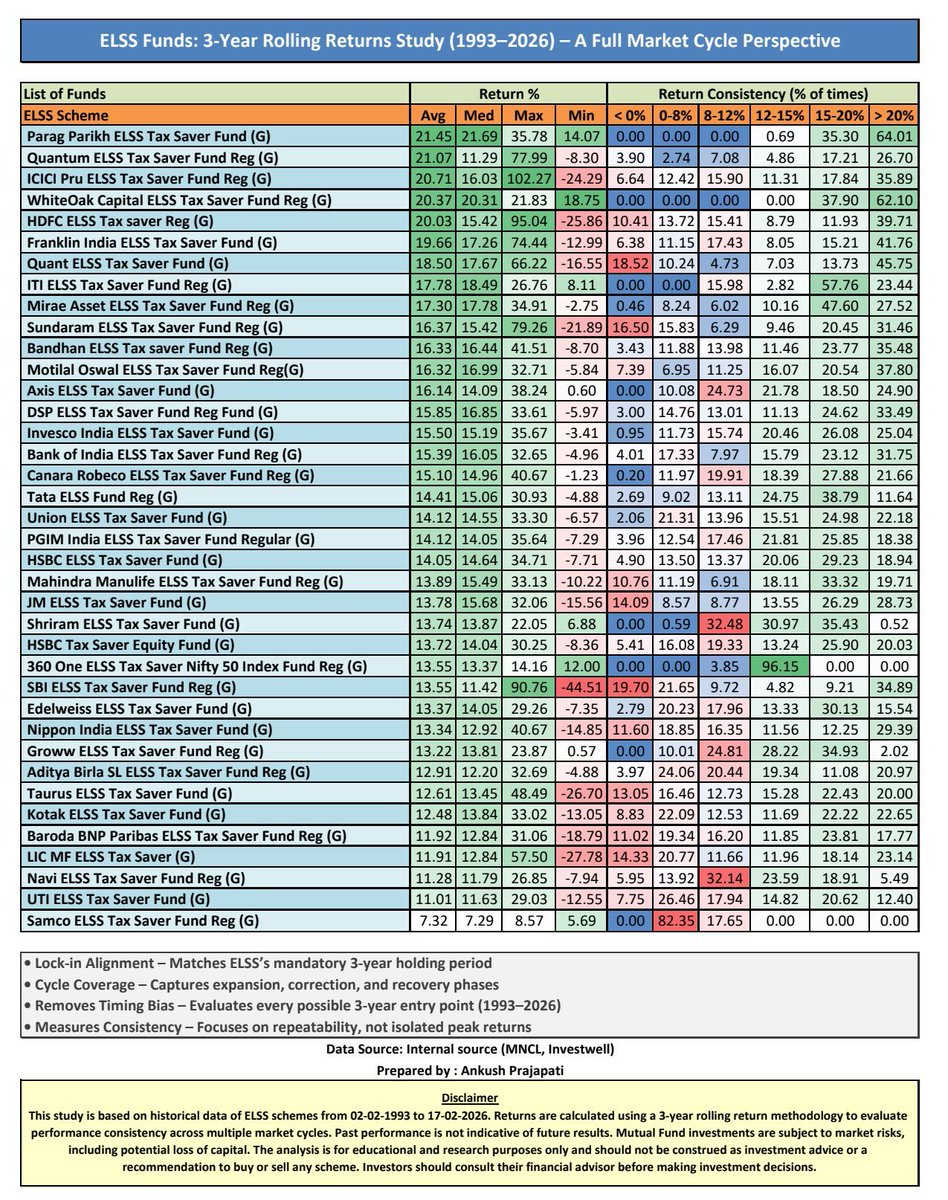
ELSS Funds: 3-Year Rolling Returns Study (1993–2026)
A Probability-Based Evaluation Across Market Cycles
In evaluating ELSS funds, the analytical framework was deliberately anchored to 3-year rolling returns — a structure aligned with both product design and investor behaviour.
Why 3-Year Rolling Returns?
• Lock-in Alignment – Mirrors the statutory 3-year holding period of ELSS
• Cycle Coverage – Captures expansion, correction, and recovery phases
• Eliminates Timing Bias – Evaluates every possible 3-year entry point from 1993 to 2026
• Consistency Lens – Assesses persistence, downside containment, and repeatability
• Behaviourally Relevant – Reflects real-world annual tax-saving investment patterns
Traditional point-to-point CAGR snapshots can distort perception.
Rolling return analytics shift the discussion toward probability, consistency, and risk-adjusted experience.
The objective is not to highlight peaks — but to measure durability.
For detailed research insights and category monitoring:
📌 Telegram: t.me/ MVCmKWU5l6BiYzFl
Disclaimer:
This analysis is based on historical rolling return data from 02-02-1993 to 17-02-2026 and is intended strictly for educational and research purposes. Past performance is not indicative of future results. Mutual Fund investments are subject to market risks, including possible loss of capital. Investors should consult their financial advisor before making investment decisions.
#ELSS #RollingReturns #MutualFundResearch #WealthManagement #TaxPlanning #DataDrivenInvesting
1
3
25
1,481
Feb 16
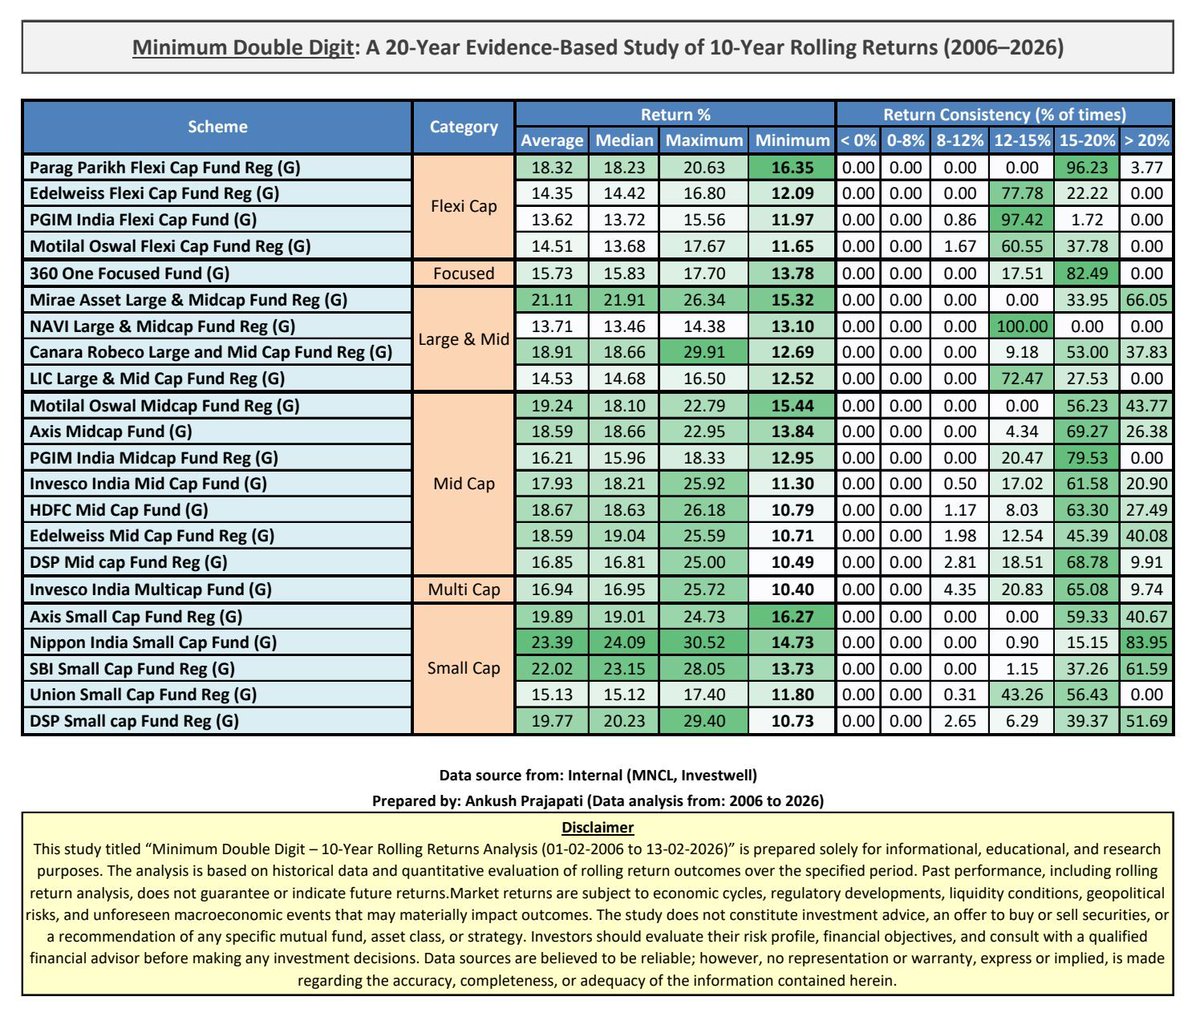
Minimum Double Digit Returns – Evidence Across 20 Years.
We analysed every 10-year rolling window from 01-02-2006 to 13-02-2026 across Flexi Cap, Large & Mid Cap, Mid Cap, Multi Cap, and Small Cap categories.
Key Insights:
• Strong 15–20% consistency in select Small Cap funds
• Structural 12–15% stability in Flexi Cap strategies
• Large & Mid Cap funds displayed controlled dispersion
• No negative 10-year rolling outcomes observed in the dataset
The probability of double-digit returns increases meaningfully with disciplined long-term allocation.
📊 Join Telegram for detailed research notes:
t.me/ MVCmKWU5l6BiYzFl
Disclaimer:
This analysis is based on historical 10-year rolling return data (2006–2026) and is intended for educational and research purposes only. Past performance does not guarantee future returns. This is not investment advice. Please consult a qualified financial advisor before making investment decisions.
#MinimumDoubleDigit #RollingReturns #MutualFundResearch #EquityInvesting #LongTermWealth #DataDrivenInvesting
4
14
54
4,256
Feb 14
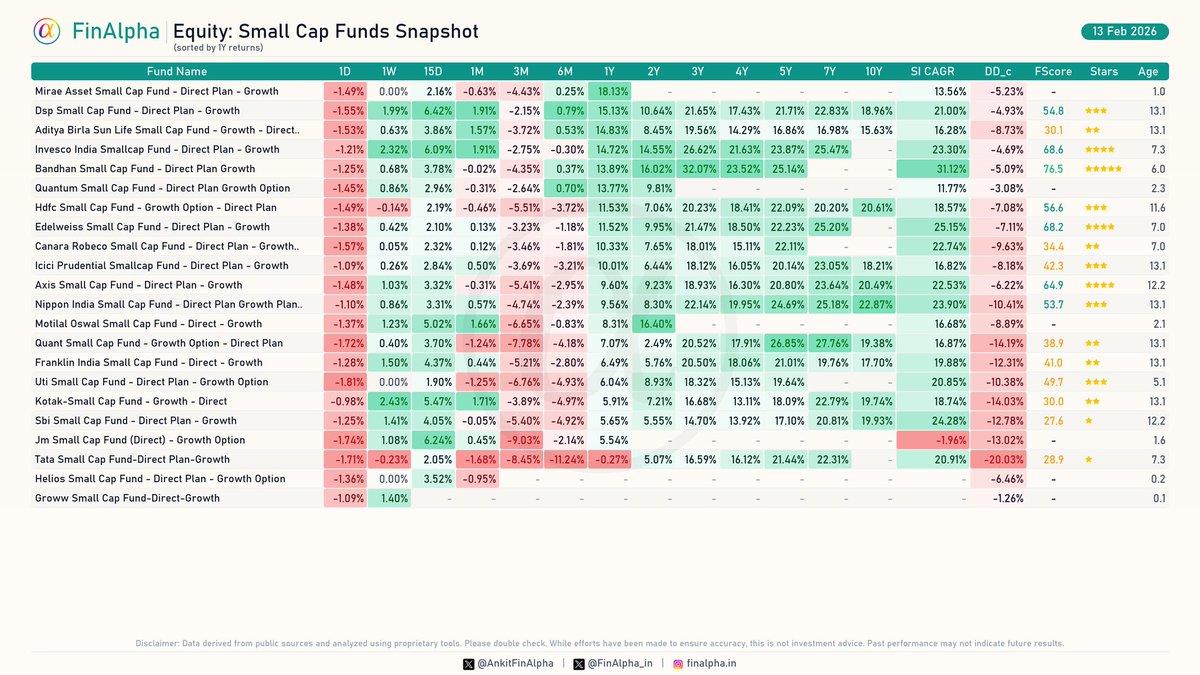
📊 Equity: Small Cap Funds Snapshot | 13 Feb 2026
(Sorted by 1Y Returns)
Short-term volatility (1D) is visible, but the 1-year leaders are holding double-digit gains.
Top 1Y Performers:
🥇 Mirae Asset Small Cap: 18.13%
🥈 DSP Small Cap: 15.13%
🥉 ABSL Small Cap: 14.83%
TATA ,quant and Kotak seems to be worst hit with highest current drawdown
Always use rolling returns to get a better comparison between two funds.
#SmallCap #FinAlpha #FinAlpha1Pager #MutualFunds #MiraeAsset #DSP #ABSL #NipponIndia #Quant #RollingReturns
1
5
12
1,795
Feb 7
📘 Equity Funds That Never Lost Over Any 3-Year Period
A Rolling Return Consistency Study (Data as on 06-02-2026)
This analysis identifies equity mutual fund schemes that maintained non-negative returns across every observed 3-year rolling window, cutting across market cycles, volatility regimes, and drawdown phases.
Download the full PDF here:
t.me/ MVCmKWU5l6BiYzFl
⚠️ This is a research study, not an investment recommendation. Mutual fund investments are subject to market risks.
#EquityMutualFunds #RollingReturns #RiskManagement #InvestmentResearch #WealthManagement

12
15
131
11,034