
FPIs sold a net Rs 29,000 crore from Indian equities in May 2026.
18 of 23 sectors saw net selling.
But five sectors attracted net FPI buying. Three of them are significant.
Services: approximately Rs 6,380 crore net inflow
Metals and Mining: approximately Rs 5,960 crore net inflow
Capital Goods: approximately Rs 2,480 crore net inflow
Financial Services bore 70% of total outflows: Rs 20,500 crore sold. This is almost entirely MSCI passive rebalancing as India's index weight fell, mechanically forcing index funds to reduce BFSI holdings.
The selective buying is signal.
Services: global confidence in India's engineering and business services export story. Not generic IT. Specific higher-value services.
Metals and Mining: commodity demand from global AI infrastructure build-out. Data centres consume enormous copper and aluminium.
Capital Goods: L&T, BEL, Siemens India. Government-led infrastructure capex is generating earnings visibility that global investors are willing to pay for.
FPIs are not uniformly negative on India. They are exiting MSCI-driven BFSI exposure and selectively adding to commodity and infrastructure themes.
Equity Research India
#FPI #IndianMarkets #EquityResearch #IndiaInvesting #Metals #CapitalGoods #Services #NSE #StockMarket #PersonalFinance #WealthManagement #SectorAnalysis #BFSI
4

Different sectors perform differently across market cycles. Understanding industry trends can help investors identify long-term opportunities. unlistedideas.com
#SectorAnalysis #Investing #StockMarket #MarketResearch #UnlistedIdeas
1

10h
The market just got 11 new ways to track India's growth story. 👀📊
NSE has introduced 11 new sectoral indices, expanded its sectoral universe and offering broader market representation across industries such as power, insurance, telecom, retail, healthcare, housing finance, and more.
⚠️ This content is intended for educational and informational purposes only and should not be construed as investment advice, research recommendations, or a recommendation to buy or sell any security. Investments in securities markets are subject to market risks.
#NSE #StockMarketIndia #MarketInsights #InvestorAwareness #Bigul
[SectoralIndices, NSEUpdate, MarketInsights, SectorAnalysis, InvestorEducation]

20

PEB SECTOR ANALYSIS | PART 1/6 THE MEGA SHIFT & TAM ANALYSIS 🏗️
THE BIG MACRO PICTURE
भारत में इस समय इंडस्ट्रियल कंस्ट्रक्शन और इन्फ्रास्ट्रक्चर डेवलपमेंट के क्षेत्र में एक बहुत ही पावरफुल शिफ्ट देखने को मिल रहा है। आज से कुछ साल पहले तक अगर किसी बड़ी कंपनी को अपनी मैन्युफैक्चरिंग यूनिट, ऑटोमोबाइल प्लांट या विशाल वेयरहाउस खड़ा करना होता था, तो वे ट्रेडिशनल कंस्ट्रक्शन, ईंट और सीमेंट वाले पुराने तरीकों पर निर्भर रहते थे। इस पुराने कंस्ट्रक्शन में सबसे बड़ी समस्या समय की बर्बादी, लेबर मैनेजमेंट की चुनौतियाँ और मौसम के कारण प्रोजेक्ट्स का रुकना थी। लेकिन आज स्पीड और एफिशिएंसी की मांग के कारण पूरी तस्वीर बदल चुकी है। भारत में इस समय प्री-इंजीनियर्ड बिल्डिंग्स यानी PEB तकनीक की तरफ एक बहुत बड़ा वैल्यू माइग्रेशन हो रहा है। केंद्र सरकार की पीएम गति शक्ति पॉलिसी, देश के कोने-कोने को जोड़ने वाले नए एक्सप्रेसवे, क्विक-कॉमर्स और ई-कॉमर्स का भयंकर लॉजिस्टिक्स नेटवर्क, और सबसे बढ़कर बड़े-बड़े टेक जाइंट्स द्वारा भारत में स्थापित किए जा रहे एआई डेटा सेंटर्स ने इस पूरे सेक्टर की डिमांड को रॉकेट बना दिया है। आज कंपनियां ऐसे स्ट्रक्चर्स चाहती हैं जो पूरी तरह से कस्टमाइज्ड हों और जिन्हें बिना किसी मटीरियल वेस्टेज के हफ़्तों के भीतर खड़ा किया जा सके।
TOTAL ADDRESSABLE MARKET
इस पूरे बूम को अगर हम नंबर्स और मार्केट साइज के नजरिए से समझें, तो इसके पीछे का आर्थिक गणित और भी ज्यादा आकर्षक नजर आता है। ताज़ा डेटा के अनुसार, भारतीय PEB मार्केट का कुल आकार यानी टोटल एड्रेसेबल मार्केट इस समय लगभग 25,000 करोड़ से 30,000 करोड़ रुपये के आंकड़े को पार कर चुका है। सबसे महत्वपूर्ण बात यह है कि यह कोई धीमा या मैच्योर बाजार नहीं है, बल्कि यह पूरा सेक्टर सालाना 9.5% से 10% की बेहद आक्रामक कंपाउंडेड ग्रोथ रफ्तार से आगे बढ़ रहा है। विकास की यह गति चीन और अन्य विकसित देशों के मुकाबले बहुत ज्यादा है। डिमांड का आलम यह है कि देश के जितने भी बड़े ऑर्गनाइज्ड डेवलपर्स हैं, उनके पास अगले बारह से अठारह महीनों की एडवांस विज़िबिलिटी और बुकिंग्स पहले से मौजूद हैं। यह डेटा साफ़ दिखाता है कि आने वाले पांच से दस सालों में भारत का इंडस्ट्रियल और कमर्शियल इन्फ्रास्ट्रक्चर पूरी तरह से स्टील-बेस्ड स्ट्रक्चर्स की तरफ शिफ्ट होने जा रहा है, जो इस सेक्टर की कंपनियों के लिए एक बहुत लंबा और रनवे तैयार करता है। #PEBSector #Sectoranalysis

3
5
59

Jun 17
Cement Sector Boom Ahead? Top Cement Stocks Ranked
🔴 Want to watch the complete "cement sector" analysis?
The full video is available on Sarmaaya Skool
👉 JOIN SARMAAYA SKOOL NOW:
📌 skool.com/sarmaayaskool/abou…
👉 Watch Complete “Cement Sector” analysis:
📌 skool.com/sarmaayaskool/clas…
👉 Explore Sarmaaya’s Score feature:
📌 sarmaaya.pk/stocks/sarmaaya-…
Could Pakistan's cement sector be entering a new growth phase?
In this short clip, we discuss how government infrastructure spending, housing initiatives, REIT growth, and construction financing could impact cement demand in Pakistan. We also look at cement sector rankings, stock selection approaches, and why companies like Lucky Cement, DGKC, Thatta Cement, and Power Cement remain on investors' watchlists.
What you'll learn:
✅ How infrastructure spending can affect cement demand
✅ Why housing and construction activity matter for cement stocks
✅ The role of REITs in supporting the sector
✅ Lucky Cement's long-term investment case
✅ Cement stock rankings and investment screening
This is only a short clip from a much more detailed lesson available on Sarmaaya Skool.
▶️ Watch the full video now on Sarmaaya Skool
💬 Which cement stock do you think has the strongest potential? Let us know in the comments.
#sarmaayaskool #psx #cementstocks #cementsector #sectoranalysis #luckycement #cement #pakistanstockmarket
5
617
P/E can be engineered through depreciation choices and tax treatment.
P/B can be distorted by asset write-downs and accounting elections.
Price-to-Sales cannot be manipulated. Revenue is revenue.
This makes P/S the cleanest cross-sector valuation tool, particularly when earnings are under pressure and P/E readings are distorted.
Where Nifty 50 sectors stand on P/S today versus historical context:
IT services: approximately 3.5 to 4.5x. Below the 5 to 6x seen at the 2022 peak. The discount reflects US client spending caution, not fundamental business deterioration.
FMCG: approximately 6 to 8x. Near historical premium. Pricing power justifies the multiple but leaves limited margin of safety.
Pharmaceuticals: approximately 3 to 4x. Broadly in line with history.
Energy: approximately 0.8 to 1.2x. Capital intensity and thin margins make low P/S structurally appropriate.
Auto: approximately 0.8 to 1.5x. Near fair value historically.
Consumer discretionary: approximately 2 to 4x. Wide range reflecting quality dispersion within the category.
The P/S signal confirms what other metrics show: IT is the one Nifty 50 sector where current valuation is meaningfully below its own recent history on a revenue multiple basis.
#Nifty50 #PriceToSales #Valuation #IndianMarkets #EquityResearch #IndiaInvesting #ITSector #FMCG #StockMarket #NSE #PersonalFinance #WealthManagement #SectorAnalysis
16

Jun 17
🚨 SCREENSHOT THIS POST NOW.
By market close, one of two things will happen:
Either today's sentiment roadmap will be completely wrong...
Or traders who ignored it will spend the evening asking, "Why didn't I see that coming?"
The biggest market moves always look obvious...
After they've happened.
The smart money doesn't get paid for hindsight.
They get paid for preparation.
And today's market is approaching a zone where sentiment, timing, and sector leadership are converging.
👇
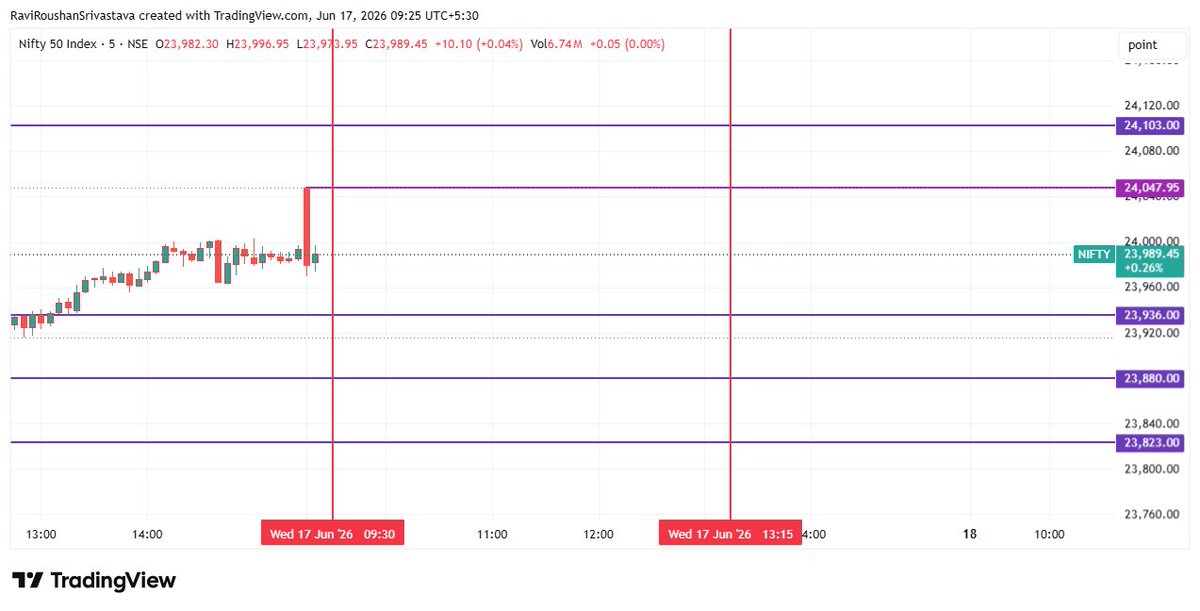
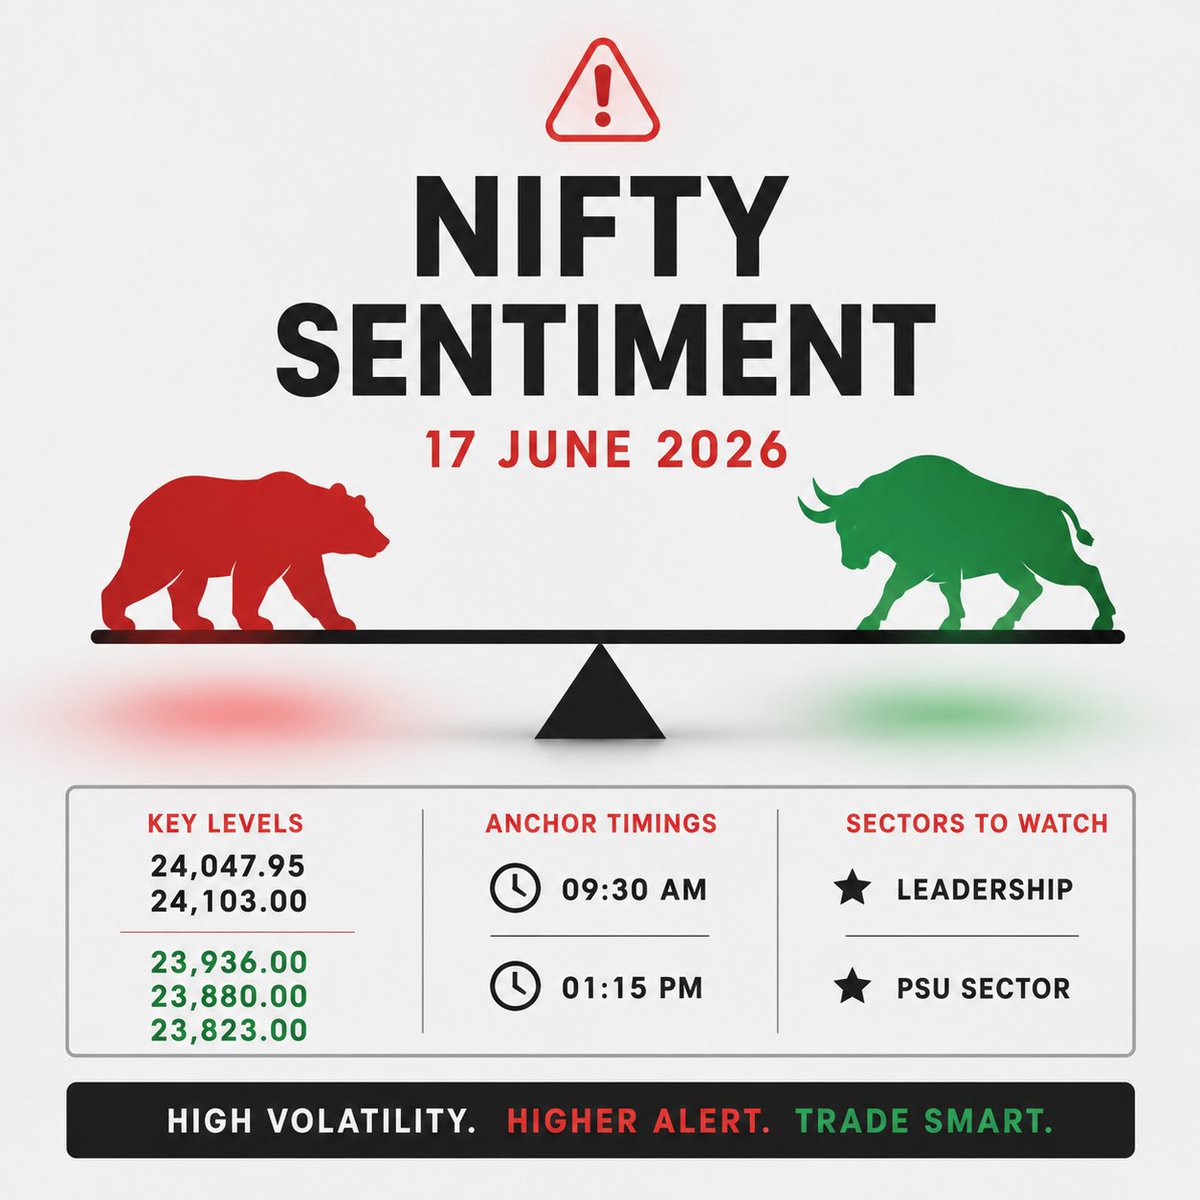
📊 NIFTY SENTIMENT ALERT | 17 JUNE 2026
The market is entering a high-risk decision zone.
While the crowd focuses on price, the underlying sentiment suggests a session where emotions could change much faster than expectations.
🎯 Key Levels
🔴 Resistance
• 24,047.95
• 24,103.00
🟢 Support
• 23,936.00
• 23,880.00
• 23,823.00
⏰ Critical Anchor Timings
🕤 09:30 AM IST
🕐 01:15 PM IST
These are the windows where today's true direction is most likely to reveal itself.
📈 Market Sentiment
⚠️ Cautiously Bearish
⚡ High Volatility Expected
🎯 Elevated Trap Risk
🔥 Potential for Explosive Expansion
🏆 Sectoral Spotlight
Today's leadership is expected from:
✅ Leadership Stocks
✅ PSU Sector
These sectors are showing the highest probability of influencing the broader market direction.
📌 What Matters Most
The market is currently at a point where traders may confuse movement with conviction.
Historically, these are the sessions where patience outperforms prediction.
The next major move may not begin with a breakout.
It may begin with a trap.
💬 Comment "SENTIMENT" if you're tracking market psychology more than indicators.
🔄 Repost this before the second anchor timing and let's revisit it after market close.
📌 Follow @RaviRoushanSrivastava for daily NIFTY Sentiment Analysis,
Time & Price Research, Sector Rotation Insights, and Institutional Market Behaviour.
#Nifty50 #NiftyAnalysis #MarketSentiment #StockMarketIndia #NiftyPrediction #IntradayTrading #OptionsTrading #PriceActionTrading #TechnicalAnalysis #TradingPsychology #MarketTiming #NSEIndia #PSUStocks #SectorAnalysis #SmartMoney #VolatilityTrading #IndianStockMarket #DayTrading #SwingTrading #MarketStructure #TraderLife #MarketOutlook #FinancialMarkets #TradingCommunity #NiftyToday #BankNifty #TimeAndPrice #MarketUpdate #StockMarketNews #StockTrader
The crowd reacts to news. Professionals react to shifts in sentiment. 📈⏳🔥
1
2
96

Jun 16
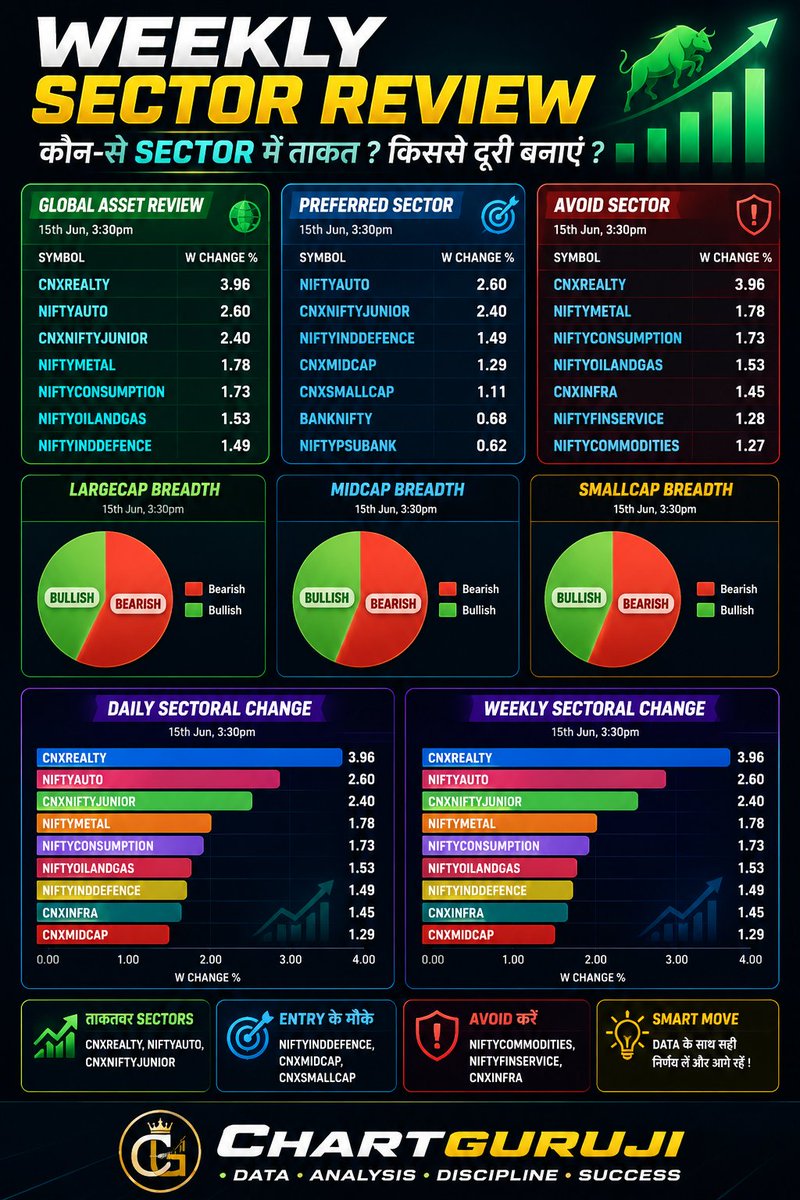
📊 क्या आप भी हर हफ्ते जानना चाहते हैं कि कौन-से सेक्टर सबसे मजबूत हैं और किन सेक्टर्स से फिलहाल दूरी बनाकर रखनी चाहिए?
अब अंदाज़े नहीं, सिर्फ़ डेटा के आधार पर फैसले लें! 🚀
✅ कौन-से सेक्टर में सबसे ज्यादा ताकत है?
✅ कहाँ नई एंट्री के मौके बन रहे हैं?
✅ किन सेक्टर्स को अभी अवॉइड करना बेहतर है?
✅ पूरा Weekly Sector Analysis एक ही Dashboard में!
मैं हर हफ्ते Sector Rotation और Market Strength को ट्रैक करता हूँ, ताकि आपको पता चल सके कि Smart Money किस दिशा में जा रही है। 📈
अगर आप भी यह Exclusive Weekly Sector Dashboard पाना चाहते हैं, तो:
👉 मुझे Follow करें
👉 Comment में लिखें #WeeklySector
मैं आपको Dashboard का लिंक भेज दूँगा।
सही सेक्टर चुनिए, सही समय पर एंट्री लीजिए और अपने ट्रेडिंग फैसलों को और बेहतर बनाइए। 💯
#WeeklySector #StockMarketIndia #Nifty #SectorAnalysis #SectorRotation #Trading #Investing #Chartink #SwingTrading #ChartGuruji
35

Jun 15
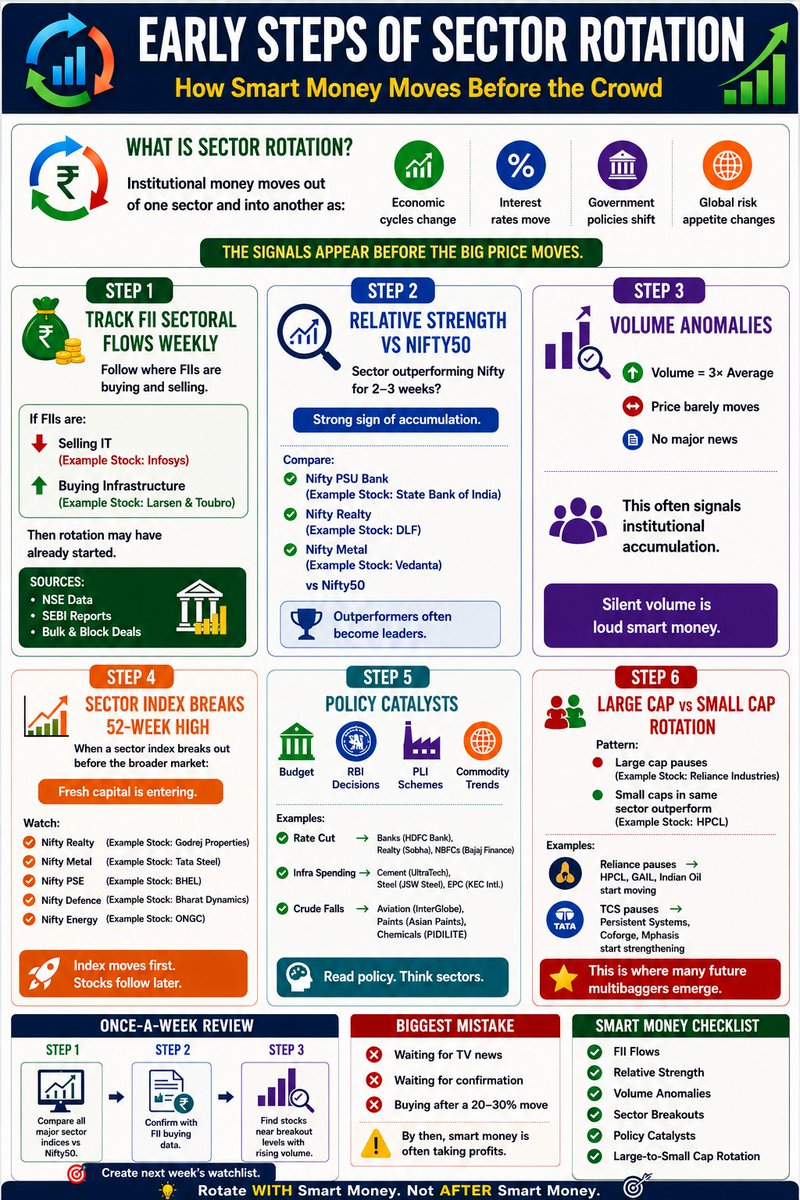
🚀 SMART MONEY CHECKLIST
✅ FII Flows
✅ Relative Strength
✅ Volume Anomalies
✅ Sector Breakouts
✅ Policy Catalysts
✅ Large-to-Small Cap Rotation
Rotate WITH Smart Money.
Not AFTER Smart Money.
The biggest mistake in the markets? ❌ Waiting for TV news confirmation. By the time a sector jumps 20-30%, institutions are already taking profits.
Train your eyes to spot index breakouts and policy catalysts early. Rotate WITH smart money, not after it. ⏱️💼
#SectorRotation
#SmartMoney
#InstitutionalMoney
#FIIFlows
#RelativeStrength
#VolumeAnalysis
#MarketBreadth
#SectorAnalysis
#Nifty50
#NSEIndia
#IndianStockMarket
#SwingTrading
#MomentumInvesting
#BreakoutStocks
#StockMarketIndia
#InvestingIndia
#WealthCreation
#MultibaggerStocks
#StockSelection
#MarketCycles
#StockMarketTips #IndianStockMarket #WealthCreation
12
39
2,329


#SRSULTIMA #SectorRotation #SectorAnalysis #OutperformStocks #LeadingSectors
Sector Rotation Analysis 14-06-2026
youtu.be/IFVYuSwEdY4
71
Crude oil is now driving the Indian market more than any other single variable.
Here is a practical cheat sheet for your portfolio.
Every $10 fall in crude oil:
Reduces India's annual import bill by approximately Rs 85,000 crore
Improves current account deficit by 0.3 to 0.4% of GDP
Reduces CPI inflation by approximately 30 basis points
Increases RBI's room on monetary policy
Winners across Nifty 50 sectors:
Aviation: ATF is 30 to 40% of operating costs. IndiGo is the most direct beneficiary.
Paints: 40% petrochemical input exposure. Asian Paints and Berger Paints see margin expansion.
OMCs: BPCL, HPCL, IOC marketing margins recover.
Tyres: Synthetic rubber from crude. Apollo, MRF, CEAT benefit.
FMCG: Packaging and freight cost relief.
Private banks: Lower inflation improves rate outlook and NIM trajectory.
The one clear loser:
ONGC loses approximately Rs 6,180 crore in annual earnings per $1 crude fall.
Every time a crude headline appears, run it through this map before deciding what it means for your portfolio.
#CrudeOil #Nifty50 #IndianMarkets #EquityResearch #IndiaInvesting #ONGC #IndiGo #AsianPaints #OMC #PersonalFinance #WealthManagement #SectorAnalysis #Inflation
44

Jun 14
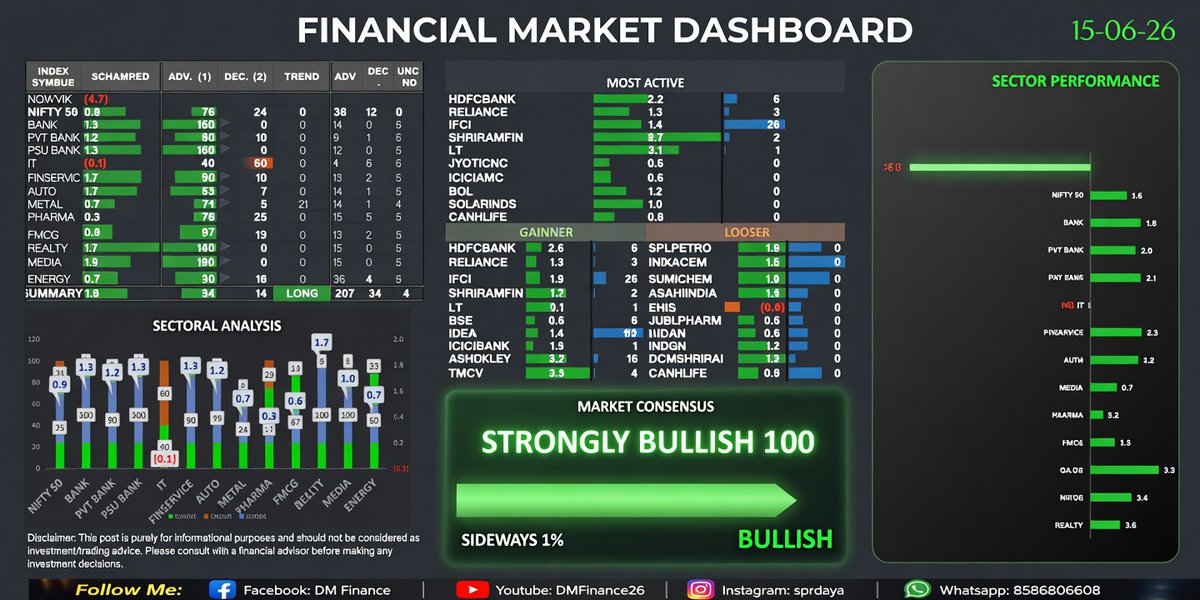
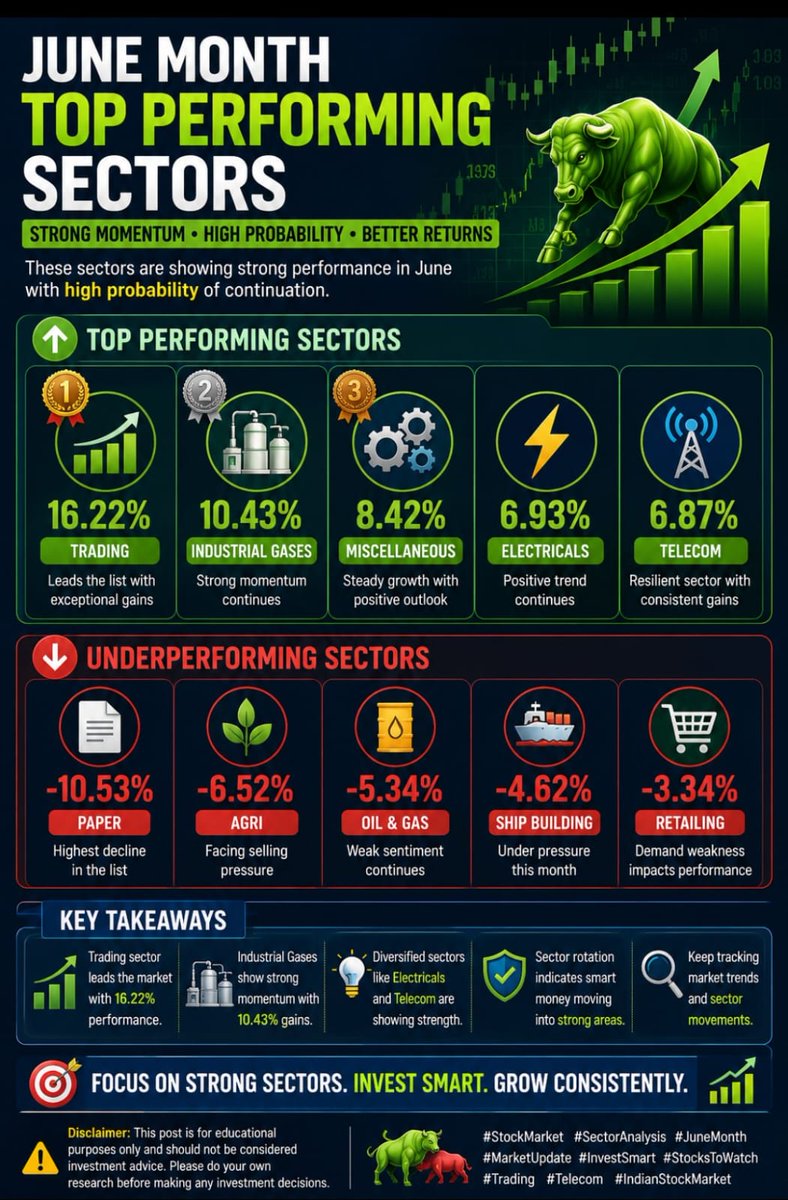
📊 JUNE MONTH TOP PERFORMING SECTORS 📊
June has highlighted some clear sector leaders, with Trading and Industrial Gases emerging as the strongest-performing segments of the market.
🚀 Top Performing Sectors:
🥇 Trading – 16.22%
🥈 Industrial Gases – 10.43%
🥉 Miscellaneous – 8.42%
📈 Electricals – 6.93%
📈 Telecom – 6.87%
⚠️ Underperforming Sectors:
🔻 Paper – -10.53%
🔻 Agri – -6.52%
🔻 Oil & Gas – -5.34%
🔻 Ship Building – -4.62%
🔻 Retailing – -3.34%
📌 Key Takeaways:
✅ Trading sector leads the market with exceptional gains
✅ Industrial Gases continue to show strong momentum
✅ Electrical and Telecom sectors remain resilient
✅ Paper and Agri sectors witnessed the sharpest decline
✅ Sector rotation remains a key theme in June
📈 Investors are closely tracking sector-wise performance to identify emerging opportunities and market trends.
⚠️ Disclaimer: This information is for educational purposes only and should not be considered investment advice. Please do your own research before making investment decisions.
#StockMarket #SectorAnalysis #JuneStocks #TradingSector #IndustrialGases #Telecom #Electricals #MarketUpdate #IndianStockMarket #Investing #ShareMarket #StocksToWatch 📊🚀
10
533

Jun 13
📊 Weekly Relative Strength Ranking Report
Multiple Time Frame Relative Strength Trend Structure Momentum Analysis
Every week, I rank sectors, themes, factors, and market-cap indices to identify where leadership is emerging in the market.
🎯 Use the strongest groups to build your watchlist and then apply your own trading or investing system.
This Week's Ranking:
MICROCAP250
HighBeta 50
SMLCAP 50
MS Fin Serv
MID SELECT
Capital Mkt
Mid Liq 15
SMLCAP 250
MidSml Hlth
EV
Waves
SMLCAP 100
Media
Midcap 50
MIDSML 400
500 EW
Alpha 50
500 Health
Ind Defence
InfraLog
MIDCAP 100
Chemicals
MNC
500 LMS Eql
HEALTHCARE
MIDCAP 150
Housing
INDIA MFG
Sml250MQ 100
Pharma
M150Momntm50
Multi Mfg
500Momentm50
TMMQ 50
500 MULTICAP
FinSerExBnk
200 Alpha 30
Infra
Auto
Next 50
Multi Infra
LARGEMID250
Corp MAATR
SME Emerge
M150 QLTY50
500 Value 50
Multi MQ 50
Energy
GS 15YrPlus
MS IT Telcm
500 Qlty50
50 EQL Wgt
200
200 Value 30
Commodities
Metal
500 MQVLv50
500 Flexicap
500 LowVol50
📌 Strong Stocks → Strong Sectors → Strong Themes
The objective is not to predict the market. The objective is to identify where the market is rewarding investors right now.
Focus on leadership. Build your watchlist. Then apply your own system.
⚠️ For educational purposes only. Not a buy/sell recommendation.
— Nishesh Jani, CFTe
#RelativeStrength #SectorRotation #MomentumInvesting #StockMarketIndia #TechnicalAnalysis #SwingTrading #TrendFollowing #MarketLeadership #VGM #AlphaWithNishesh #CFTe #StockSelection #MomentumStocks #Investing #TradingCommunity #WealthCreation #MarketResearch #SectorAnalysis #IndianStockMarket
1
219

Jun 12
Don't guess: know the right KPIs per sector - banks need loans/deposits, retail same-store sales, tech R&D vs margins. Learn benchmarks now.
Read more: stockalpha.ai/alpha-learning…
#Investing #Fundamentals #SectorAnalysis

5

Before you buy your next stock, stop and look at the umbrella over it.
A fundamentally strong company can still drown if it’s trapped in a dying industry. On the flip side, even average companies can catch massive tailwinds if they operate in a booming "sunrise industry".
In our latest video, we break down exactly how to conduct a thorough sector & industry analysis. We dive deep into:
#SectorAnalysis #InvestmentStrategy #StockMarketInsights #IndustryTrends #FinancialLiteracy #ShareMarket
1
6
340

May 25
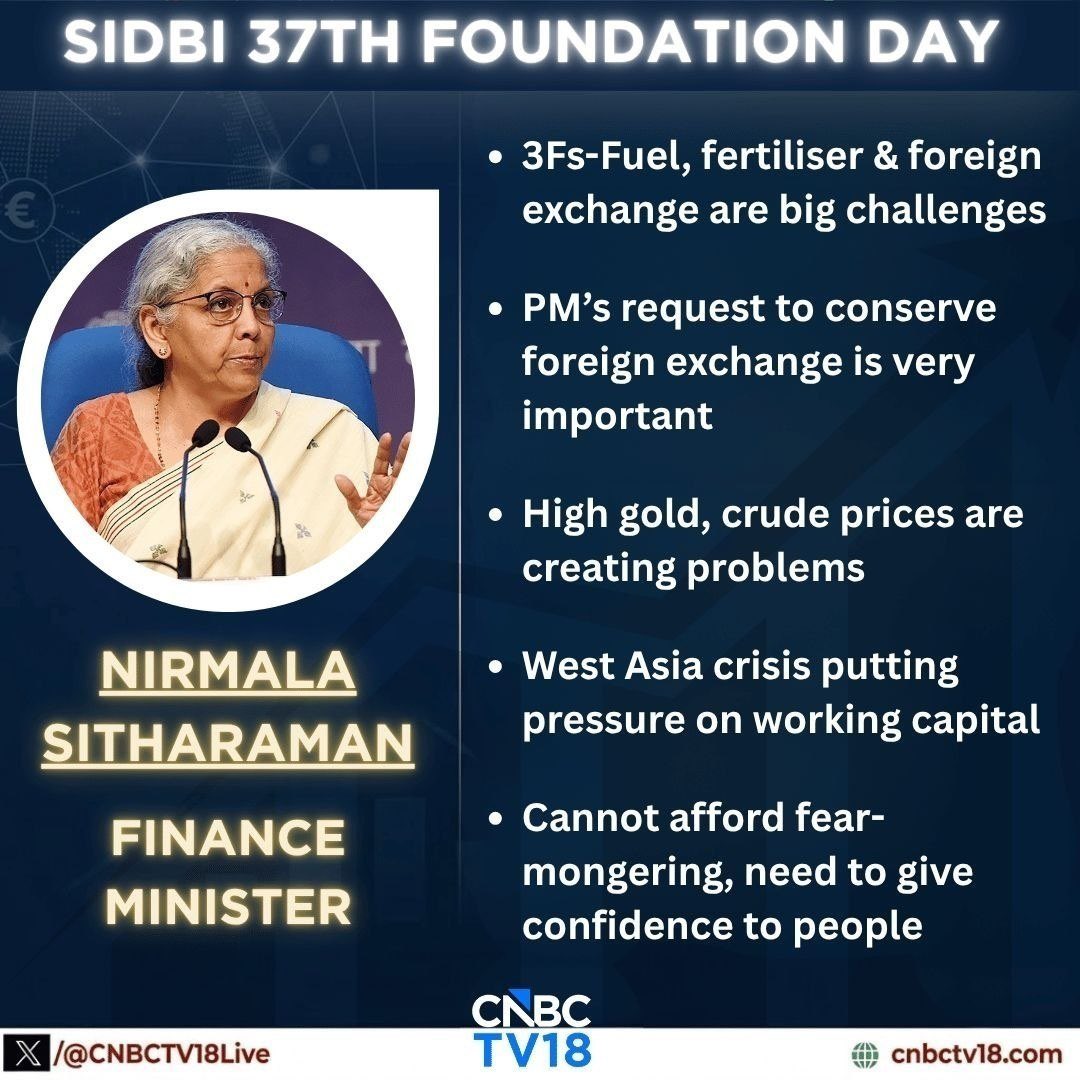
📢 FM Nirmala Sitharaman Highlights Key Economic Challenges 🇮🇳
⛽ Fuel 🌾 Fertiliser 💵 Foreign Exchange are currently the biggest challenges for the economy.
🔹 PM’s request to conserve foreign exchange is very important
🔹 High Gold 🟡 and Crude Oil 🛢 prices are creating pressure
🔹 West Asia crisis is impacting working capital
🔹 Need to avoid fear-mongering and maintain confidence
━━━━━━━━━━━━━━
📊 Sector Impact View
🟢 Potential Beneficiaries
⛽ Oil Exploration: ONGC, Oil India
➡️ Higher crude can support earnings 📈
🛡 Defence: HAL, BEL, BDL, Mazagon Dock
➡️ Geopolitical tensions may support order flow 🚀
🚢 Shipping: SCI, GE Shipping
➡️ Freight rates may improve ⚓
🌾 Fertiliser Theme: Coromandel, Chambal Fertilisers, GSFC, RCF, NFL, Deepak Fertilisers
➡️ Higher fertiliser demand may support the sector 🌱
🥇 Gold Theme
➡️ Safe haven demand can increase 💰
━━━━━━━━━━━━━━
🔴 Sectors Under Pressure
✈️ Aviation: Indigo, SpiceJet
🎨 Paint: Asian Paints, Berger
🧪 Chemicals: SRF, Deepak Nitrite
🚗 Auto: Maruti, Tata Motors
🏭 Cement
━━━━━━━━━━━━━━
🚨 High Risk Zone
🔺 Aviation
🔺 Chemicals
🔺 Paint
🔺 Import dependent businesses
🔺 High input-cost sectors
🎯 Market Theme:
If crude stays above $90–100, Oil Defence Fertiliser themes may stay strong, while Aviation, Paint & Chemical sectors can remain under pressure.
#CrudeOil #Fertiliser #WestAsia #NirmalaSitharaman #StockMarket #SectorAnalysis #MarketUpdate
6
542

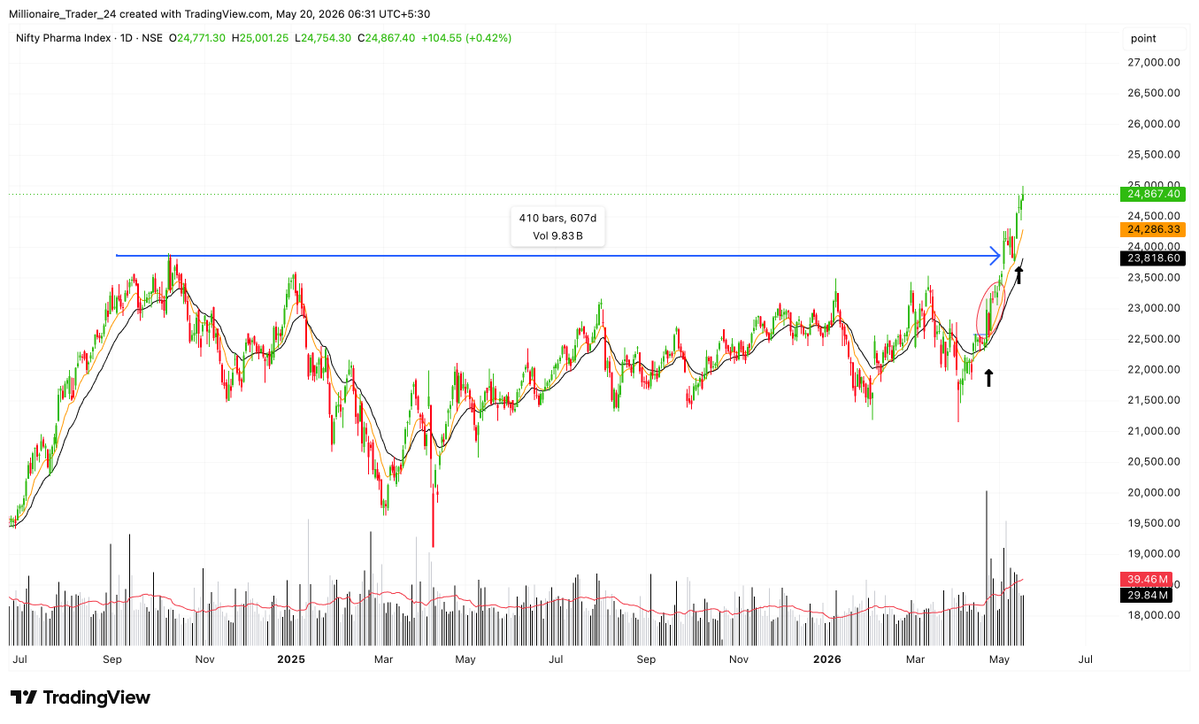
#Pharma Space
→ There is good feedback coming from pharma names, although many of them are still volatile in nature.
→ But for the last 1–2 months, the sector has consistently shown strong price volume action despite the volatility.
→ Currently tracking the liquid and cleaner movers where the action is more structured and participation is visible.
#Pharma #SwingTrading #sectoranalysis

#Producermanufacturing – #Electronictech space looks strong. Tracking this sector for some time and getting the feedback.
Seeing multiple big base breakouts and overall feedback is positive. Track the strongest names and position the strong names in the right area.
Shift your mindset from running behind multiple trades to focusing on strong names to ride. This will help immensely in the bull markets when you learn the art of position sizing and riding the strong names.
#trading #prioritize

1
11
3,314

May 15
A ₹1.66 lakh crore opportunity in India's water sector. 💧
Key players, government tailwinds, and the investment outlook, all in one deep dive 👇
tradejini.com/blogs/navigati…
#Tradejini #WastewaterTreatment #InfrastructureIndia #FundamentalAnalysis #SectorAnalysis #Investing #Jiniversity
2
5
92

May 11
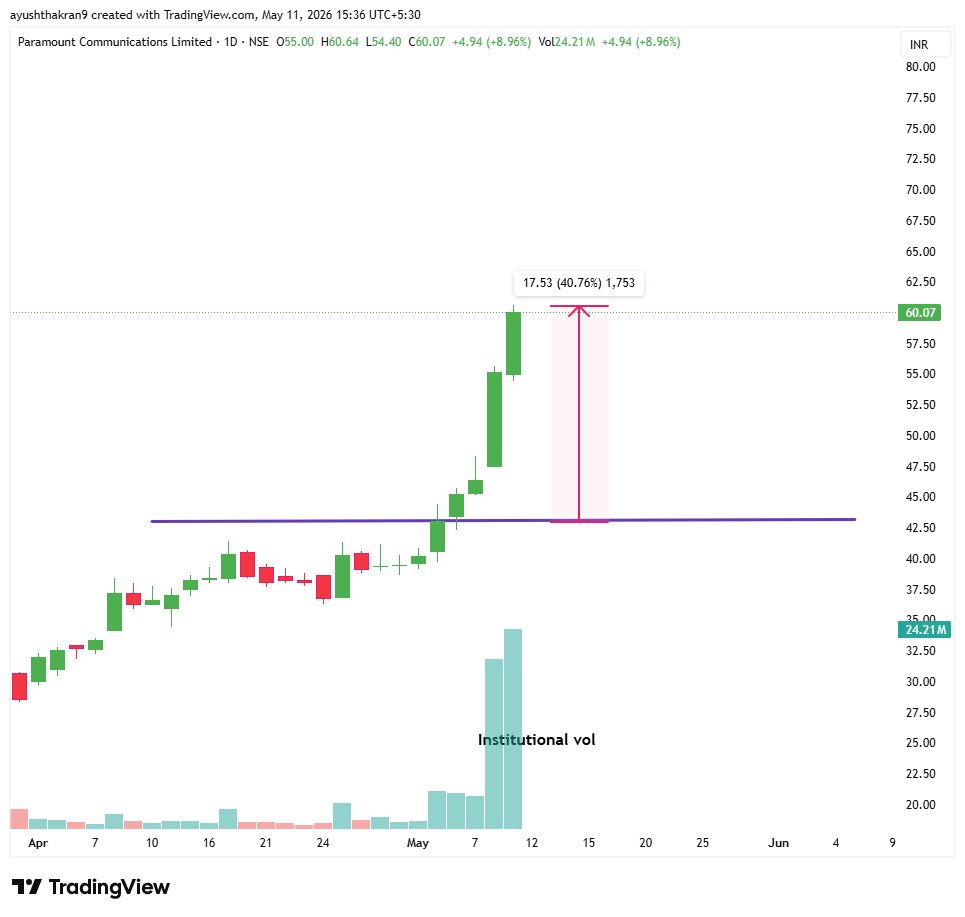
#PARACABLE 🔥❤️
📈 5% up today 🚀
📉 Market down, stock up chal raha hai 💪🔥
💹 43 ➝ 60
🚀 One-side rally 🔥🔥🔥🔥
📊 Making new highs ✅️
💰 40% returns in just 6 days ❤️❤️
#SectorAnalysis 📈🔥

1
1
3
532