
Jun 8
Across Doha, Ras Laffan, Mesaieed and Qatar Free Zones, businesses generating millions of data points annually are using Data Analysis to improve decisions, reduce risk and accelerate growth—statswork.com/contact-us/
#QatarBusiness #DataAnalysis #BusinessAnalytics #Statswork
15
25 Sep 2025
Lead with strategy, not just promotion. Statswork helps you build authority with data-driven thought leadership, industry insights & B2B strategies.
👉 statswork.com/services/thoug…
.
.
#ThoughtLeadership #B2BMarketing #Strategy #BusinessGrowth #DataInsights
1
1
18
10 Sep 2025
Embrace the future with Statswork’s AI & Machine Learning Solutions! From data collection to advanced algorithm development, we deliver transformative insights for business growth.
👉 statswork.com/services/artif…
.
.
#AI #MachineLearning #DataScience #AIConsulting #Statswork
2
29

21 Apr 2025
My Results-Based Matchup Charts for every character - that’s right LITERALLY THOUSANDS OF MATCHUPS
Disclaimer: This is insanely difficult to make accurate because there is just so little high quality data for a lot of these matchups. There are 3400 matchups in smash ultimate and some are a lot less common than others. It’s probably the hardest piece of statswork I’ve worked on yet because of this challenge. That being said, I’ve worked hard to put my best effort forward at making this as accurate as possible!
Also, because of the sheer number of matchups, it’s hard to visualize all of them well, so do feel free to use your favorite tier list maker to make your main’s slice of this chart for you and other players of your main to see!
How the graphic works:
Each cell is the row character’s matchup against the column character’s matchup. For example:
- Steve has an advantage over Diddy Kong ( 1)
- Sonic has a strong advantage over Kazuya ( 2)
- Olimar has a dominant advantage over Samus ( 3)
- Yellow means the matchup is roughly even, like Steve vs Rob
The character in each row/column is repeated 3 times (once on each side and in the middle) so it’s easier to see who is in each column and row
Grayed out squares means there’s not enough data to say what the matchup is. What exactly “enough data” means is explained in the methodology(linked in the thread), where I also have a spreadsheet which shows the best guess based on the limited data
The characters are in order of the results-based tier list, split into 3 segments: high tiers, mid tiers and low tiers. The image on this post has high tiers vs high tiers and the posts in the thread have the other 8 combinations.

42
105
1,050
299,584
2 Feb 2025
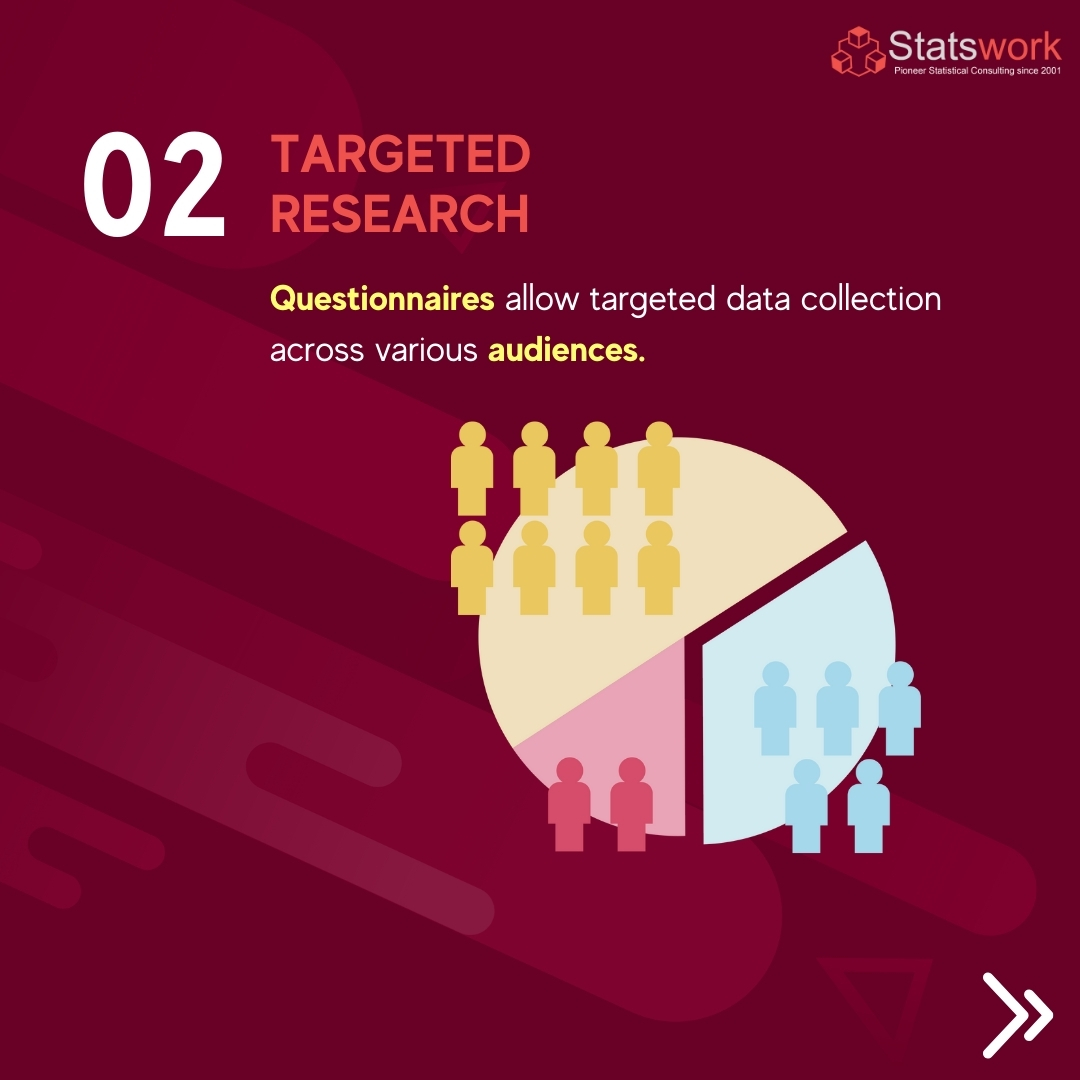
Optimize your research with questionnaires! Learn how these tools give you fast, cost-effective data collection, easy analysis, and honest responses.
Read More: tinyurl.com/b833fn8x
#statswork #replace #statisticalresearch


20
31 Mar 2024
Exciting insights on using #AI in sales! Listen to Sam Richter’s advice on generative AI. #ArtificialIntelligence #podcast #Statswork
Read More: tinyurl.com/3fhjnajp
1
78

2 Jan 2024
Thanks to @GwentData for the years of sharing source fMMR data with me.
I'm not sure yet if I'd continue seasonal statswork for Gwentfinity in 2024.
3
135

25 Oct 2022
If you torture the data long enough, it will confess!
.
.
#stats ,#statstory ,#statswork ,#statics ,#static ,#statisticians ,#data ,#datascience ,#technicalanalysis ,#database ,#bigdata ,#analysis ,#dataanalysis ,#databasesupplier ,#dataanalytics ,#databases ,#quantitative
2

28 Sep 2022
Incredible statswork 🥳
28 Sep 2022

At what ages do tennis players win slams?
The aging curve in sports is something I’ve always found fascinating, even more so as athletes my age win championships or, increasingly, retire. This thread is an attempt to map the ages of slam winners and draw some modest conclusions.
3
27 Jul 2022
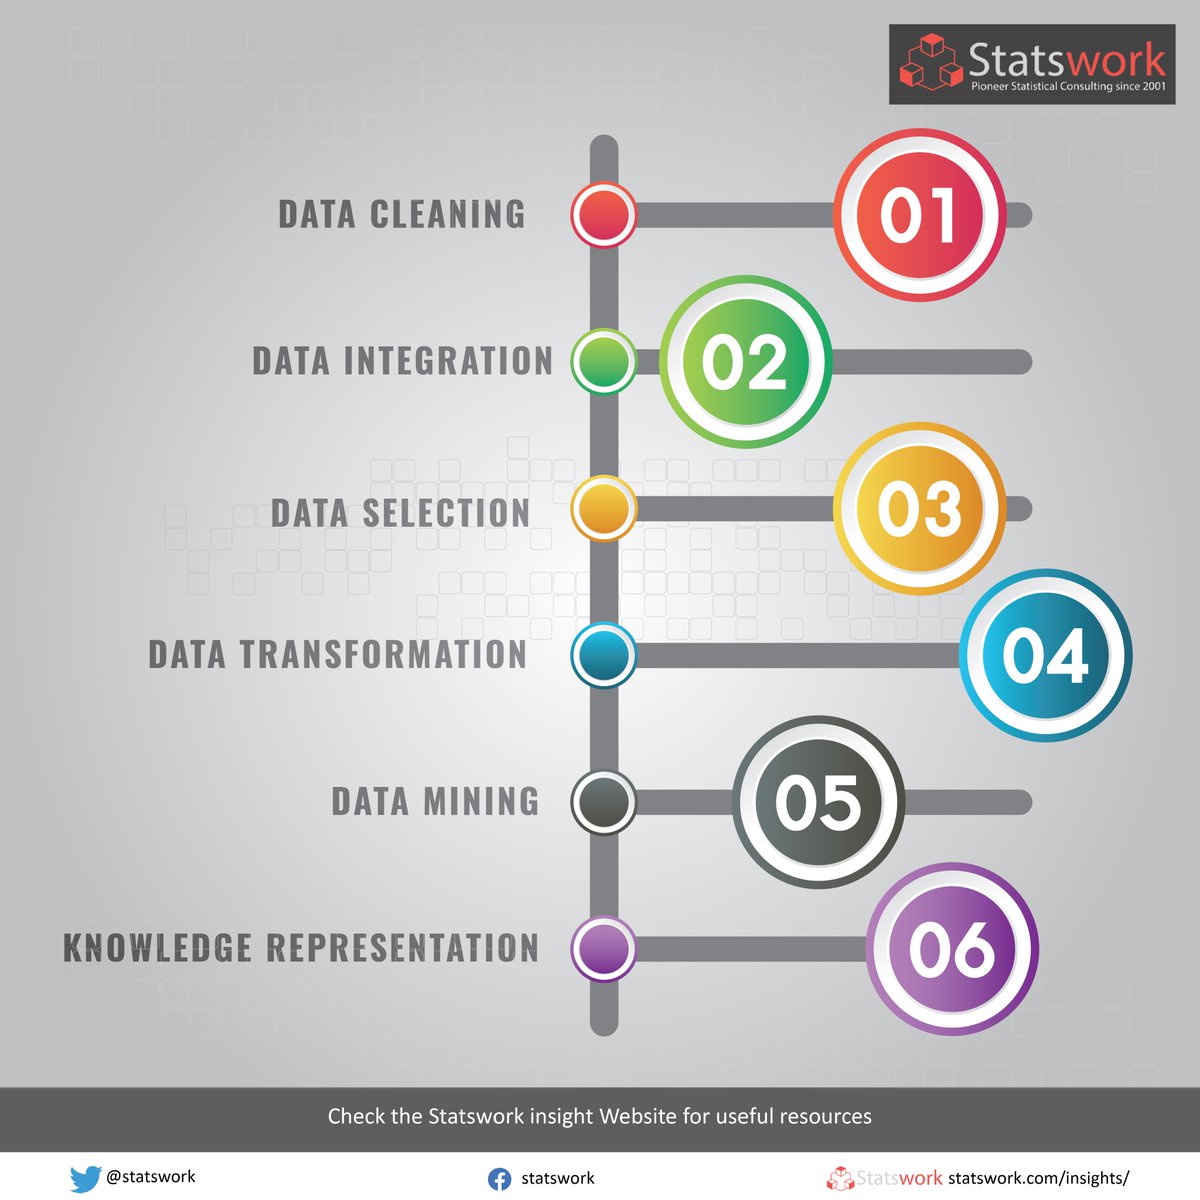
Data Mining and Big Data Analytics Help
Data mining and big data analytics provide you a sense of a prospective consumer's character, needs, relevancies, and buying behavior.
For More Info: bit.ly/3Bixx1J
#DataAnalytics #statswork #datamining #dataintegration
ALT Image with Numbers
2
18 Jul 2022
After some statswork, time for a new @PlayGwent article, inspired by one of @shinmiri2 streams.
leriohub.com/how-many-turns-…
Tutorial on number of turns in Gwent with some case studies. Hope everything is correct 🤞 (let me know if not).
2
9
17 Sep 2021
How recent analytics and related technologies work in the CPG industry? bit.ly/3xvbP4U
#statswork #statisticalanalysisservice #dataanalysisserviceshelp #qualitativedataanalysis #metaanaysis #dataanalysiscompany

1
1
14 Sep 2021
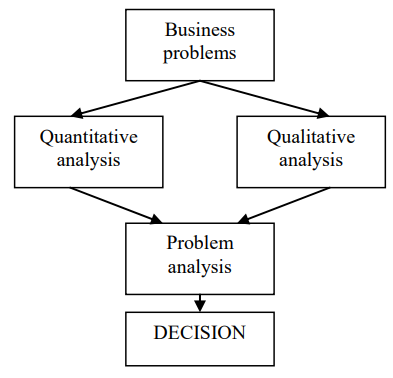
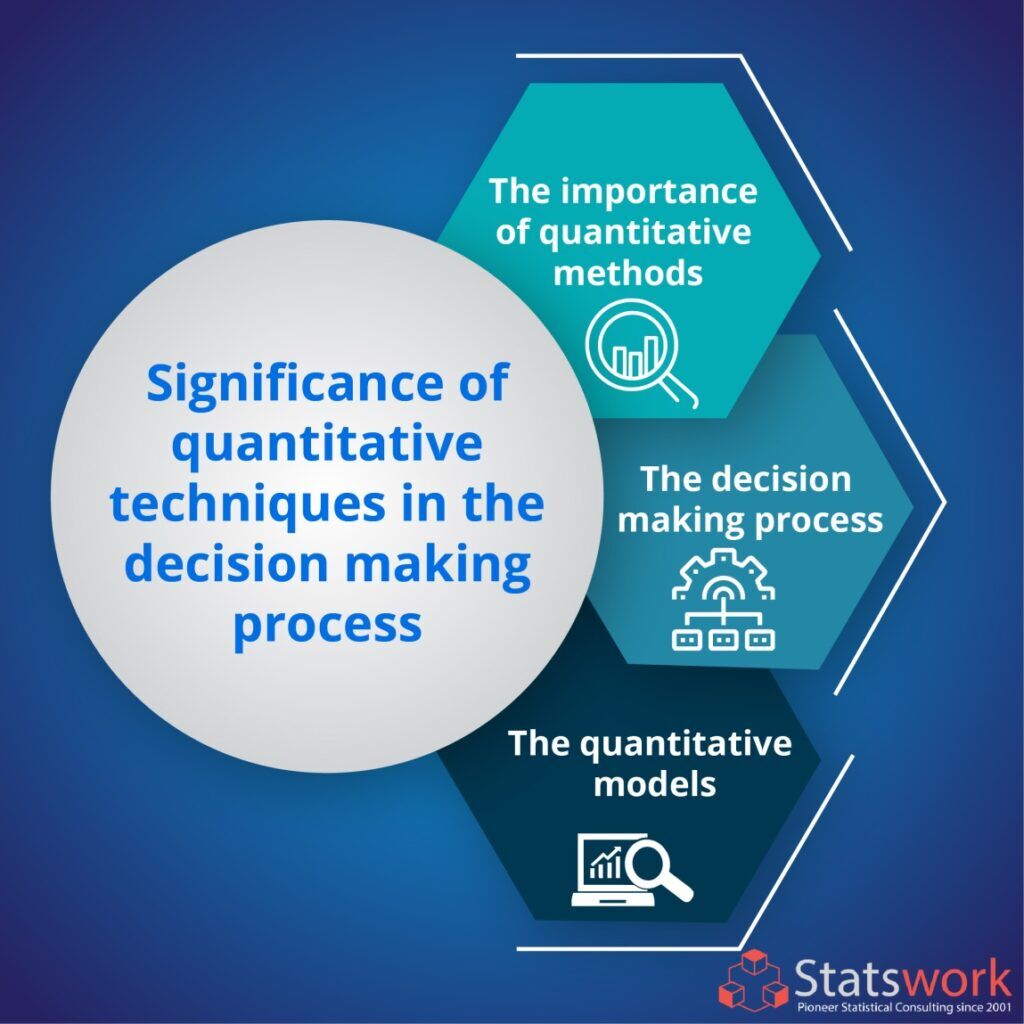
Significance of quantitative techniques in the decision-making process, Read more details visit us: bit.ly/3jbUev1
#Statswork #quantitativeanalysis #dataanalysis #dataanalysisservice #StatisticaldataAnalysis #statisticsdata #metaanaysis #datacollectionservices
2
7 Sep 2021
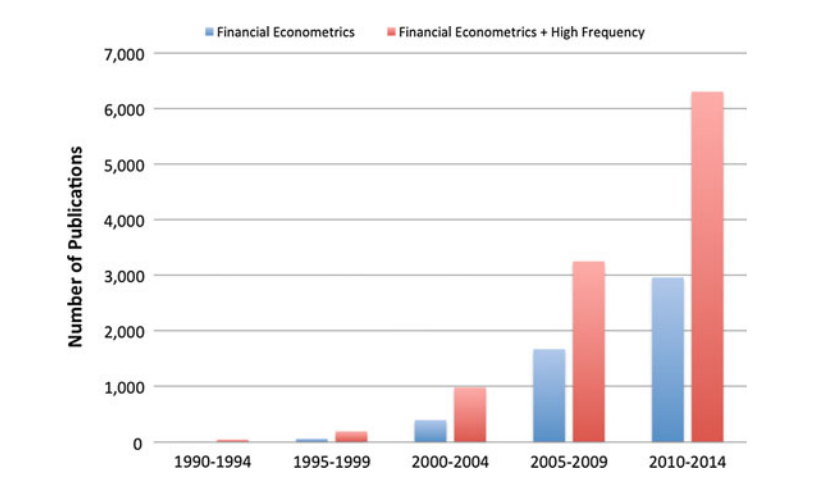
Application Of Quantitative Data Analysis In Finance – Stastwork: bit.ly/37yPB7Q
#statswork #statisticsanalysis #researchanddataanalysis #dataanalysisservice #statisticaldataAnalysis #regressionanalysis #quantitativeanalysis #dataminingservice
2
3 Sep 2021
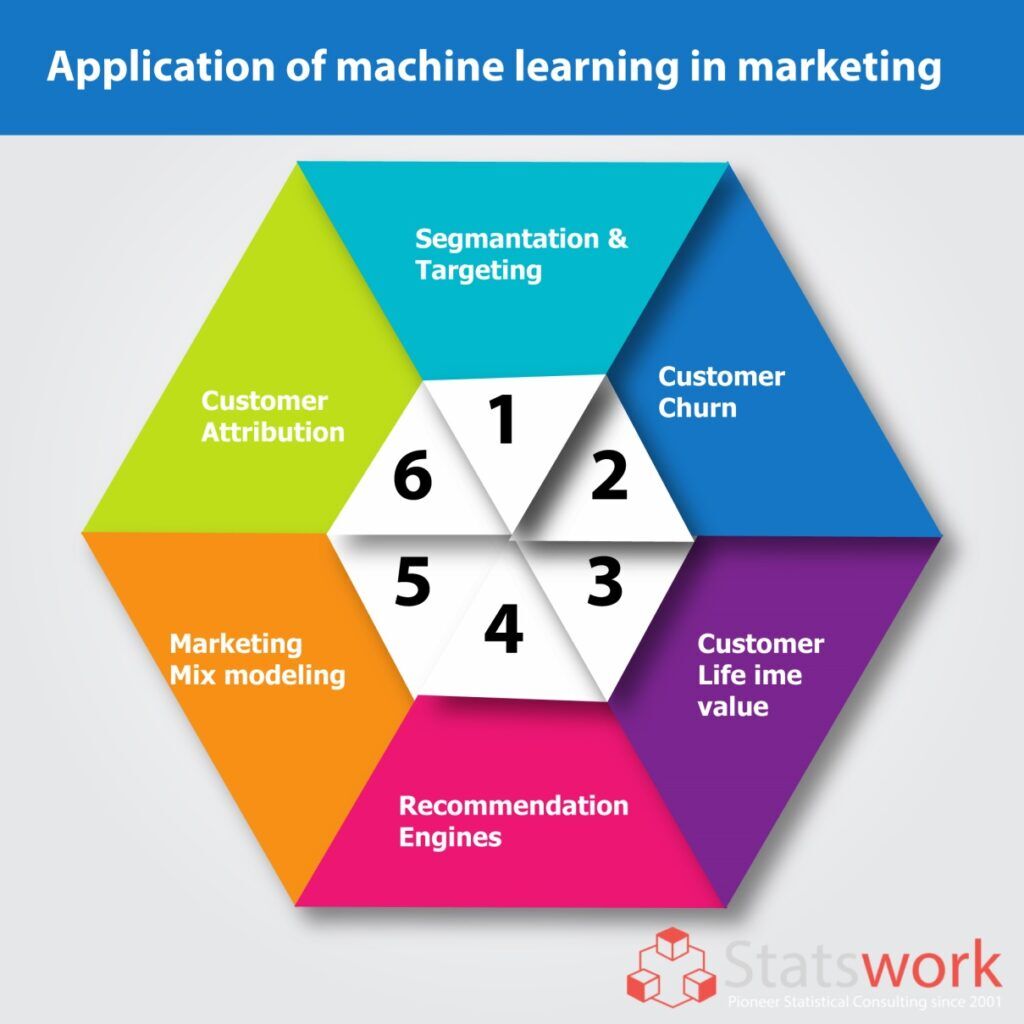
Application of machine learning in marketing: bit.ly/3taGLqJ
#Statswork #dataanalysis #dataanalysisservicehelp #statisticaldataanalysis #primarydata #metaanaysis #datacollectionservices
1
1
1
26 Aug 2021
Significance of quantitative techniques in the decision-making process, Read more details visit us: bit.ly/3jbUev1
#Statswork #quantitativeanalysis #dataanalysis #dataanalysisservice #StatisticaldataAnalysis #statisticsdata #metaanaysis #datacollectionservices
1
2
24 Aug 2021
Application Of Quantitative Data Analysis In Finance – Stastwork: bit.ly/37yPB7Q
#statswork #statisticsanalysis #researchanddataanalysis #dataanalysisservice #statisticaldataAnalysis #regressionanalysis #quantitativeanalysis #dataminingservice

2

20 Aug 2021
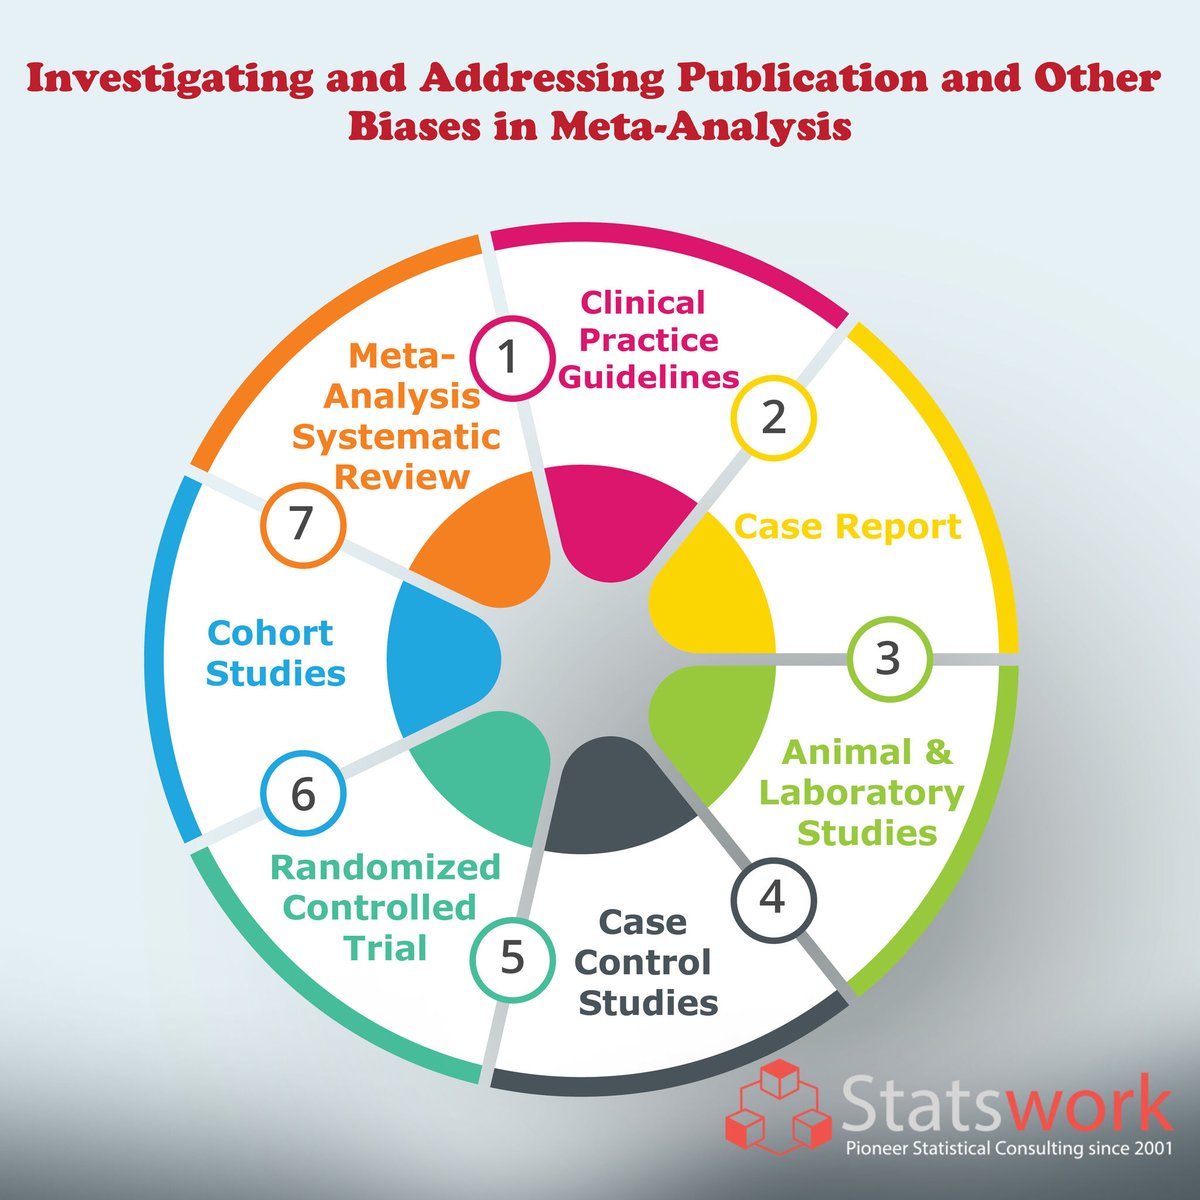
Studies that indicate a substantial impact of therapy are more likely than other studies to be published referenced by other authors and published numerous times. bit.ly/3jHuMMQ
#Statswork #dataanalysis #dataanalysisservice #StatisticaldataAnalysis #statisticsdata
1
2
4