
Jun 12
#Nifty50 #TechnicalView
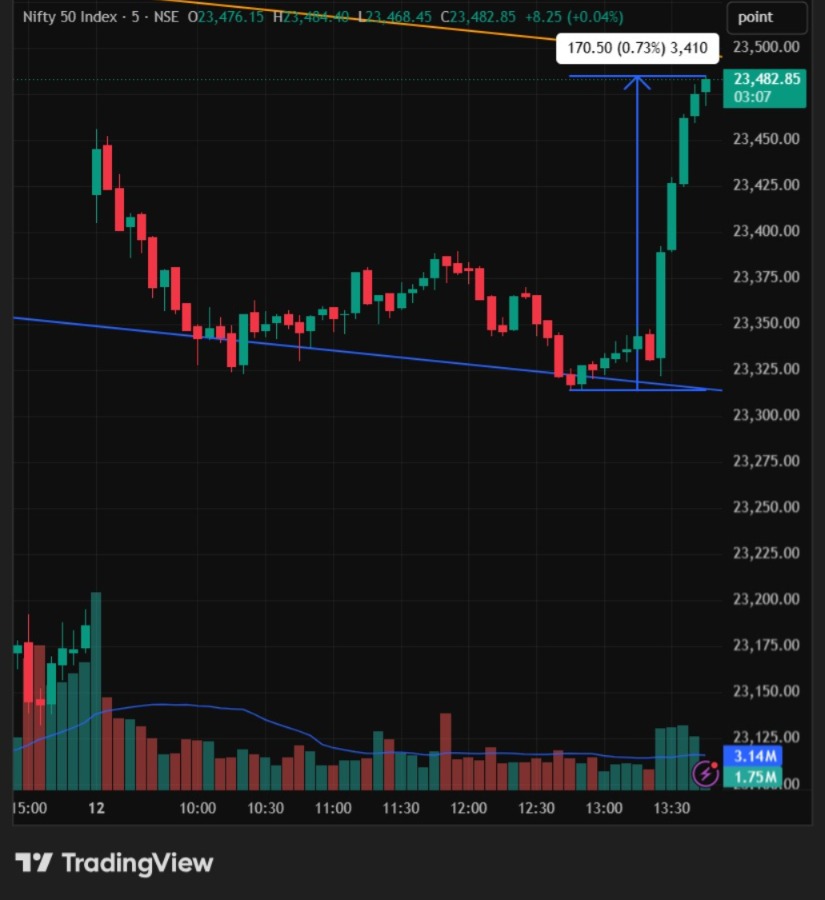
Nifty respected the intraday trendline support and witnessed a sharp bounce in the final hour with strong volume participation. Sustaining above 23,380 may open the path toward 23,450–23,500, while 23,320 remains a key support zone
#Nifty #StockMarket
121
Jun 12
#Nifty50 #TechnicalView
Nifty respected the intraday trendline support and witnessed a sharp bounce in the final hour with strong volume participation. Sustaining above 23,380 may open the path toward 23,450–23,500, while 23,320 remains a key support zone
#Nifty #StockMarket #

2
168

Jun 12
𝗡𝗶𝗳𝘁𝘆 𝟱𝟬 – 𝗖𝗹𝗼𝘀𝗶𝗻𝗴 𝗧𝗲𝗰𝗵𝗻𝗶𝗰𝗮𝗹 𝗩𝗶𝗲𝘄 (𝟭𝟭 𝗝𝘂𝗻𝗲 𝟮𝟬𝟮𝟲)
🔹 Overall Structure
Index closed at 23,161.60 (‑53.35 pts / ‑0.23%).
Tone: Cautious to mildly bearish.
Defended 23,070–23,100 support zone, but failed to sustain recovery amid geopolitical tensions IT sector selling.
🔹 Support Levels
Immediate: 23,100 – 23,000 (critical psychological & structural floor).
Stronger positional: 22,950 – 23,000.
Next major: 22,800 – 22,700 (if 23,000 breaks decisively).
🔹 Resistance Levels
Immediate: 23,200 – 23,250.
Next hurdle: 23,400 – 23,450 (strong supply zone).
Higher breakout targets: 23,550 → 23,800.
🔹 Moving Averages & Trend
Trading below key short‑term averages.
20‑day & 40‑day EMAs acting as overhead resistance near 23,500 zone.
Near‑term bias remains cautious.
🔹 Momentum Indicators
RSI in mid‑30s → subdued, weak momentum.
Oscillators show limited buying conviction.
🔹 Pivot Points (Classic Approx.)
Pivot: ~23,208 – 23,262.
R1: ~23,300.
S1: ~23,100.
📌 Outlook Summary
Bullish only on sustained close above 23,400–23,450 with volume.
Bearish risk if closing below 23,000 → deeper correction possible.
Likely range‑bound between 23,000–23,450 until fresh triggers (geopolitics, FII flows, crude oil).
#Nifty50 #IndianMarkets #TechnicalView #SupportResistance #MovingAverages #RSI #PivotPoints #MarketOutlook
Disclaimer :
The information provided is for general informational purposes only and should not be construed as financial, investment, legal, or tax advice. Past performance is not indicative of future results. Each investor’s circumstances are unique; therefore, you should consult a qualified professional before making any financial commitments. While every effort has been made to ensure accuracy, I assume no liability for any errors or for outcomes resulting from the use of this information.
1
203
Jun 11
#NIFTY50 #TechnicalView
Nifty staged a sharp recovery after a deep intraday sell-off, reclaiming nearly 240 points from the lows Price is now approaching a key resistance after correction yesterday
#Nifty50 #Nifty #NSE #TechnicalAnalysis #PriceAction #TradingView 📊🚀

71
Jun 11
𝗡𝗶𝗳𝘁𝘆 𝟱𝟬 – 𝗧𝗲𝗰𝗵𝗻𝗶𝗰𝗮𝗹 𝗩𝗶𝗲𝘄 (𝗖𝗹𝗼𝘀𝗶𝗻𝗴 𝗕𝗮𝘀𝗶𝘀, 𝟭𝟬𝘁𝗵 𝗝𝘂𝗻𝗲 𝟮𝟬𝟮𝟲)
🔹 Index Snapshot
Close: 23,214.95 (-27.15 pts / -0.12%)
Open: 23,233.95 | High: 23,425.35 | Low: 23,184.60
Day’s Range: 23,184.60 – 23,425.35
52W Range: 22,182.55 – 26,373.20
Volume: ~380M shares (aggregate Nifty stocks)
🔹 Pivot Levels (Classic)
Pivot: 23,208.65
R1: 23,312.90 | R2: 23,383.60 | R3: 23,487.80
S1: 23,137.90 | S2: 23,033.70 | S3: 22,963.00
🔹 Key Technical Indicators
RSI (14): ~39.6–42.2 → approaching oversold, neutral‑bearish bias.
MACD (12,26): Negative (~‑160 to ‑162), bearish crossover.
Moving Averages: Price below all major SMAs/EMAs (5/10/20/50/100/200).
ADX (14): ~23 → moderate trend strength.
ATR (14): ~294 pts → moderate volatility.
CCI: Negative → bearish momentum.
Williams %R: Deep oversold readings in recent sessions.
🔹 Candlestick & Price Action
Small‑bodied candle with upper shadow → indecisive to mildly bearish close.
Intraday gains erased; failure to sustain above 23,300 shows selling pressure on rises.
🔹 Support & Resistance Summary
Immediate Support: 23,137–23,100 (value area psychological).
Next Major Support: 23,000–22,963.
Immediate Resistance: 23,312–23,350.
Next Major Resistance: 23,500 (weekly call OI heavy zone).
🔹 Overall Outlook (Closing Basis)
Short‑term bias: cautious to bearish as Nifty trades below all key MAs with negative MACD.
Oscillators nearing oversold → watch for bounce if 23,100 holds.
Break below 23,100 may accelerate downside towards 22,963–22,800 zone.
Sustained move above 23,350 with volume could shift bias towards 23,500.
📌 Summary – Nifty remains in a corrective phase with downside risk if 23,100 breaks. A bounce is possible from oversold zones, but only a decisive close above 23,350 can revive bullish momentum.
#Nifty50 #TechnicalView #SupportResistance #RSI #MACD #IndiaMarkets
Disclaimer :
The information provided is for general informational purposes only and should not be construed as financial, investment, legal, or tax advice. Past performance is not indicative of future results. Each investor’s circumstances are unique; therefore, you should consult a qualified professional before making any financial commitments. While every effort has been made to ensure accuracy, I assume no liability for any errors or for outcomes resulting from the use of this information.
222
Jun 10
𝗡𝗶𝗳𝘁𝘆 𝟱𝟬 𝗧𝗲𝗰𝗵𝗻𝗶𝗰𝗮𝗹 𝗩𝗶𝗲𝘄 – 𝗖𝗹𝗼𝘀𝗶𝗻𝗴 𝗕𝗮𝘀𝗶𝘀 (𝟵𝘁𝗵 𝗝𝘂𝗻𝗲 𝟮𝟬𝟮𝟲)
🔹 Index Close – 23,242.10 ( 119.10 pts / 0.52%)
Open: 23,259.05 | High: 23,279.40 | Low: 23,104.45
🔹 Overall Trend – Short‑term cautious to mildly bullish after rebound from intraday support near 23,100. Selling pressure capped upside near 23,280. Broader structure remains corrective within consolidation.
🔹 Key Support Levels
Immediate: 23,150 – 23,100 (intraday low & pivot)
Strong: 23,000 – 22,950 (psychological max Put OI zone)
Deeper: 22,800 – 22,700
🔹 Key Resistance Levels
Immediate: 23,300 – 23,350
Next: 23,450 – 23,550 (50‑DMA & prior support turned resistance)
Higher: 23,800 for trend reversal signal
🔹 Pivot Point (Classic) – ~23,204–23,229. Index closed above pivot → mild positive bias for next session.
🔹 Moving Averages – Mixed signals; trading below short/medium MAs but holding above immediate support. 50‑DMA (23,400–23,500) remains key overhead.
🔹 Momentum Indicators
RSI: Neutral zone (neither overbought nor oversold).
MACD: Bearish crossover persists, but histogram shows slowing downside momentum.
India VIX: Elevated ~17, eased slightly post‑recovery.
🔹 Candlestick Pattern – Hammer‑like bullish recovery candle from lower levels, indicating buying interest at supports amid global cues.
🔹 Outlook
Bullish above 23,300 → targets 23,450–23,550.
Bearish below 23,100 → risk toward 23,000–22,900.
Likely range‑bound bias with focus on global cues, FII flows, and expiry impact.
Banking/financials supported rebound; IT & energy lagged.
📌 Traders should monitor the 23,100–23,300 zone closely for next directional move with strict risk management.
#Nifty50 #TechnicalView #SupportResistance #RSI #MACD #IndiaVIX #Candlestick
Disclaimer :
The information provided is for general informational purposes only and should not be construed as financial, investment, legal, or tax advice. Past performance is not indicative of future results. Each investor’s circumstances are unique; therefore, you should consult a qualified professional before making any financial commitments. While every effort has been made to ensure accuracy, I assume no liability for any errors or for outcomes resulting from the use of this information.
209
Jun 9
𝗡𝗶𝗳𝘁𝘆 𝟱𝟬 𝗧𝗲𝗰𝗵𝗻𝗶𝗰𝗮𝗹 𝗩𝗶𝗲𝘄 – 𝗖𝗹𝗼𝘀𝗶𝗻𝗴 𝗕𝗮𝘀𝗶𝘀 (𝟴𝘁𝗵 𝗝𝘂𝗻𝗲 𝟮𝟬𝟮𝟲)
🔹 Closed at 23,123.00, down 243.70 pts (-1.04%)
🔹 Day’s Range – Low 23,070.15 | High 23,267.30
🔹 Overall Trend – Strong Sell on daily timeframe; index below all major moving averages
🔹 Moving Averages – All MAs (5/10/20/50/100/200) flashing Sell; 50‑DMA ~23,434, 200‑DMA ~23,774
🔹 RSI (14) – 33.42, in Sell zone, nearing oversold but no reversal signal yet
🔹 MACD – Bearish, histogram negative; momentum continues downward
🔹 Support Levels – Immediate 23,000–23,100 zone; next 22,900 then 22,600–22,300
🔹 Resistance Levels – Immediate 23,285–23,350; next 23,500–23,600
🔹 Pivot Points (Classic) – Pivot ~23,170; S1 ~23,125; R1 ~23,194
🔹 Candlestick Pattern – Bearish daily candle; gap‑down open with weak recovery shows selling pressure
🔹 Broader Structure – Short‑term falling channel; holding above 23,000 critical to avoid deeper correction
🔹 Volatility – India VIX spiked ~8% intraday; risk remains elevated
🔹 Outlook – Bearish bias persists; sustained trade below 23,000 could accelerate downside. Watch 23,000 support closely for next directional move.
#Nifty50 #TechnicalView #SupportResistance #RSI #MACD #IndiaMarkets
Disclaimer :
The information provided is for general informational purposes only and should not be construed as financial, investment, legal, or tax advice. Past performance is not indicative of future results. Each investor’s circumstances are unique; therefore, you should consult a qualified professional before making any financial commitments. While every effort has been made to ensure accuracy, I assume no liability for any errors or for outcomes resulting from the use of this information.
220

Jun 4
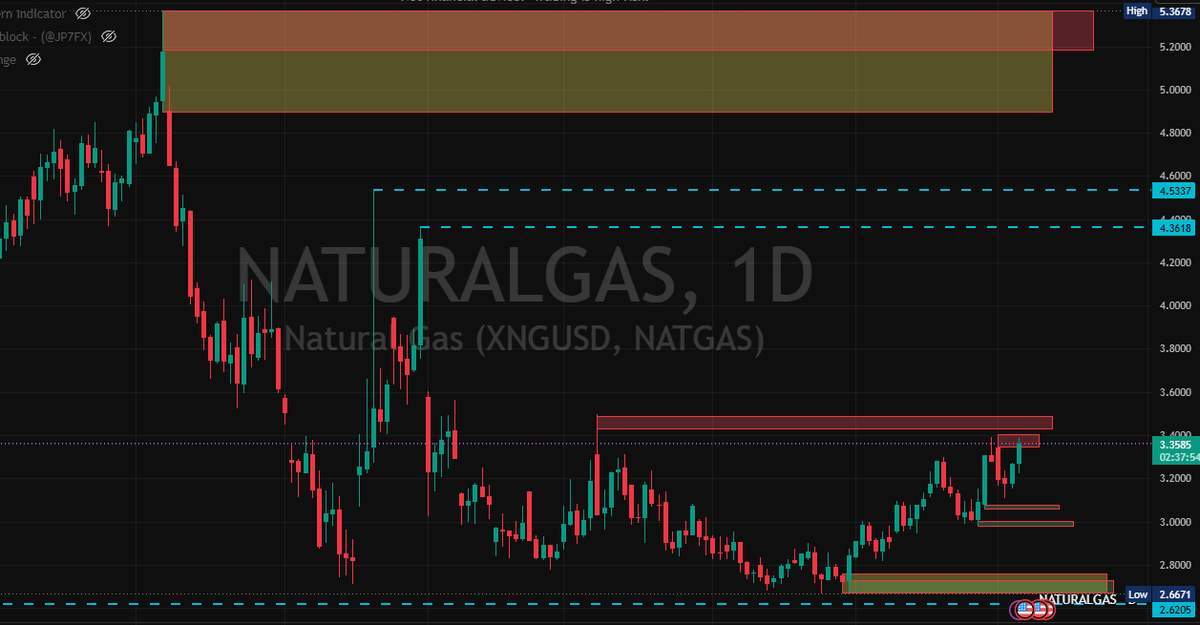
#NATGAS on the Daily chart — currently dancing right inside a key supply zone.
If price manages to break through this level and the next red supply zone above it, the next major technical resistance is a long way up.
Question for you:
Do you think these closer supply zones will hold NATGAS back and keep it subdued… or will it chew through them and run toward the higher targets?
Drop your analysis below 👇
#NATGAS #TechnicalView
2
8
1,128
Jun 3
🇮🇳 NIFTY 50 Technical View — Closing Summary (June 3, 2026)
🔹 Candlestick Pattern: Nifty 50 formed a narrow-bodied bearish candle with a long lower shadow on the daily chart, indicating strong buying interest emerged at lower levels despite significant intraday selling pressure.
🔹 Intraday Recovery: The index witnessed a sharp rebound of more than 250 points from its intraday low of 23,151.50, allowing it to reclaim the important 23,400 zone by the close.
🔹 Moving Averages: While the recovery was encouraging, Nifty remained below its key 20-period Exponential Moving Average (EMA) on the hourly chart, suggesting short-term bearish pressure has not yet been fully neutralized.
🔹 Price Structure: The hourly trend continues to reflect a lower-top, lower-bottom formation, indicating that the immediate short-term market structure remains weak.
🔹 RSI Momentum: The hourly Relative Strength Index (RSI) displayed a positive divergence, often viewed as an early sign that downside momentum may be losing strength.
🔹 Immediate Support: The first support zone is positioned around 23,300–23,350, which acted as a strong demand area during today's session.
🔹 Critical Support: A decisive break below 23,300 could accelerate selling pressure and open the path toward the major psychological support level of 23,000.
🔹 Immediate Resistance: The index faces near-term resistance around 23,450.
🔹 Major Resistance: The 23,600 zone remains the key hurdle for bulls. Sustained trading above this level would be required to improve the short-term technical outlook.
🔹 Derivatives Setup: The Put-Call Ratio (PCR) near 0.87 suggests a market still carrying substantial short positions. Any positive global or domestic trigger could lead to a sharp short-covering rally.
Technical Outlook
The sharp recovery from intraday lows shows buyers are active near support zones, but the broader short-term trend remains cautious until Nifty decisively moves above 23,450–23,600. Holding above 23,300 remains critical to prevent a deeper correction toward 23,000.
Date: June 3, 2026
#Nifty50 #TechnicalAnalysis #NiftyPrediction #ShareMarketIndia #StockMarketIndia #NSE #TechnicalView #TradingLevels
Disclaimer :
The information provided is for general informational purposes only and should not be construed as financial, investment, legal, or tax advice. Past performance is not indicative of future results. Each investor’s circumstances are unique; therefore, you should consult a qualified professional before making any financial commitments. While every effort has been made to ensure accuracy, I assume no liability for any errors or for outcomes resulting from the use of this information.
213

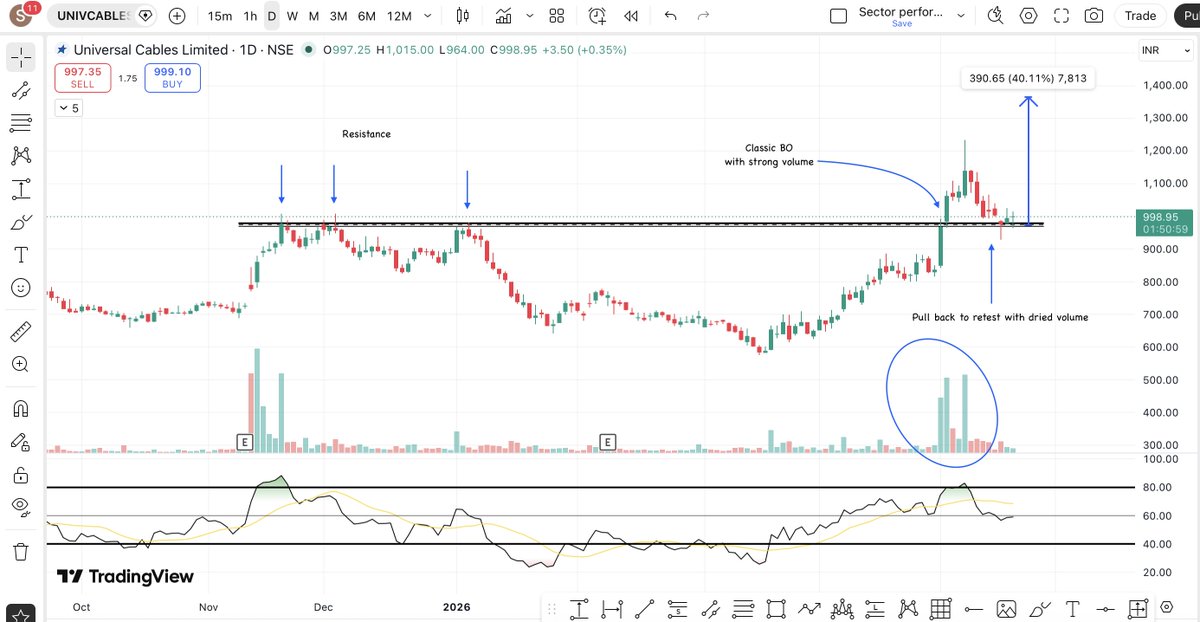
#UniversalCables CMP 996... Typical text book move... Pure technical call.... Chart for learning.... #TER #TERcatalyst #Technicalview
1
4
283
May 20
𝗡𝗶𝗳𝘁𝘆 𝟱𝟬 – 𝗧𝗲𝗰𝗵𝗻𝗶𝗰𝗮𝗹 𝗦𝗲𝘁𝘂𝗽 May 19, 2026 close:
🔹 Closed at 23,618, down 32 pts (0.14%), forming bearish candle with upper shadow.
🔹 Bias: Sideways to bearish; below 23,800 hurdle keeps sellers in control.
🔹 Resistance: 23,700 (monthly OI) → 24,000 as crucial hurdle.
🔹 Support: 23,400 immediate; 23,000 major zone.
🔹 Trend Reversal: Bulls need decisive close above 20‑day EMA (23,835) for upside to 24,000–24,100.
🔹 Momentum: RSI 44.70 (sideways, below signal line); MACD bearish with shrinking histogram.
𝗕𝗮𝗻𝗸 𝗡𝗶𝗳𝘁𝘆 – 𝗧𝗲𝗰𝗵𝗻𝗶𝗰𝗮𝗹 𝗦𝗲𝘁𝘂𝗽 🏦
🔹 Closed at 53,409, down 128 pts (0.24%), narrow range weakness.
🔹 Support: 53,100–53,000 zone; break below → 52,500.
🔹 Resistance: 53,900–54,000 immediate.
🔹 Below key moving averages, bias remains weak.
𝗩𝗼𝗹𝗮𝘁𝗶𝗹𝗶𝘁𝘆 & 𝗢𝗽𝘁𝗶𝗼𝗻𝘀 📉
🔹 India VIX: Fell 4.87% to 18.67, still elevated above 17 → bulls uncomfortable.
🔹 Options Data: Max Call OI at 24,000 & 23,700 strikes; Max Put OI at 23,000 → reinforces 23,700 resistance.
📌 Overall Sentiment: Consolidative with bearish tilt; watch 23,400 downside & 23,800 upside for reversal signals. Macro drivers: geopolitical factors, crude oil, rupee movement.
#Nifty50 #BankNifty #TechnicalView #MarketUpdate #OptionsData #IndiaVIX #Equities
Disclaimer :
All content provided is intended solely for educational and informational purposes and does not constitute financial advice. Investors are strongly encouraged to assess their individual risk tolerance, investment objectives, and overall financial situation before making any investment decisions. For personalized guidance, please consult a certified financial advisor. While every effort has been made to ensure accuracy, any inadvertent errors or omissions are regretted.
1
233

May 18
Nifty Recovers from Intraday Lows, Nifty Bank Flashes Reversal Signal
#Nifty #TechnicalView #SAMCOSecurities
equitybulls.com/category.php…
1
413
May 18
Nifty Bank fails to sustain rebound; technical structure hints at continued consolidation with weak bias
#BankNifty #TechnicalView #SAMCOSecurities
equitybulls.com/category.php…
1
344

8/ Key Bank Nifty resistance lies at 56,600–56,700 (200-day EMA). A breakout above this could push the index towards 57,200.
#BankNiftyLevels #BankingSector #TechnicalView
Source: Moneycontrol
#Moneycontrol #FinanceNews #MarketOutlook
80
Apr 23
#Nifty Technical View: Closing Basis (April 22, 2026)
🔺 Bearish Candle Formation: The Nifty 50 formed a clear bearish candle on the daily timeframe, closing near the session's low of 24,352.90.
🔺 Breach of Psychological Support: The index slipped below the crucial 24,400 psychological mark, signaling that sellers maintained control throughout the day.
🔺 Key Support Zone: Immediate technical support is now positioned in the 24,100–24,150 range, with a secondary base seen at the 24,000 level.
🔺 Immediate Resistance Levels: On any pullback, the 24,550–24,600 zone is expected to act as a primary hurdle for the bulls.
🔺 RSI Cooldown: The Relative Strength Index (RSI) stands at 56.44, showing a slight cooling from higher levels while remaining above the neutral midpoint.
🔺 India VIX Spike: The volatility index, India VIX, rose by 4.38%, indicating a mild increase in market uncertainty and risk-off sentiment.
🔺 Moving Average Context: Despite the daily drop, the index continues to hold above its major long-term moving averages, keeping the broad structural trend intact.
🔺 Derivatives Data (Calls): Significant call writing was observed at the 24,500 and 24,600 strike levels, reinforcing these as strong immediate resistance caps.
🔺 Derivatives Data (Puts): Put writing at the 24,300 and 24,400 levels suggests that traders are attempting to form a floor near current levels.
🔺 Short-Term Outlook: The technical bias remains cautious as the index snapped a three-day winning streak, requiring a sustained move back above 24,550 to regain momentum.
#NiftyTechnicalAnalysis #Nifty50 #TechnicalView #StockMarketIndia #TradingStrategy #RSI #SupportAndResistance #DalalStreet #April2026
Disclaimer :
The information provided is for general informational purposes only and should not be construed as financial, investment, legal, or tax advice. Past performance is not indicative of future results. Each investor’s circumstances are unique; therefore, you should consult a qualified professional before making any financial commitments. While every effort has been made to ensure accuracy, I assume no liability for any errors or for outcomes resulting from the use of this information.
1
1
273

Apr 15
Nifty Outlook 16 April: बना हायर हाई और हायर लो पैटर्न, अब आगे कहां जाएगा निफ्टी? जानें एक्सपर्ट की राय
#NiftyOutlook #TechnicalView #Money9Live
money9live.com/share-market/…

1
127
Apr 10
#Nifty Technical View: Closing Basis On April 9, 2026
#Candlestick Pattern: The index formed a bearish candle on the daily chart, failing to provide follow-through buying after the previous session's "Marubozu" style surge.
#Fibonacci Levels: Nifty settled near the 0.382 Fibonacci retracement level (23,770–23,750), which now acts as a critical "make-or-break" support zone for the current pullback.
Moving Averages: Despite the drop, the index remained above its 20-day EMA, indicating that the medium-term recovery trend is not yet invalidated.
Resistance Zone: Immediate technical resistance is firmly placed at the 24,000–24,080 range, followed by a heavy confluence zone near the 50-day EMA at 24,260.
Support Levels: Strong downside support is identified at the 23,400–23,600 band, which corresponds with the large bullish gap created earlier in the week.
Relative Strength Index (RSI): The RSI is sustaining above the 50 mark, suggesting that while profit booking is occurring, the underlying momentum remains technically positive.
Volatility (India #VIX): The VIX surged nearly 5% to close around 20.67, reflecting a spike in trader anxiety and the likelihood of wider intraday swings in upcoming sessions.
Derivatives Data: The Put-Call Ratio (#PCR) stands at 0.92, signaling a neutral to slightly cautious positioning as call writing increased at the 24,000 strike.
Technical Outlook: As long as Nifty holds above the 23,750 mark on a closing basis, the structure remains "buy on dips"; a break below this could lead to a gap-fill move toward 23,200.
#NiftyTechnicalAnalysis #Nifty50 #TechnicalView #StockMarketIndia #TradingLevels #SupportAndResistance #IndiaVIX #April2026
Disclaimer :
All content provided is intended solely for educational and informational purposes and does not constitute financial advice. Investors are strongly encouraged to assess their individual risk tolerance, investment objectives, and overall financial situation before making any investment decisions. For personalized guidance, please consult a certified financial advisor. While every effort has been made to ensure accuracy, any inadvertent errors or omissions are regretted.
1
222

Markets Slip Early! Nifty Falls Below 22,900 as Weak Global Cues Weigh on Sentiment
capitalmarket.com
#StockMarket #Nifty50 #Sensex #MarketFall #DalalStreet #MarketUpdate #EquityMarket #IndiaMarkets #Bearish #Trading #Investing #FinancialNews #MarketBuzz #SupportLevels #TechnicalView #IndiaInc #WealthCreation #CapitalMarkets

1
151

Mar 30
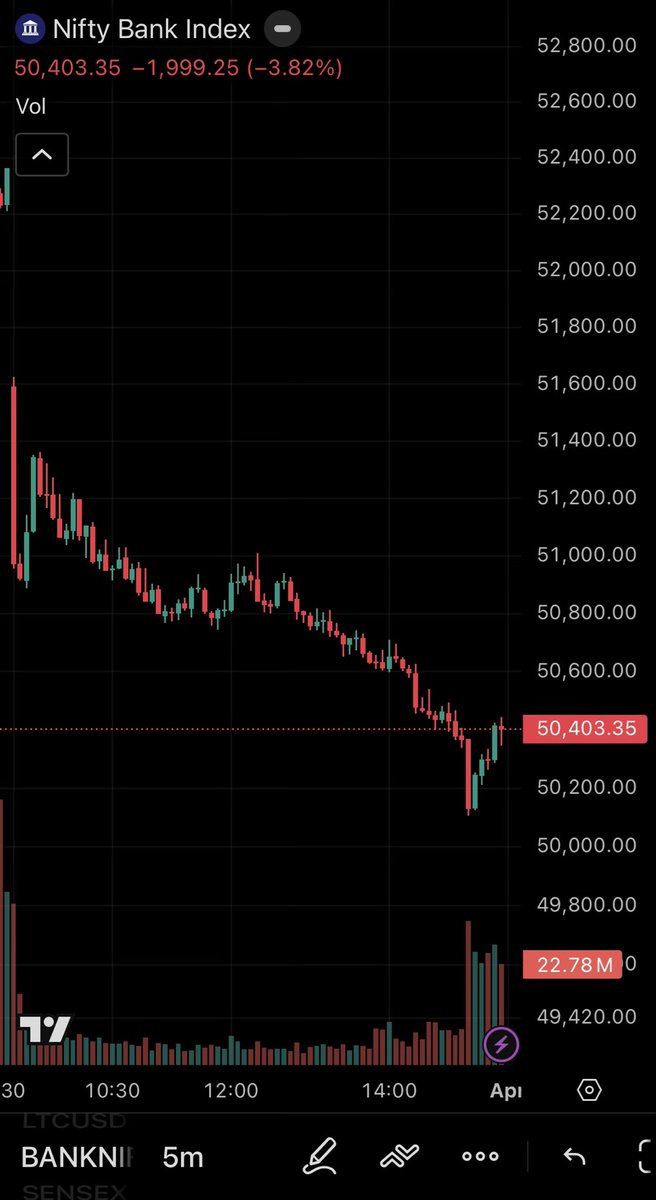
𝗕𝗔𝗡𝗞 𝗡𝗜𝗙𝗧𝗬 𝗖𝗛𝗔𝗥𝗧 𝗦𝗧𝗢𝗥𝗬 — 𝟯𝟬 𝗠𝗔𝗥𝗖𝗛 𝟮𝟬𝟮𝟲
𝗚𝗮𝗽 𝗗𝗼𝘄𝗻 → 𝗘𝗮𝗿𝗹𝘆 𝗦𝗹𝗶𝗽 → 𝗠𝗶𝗱-𝗗𝗮𝘆 𝗣𝗮𝘂𝘀𝗲 → 𝗟𝗮𝘁𝗲 𝗦𝗲𝗹𝗹𝗶𝗻𝗴 → 𝗪𝗲𝗮𝗸 𝗖𝗹𝗼𝘀𝗲 📉
• 🔴 𝗦𝗵𝗮𝗿𝗽 𝗚𝗮𝗽-𝗗𝗼𝘄𝗻 𝗦𝘁𝗮𝗿𝘁: Bank Nifty opened with a deep negative gap and immediate selling pressure, showing banks were under stress from the opening bell.
• 🔻 𝗘𝗮𝗿𝗹𝘆 𝗗𝗼𝘄𝗻𝘀𝗶𝗱𝗲 𝗘𝘅𝘁𝗲𝗻𝘀𝗶𝗼𝗻: After the weak open, the index kept slipping in the first leg and quickly moved below the 51,200–51,000 area.
• 🟡 𝗠𝗶𝗱-𝗦𝗲𝘀𝘀𝗶𝗼𝗻 𝗣𝗮𝘂𝘀𝗲: Around the middle of the session, candles turned smaller and flatter near the 50,800–50,950 belt, suggesting temporary stabilisation rather than real recovery.
• 🔄 𝗪𝗲𝗮𝗸 𝗕𝗼𝘂𝗻𝗰𝗲𝘀 𝗙𝗮𝗰𝗲𝗱 𝗦𝘂𝗽𝗽𝗹𝘆: A few green candles appeared around noon, but every rebound was sold into quickly, confirming a lower-high intraday structure.
• 🔴 𝗟𝗮𝘁𝗲 𝗔𝗳𝘁𝗲𝗿𝗻𝗼𝗼𝗻 𝗦𝗲𝗹𝗹𝗶𝗻𝗴: In the final stretch, the chart tilted lower again and price slipped toward the 50,150–50,050 zone, showing renewed weakness into the close.
• 🟡 𝗟𝗮𝘁𝗲 𝗣𝘂𝗹𝗹𝗯𝗮𝗰𝗸 𝗪𝗮𝘀 𝗦𝗵𝗮𝗹𝗹𝗼𝘄: The last candles showed a bounce from intraday lows, but the recovery stayed limited and Bank Nifty still closed weak at 50,403.35.
• 📊 𝗩𝗼𝗹𝘂𝗺𝗲 𝗦𝗶𝗴𝗻𝗮𝗹: Volume was heavy at the open and surged again in the closing phase, suggesting stronger participation during decline phases and late short-covering bounce.
⸻
🔮 𝗡𝗘𝗫𝗧 𝗧𝗥𝗔𝗗𝗜𝗡𝗚 𝗢𝗨𝗧𝗟𝗢𝗢𝗞 — 𝟭 𝗔𝗣𝗥𝗜𝗟 𝟮𝟬𝟮𝟲
• 🟥 𝗜𝗺𝗺𝗲𝗱𝗶𝗮𝘁𝗲 𝗥𝗲𝘀𝗶𝘀𝘁𝗮𝗻𝗰𝗲: 50,450–50,650
• 🟩 𝗡𝗲𝗮𝗿 𝗦𝘂𝗽𝗽𝗼𝗿𝘁: 50,200–50,050
• 📊 Sustained move above 50,650 may open room toward 50,850–51,000
• ⚠️ Slip below 50,050 can drag the index toward 49,800–49,500
⸻
⚠️ Disclaimer: Educational market observation. Not investment advice.
#BankNifty #ChartStory #IndianMarkets #TechnicalView #PriceAction
Mar 30

𝗡𝗜𝗙𝗧𝗬 𝗖𝗛𝗔𝗥𝗧 𝗦𝗧𝗢𝗥𝗬 — 𝟯𝟬 𝗠𝗔𝗥𝗖𝗛 𝟮𝟬𝟮𝟲
𝗚𝗮𝗽 𝗗𝗼𝘄𝗻 → 𝗘𝗮𝗿𝗹𝘆 𝗦𝗹𝗶𝗽 → 𝗠𝗶𝗱-𝗗𝗮𝘆 𝗣𝗮𝘂𝘀𝗲 → 𝗟𝗮𝘁𝗲 𝗦𝗲𝗹𝗹𝗶𝗻𝗴 → 𝗪𝗲𝗮𝗸 𝗖𝗹𝗼𝘀𝗲 📉
• 🔴 𝗦𝗵𝗮𝗿𝗽 𝗚𝗮𝗽-𝗗𝗼𝘄𝗻 𝗦𝘁𝗮𝗿𝘁: Nifty opened with a deep negative gap and immediate selling pressure, showing bears controlled the tape from the opening bell.
• 🔻 𝗘𝗮𝗿𝗹𝘆 𝗗𝗼𝘄𝗻𝘀𝗶𝗱𝗲 𝗘𝘅𝘁𝗲𝗻𝘀𝗶𝗼𝗻: After the weak open, the index kept slipping in the first leg and quickly moved below the 22,620–22,540 area.
• 🟡 𝗠𝗶𝗱-𝗦𝗲𝘀𝘀𝗶𝗼𝗻 𝗣𝗮𝘂𝘀𝗲: Around the middle of the session, candles turned smaller and flatter near the 22,460–22,540 belt, suggesting temporary stabilisation rather than real recovery.
• 🔄 𝗪𝗲𝗮𝗸 𝗕𝗼𝘂𝗻𝗰𝗲𝘀 𝗙𝗮𝗰𝗲𝗱 𝗦𝘂𝗽𝗽𝗹𝘆: A few green candles appeared around noon, but every rebound was sold into quickly, confirming a lower-high intraday structure.
• 🔴 𝗟𝗮𝘁𝗲 𝗔𝗳𝘁𝗲𝗿𝗻𝗼𝗼𝗻 𝗦𝗲𝗹𝗹𝗶𝗻𝗴: In the final stretch, the chart tilted lower again and price slipped toward the 22,300–22,280 zone, showing renewed weakness into the close.
• 🟡 𝗟𝗮𝘁𝗲 𝗣𝘂𝗹𝗹𝗯𝗮𝗰𝗸 𝗪𝗮𝘀 𝗦𝗵𝗮𝗹𝗹𝗼𝘄: The last candles showed a bounce from intraday lows, but the recovery remained limited and Nifty still closed weak at 22,379.20.
• 📊 𝗩𝗼𝗹𝘂𝗺𝗲 𝗦𝗶𝗴𝗻𝗮𝗹: Volume was heavy at the open and surged sharply again in the closing phase, suggesting stronger participation during decline phases and late short-covering bounce.
⸻
🔮 𝗡𝗘𝗫𝗧 𝗧𝗥𝗔𝗗𝗜𝗡𝗚 𝗢𝗨𝗧𝗟𝗢𝗢𝗞 — 𝟭 𝗔𝗣𝗥𝗜𝗟 𝟮𝟬𝟮𝟲
• 🟥 𝗜𝗺𝗺𝗲𝗱𝗶𝗮𝘁𝗲 𝗥𝗲𝘀𝗶𝘀𝘁𝗮𝗻𝗰𝗲: 22,400–22,460
• 🟩 𝗡𝗲𝗮𝗿 𝗦𝘂𝗽𝗽𝗼𝗿𝘁: 22,300–22,250
• 📊 Sustained move above 22,460 may open room toward 22,540–22,620
• ⚠️ Slip below 22,250 can drag the index toward 22,180–22,000
⸻
⚠️ Disclaimer: Educational market observation. Not investment advice.
#Nifty #ChartStory #IndianMarkets #TechnicalView #PriceAction

76
Mar 30
𝗡𝗜𝗙𝗧𝗬 𝗖𝗛𝗔𝗥𝗧 𝗦𝗧𝗢𝗥𝗬 — 𝟯𝟬 𝗠𝗔𝗥𝗖𝗛 𝟮𝟬𝟮𝟲
𝗚𝗮𝗽 𝗗𝗼𝘄𝗻 → 𝗘𝗮𝗿𝗹𝘆 𝗦𝗹𝗶𝗽 → 𝗠𝗶𝗱-𝗗𝗮𝘆 𝗣𝗮𝘂𝘀𝗲 → 𝗟𝗮𝘁𝗲 𝗦𝗲𝗹𝗹𝗶𝗻𝗴 → 𝗪𝗲𝗮𝗸 𝗖𝗹𝗼𝘀𝗲 📉
• 🔴 𝗦𝗵𝗮𝗿𝗽 𝗚𝗮𝗽-𝗗𝗼𝘄𝗻 𝗦𝘁𝗮𝗿𝘁: Nifty opened with a deep negative gap and immediate selling pressure, showing bears controlled the tape from the opening bell.
• 🔻 𝗘𝗮𝗿𝗹𝘆 𝗗𝗼𝘄𝗻𝘀𝗶𝗱𝗲 𝗘𝘅𝘁𝗲𝗻𝘀𝗶𝗼𝗻: After the weak open, the index kept slipping in the first leg and quickly moved below the 22,620–22,540 area.
• 🟡 𝗠𝗶𝗱-𝗦𝗲𝘀𝘀𝗶𝗼𝗻 𝗣𝗮𝘂𝘀𝗲: Around the middle of the session, candles turned smaller and flatter near the 22,460–22,540 belt, suggesting temporary stabilisation rather than real recovery.
• 🔄 𝗪𝗲𝗮𝗸 𝗕𝗼𝘂𝗻𝗰𝗲𝘀 𝗙𝗮𝗰𝗲𝗱 𝗦𝘂𝗽𝗽𝗹𝘆: A few green candles appeared around noon, but every rebound was sold into quickly, confirming a lower-high intraday structure.
• 🔴 𝗟𝗮𝘁𝗲 𝗔𝗳𝘁𝗲𝗿𝗻𝗼𝗼𝗻 𝗦𝗲𝗹𝗹𝗶𝗻𝗴: In the final stretch, the chart tilted lower again and price slipped toward the 22,300–22,280 zone, showing renewed weakness into the close.
• 🟡 𝗟𝗮𝘁𝗲 𝗣𝘂𝗹𝗹𝗯𝗮𝗰𝗸 𝗪𝗮𝘀 𝗦𝗵𝗮𝗹𝗹𝗼𝘄: The last candles showed a bounce from intraday lows, but the recovery remained limited and Nifty still closed weak at 22,379.20.
• 📊 𝗩𝗼𝗹𝘂𝗺𝗲 𝗦𝗶𝗴𝗻𝗮𝗹: Volume was heavy at the open and surged sharply again in the closing phase, suggesting stronger participation during decline phases and late short-covering bounce.
⸻
🔮 𝗡𝗘𝗫𝗧 𝗧𝗥𝗔𝗗𝗜𝗡𝗚 𝗢𝗨𝗧𝗟𝗢𝗢𝗞 — 𝟭 𝗔𝗣𝗥𝗜𝗟 𝟮𝟬𝟮𝟲
• 🟥 𝗜𝗺𝗺𝗲𝗱𝗶𝗮𝘁𝗲 𝗥𝗲𝘀𝗶𝘀𝘁𝗮𝗻𝗰𝗲: 22,400–22,460
• 🟩 𝗡𝗲𝗮𝗿 𝗦𝘂𝗽𝗽𝗼𝗿𝘁: 22,300–22,250
• 📊 Sustained move above 22,460 may open room toward 22,540–22,620
• ⚠️ Slip below 22,250 can drag the index toward 22,180–22,000
⸻
⚠️ Disclaimer: Educational market observation. Not investment advice.
#Nifty #ChartStory #IndianMarkets #TechnicalView #PriceAction
Mar 30
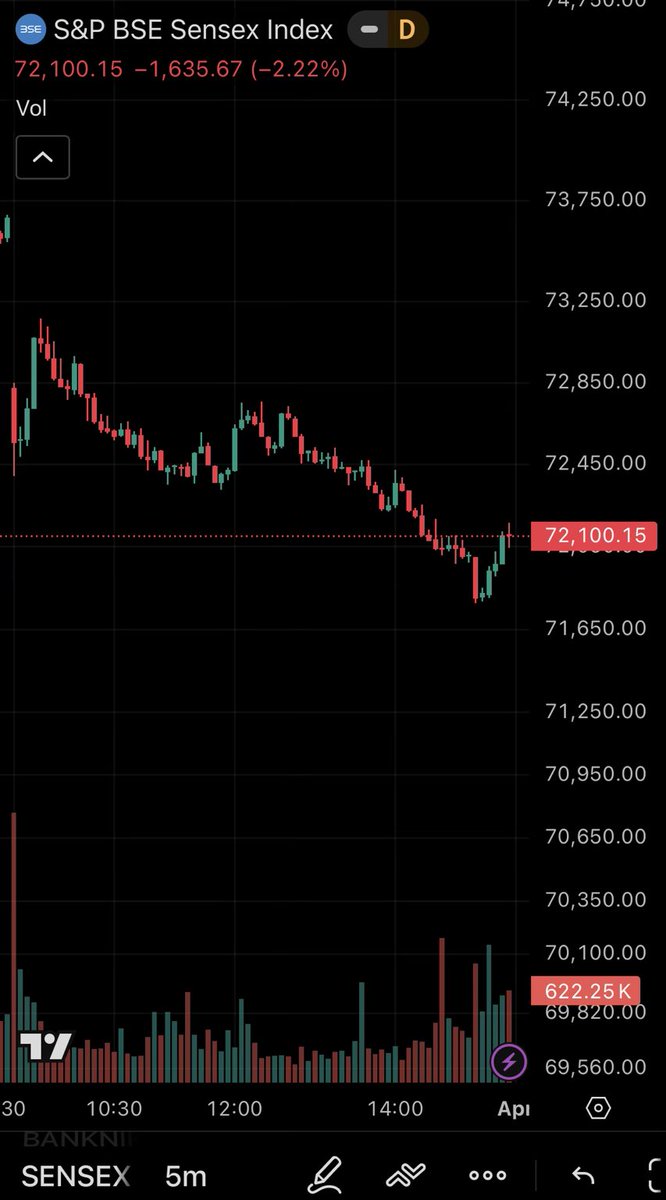
𝗦𝗘𝗡𝗦𝗘𝗫 𝗖𝗛𝗔𝗥𝗧 𝗦𝗧𝗢𝗥𝗬 — 𝟯𝟬 𝗠𝗔𝗥𝗖𝗛 𝟮𝟬𝟮𝟲
𝗚𝗮𝗽 𝗗𝗼𝘄𝗻 → 𝗘𝗮𝗿𝗹𝘆 𝗦𝗹𝗶𝗽 → 𝗠𝗶𝗱-𝗗𝗮𝘆 𝗣𝗮𝘂𝘀𝗲 → 𝗟𝗮𝘁𝗲 𝗦𝗲𝗹𝗹𝗶𝗻𝗴 → 𝗪𝗲𝗮𝗸 𝗖𝗹𝗼𝘀𝗲 📉
• 🔴 𝗦𝗵𝗮𝗿𝗽 𝗚𝗮𝗽-𝗗𝗼𝘄𝗻 𝗦𝘁𝗮𝗿𝘁: Sensex opened with a deep negative gap and immediate selling pressure, showing bears controlled the tape from the start.
• 🔻 𝗘𝗮𝗿𝗹𝘆 𝗗𝗼𝘄𝗻𝘀𝗶𝗱𝗲 𝗘𝘅𝘁𝗲𝗻𝘀𝗶𝗼𝗻: After the weak open, price kept slipping in the opening leg and quickly moved below the 72,850–72,700 area.
• 🟡 𝗠𝗶𝗱-𝗦𝗲𝘀𝘀𝗶𝗼𝗻 𝗣𝗮𝘂𝘀𝗲: Around the middle of the session, candles turned smaller and flatter near the 72,450–72,600 belt, suggesting temporary stabilisation, not reversal.
• 🔄 𝗪𝗲𝗮𝗸 𝗕𝗼𝘂𝗻𝗰𝗲𝘀 𝗙𝗮𝗰𝗲𝗱 𝗦𝘂𝗽𝗽𝗹𝘆: A few green candles appeared around noon, but every rebound was capped quickly, confirming a lower-high structure through the day.
• 🔴 𝗟𝗮𝘁𝗲 𝗔𝗳𝘁𝗲𝗿𝗻𝗼𝗼𝗻 𝗦𝗲𝗹𝗹𝗶𝗻𝗴: In the final stretch, the chart tilted lower again and price slipped toward the 71,750–71,650 zone, showing renewed weakness into the close.
• 🟡 𝗟𝗮𝘁𝗲 𝗣𝘂𝗹𝗹𝗯𝗮𝗰𝗸 𝗪𝗮𝘀 𝗦𝗵𝗮𝗹𝗹𝗼𝘄: The last candles showed a bounce from intraday lows, but the recovery stayed limited and the index still closed weak at 72,100.15.
• 📊 𝗩𝗼𝗹𝘂𝗺𝗲 𝗦𝗶𝗴𝗻𝗮𝗹: Volume was heavy at the open and picked up again in the final hour, suggesting stronger participation during decline phases and late distribution.
⸻
🔮 𝗡𝗘𝗫𝗧 𝗧𝗥𝗔𝗗𝗜𝗡𝗚 𝗢𝗨𝗧𝗟𝗢𝗢𝗞 — 𝟭 𝗔𝗣𝗥𝗜𝗟 𝟮𝟬𝟮𝟲
• 🟥 𝗜𝗺𝗺𝗲𝗱𝗶𝗮𝘁𝗲 𝗥𝗲𝘀𝗶𝘀𝘁𝗮𝗻𝗰𝗲: 72,150–72,300
• 🟩 𝗡𝗲𝗮𝗿 𝗦𝘂𝗽𝗽𝗼𝗿𝘁: 71,800–71,650
• 📊 Sustained move above 72,300 may open room toward 72,450–72,650
• ⚠️ Slip below 71,650 can drag the index toward 71,250–70,950
⸻
⚠️ Disclaimer: Educational market observation. Not investment advice.
#Sensex #ChartStory #IndianMarkets #TechnicalView #PriceAction
118