
May 1
ift.tt/gpZqbLo Unlock the power of AI for stunning charts, graphs, and data visuals! Elevate your presentations with crisp visuals that tell the story you want. #AI #DataViz #Charts #Presentations #VisualizationTips #StorytellingWithData #byAI
28

2 Dec 2025
Data visualization isn’t just about making charts , it’s about turning complexity into clarity. When done well, it amplifies cognition and helps stakeholders “see” what matters. #DataViz #Insights #ResearchTools #VisualizationTips #EliteResearch
technovation.org/blogs/funct….

48

20 Sep 2025
📊✨ Unveiling the Visual Magic! Discover the Sankey Chart: Master the Art of Data Flow Visualization! #SankeyMaster #DataViz #VisualizationTips #sankeymaster #sankey
👉apps.apple.com/app/apple-sto…
9

18 Aug 2025
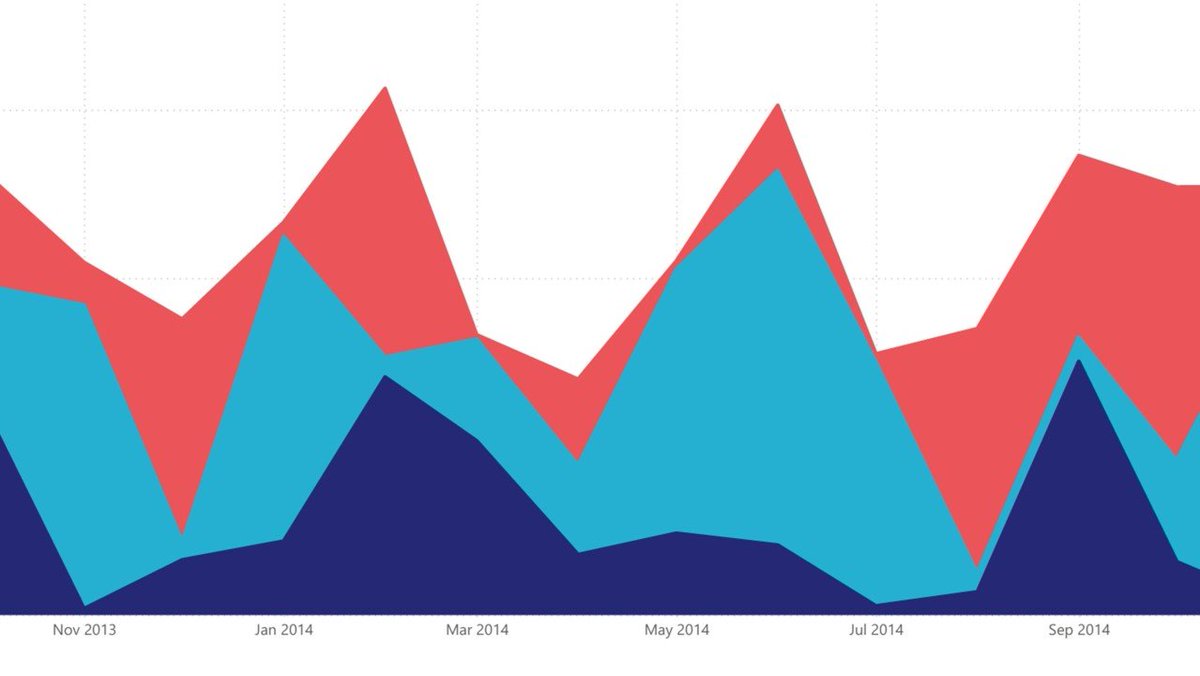
"An area chart tells not just what changed, but how much it mattered, visually amplifying the story of growth, decline, and contribution."
Let's dive into 'Area Charts in Focus' linkedin.com/pulse/area-char…
#AreaChart #ChartsInFocus #Data #DataVisualization #DataViz #Viz #Analytics #PowerBI #BusinessIntelligence #DataStorytelling #VisualizationTips #ChartDesign
3
62

15 Jul 2025
Visualize the feeling of achievement, not just the outcome. The sensory details make the difference! #VisualizationTips #SuccessHabits #Mindset
5


29 Jun 2025
You still have another 6 months to achieve your year goals
Visualization isn’t just seeing — it’s experiencing. ✨
Your mind creates what it truly feels. Let’s make those feelings powerful.
#VisualizationTips #ManifestYourDreams #SubconsciousPower #MindsetCoach #VisionBoardMagic
30
8 Jun 2025
Waterfall charts are powerful tools for visualizing step-by-step changes in values, helping you understand how individual factors contribute to a final result. In this article, I explore the essentials of waterfall charts and introduce variations like traditional waterfall, breakdown waterfall, positive-only waterfall and horizontal waterfall charts. Whether you are working in finance, operations, or analytics, this "Waterfall in Focus" guide will help you communicate cumulative change with clarity and impact 💡⚡
linkedin.com/pulse/waterfall…
#WaterfallInFocus #Data #DataVisualization #DataViz #Viz #Analytics #PowerBI 💛 #BusinessIntelligence #DataStorytelling #VisualizationTips #ChartDesign

2
37

5 May 2025
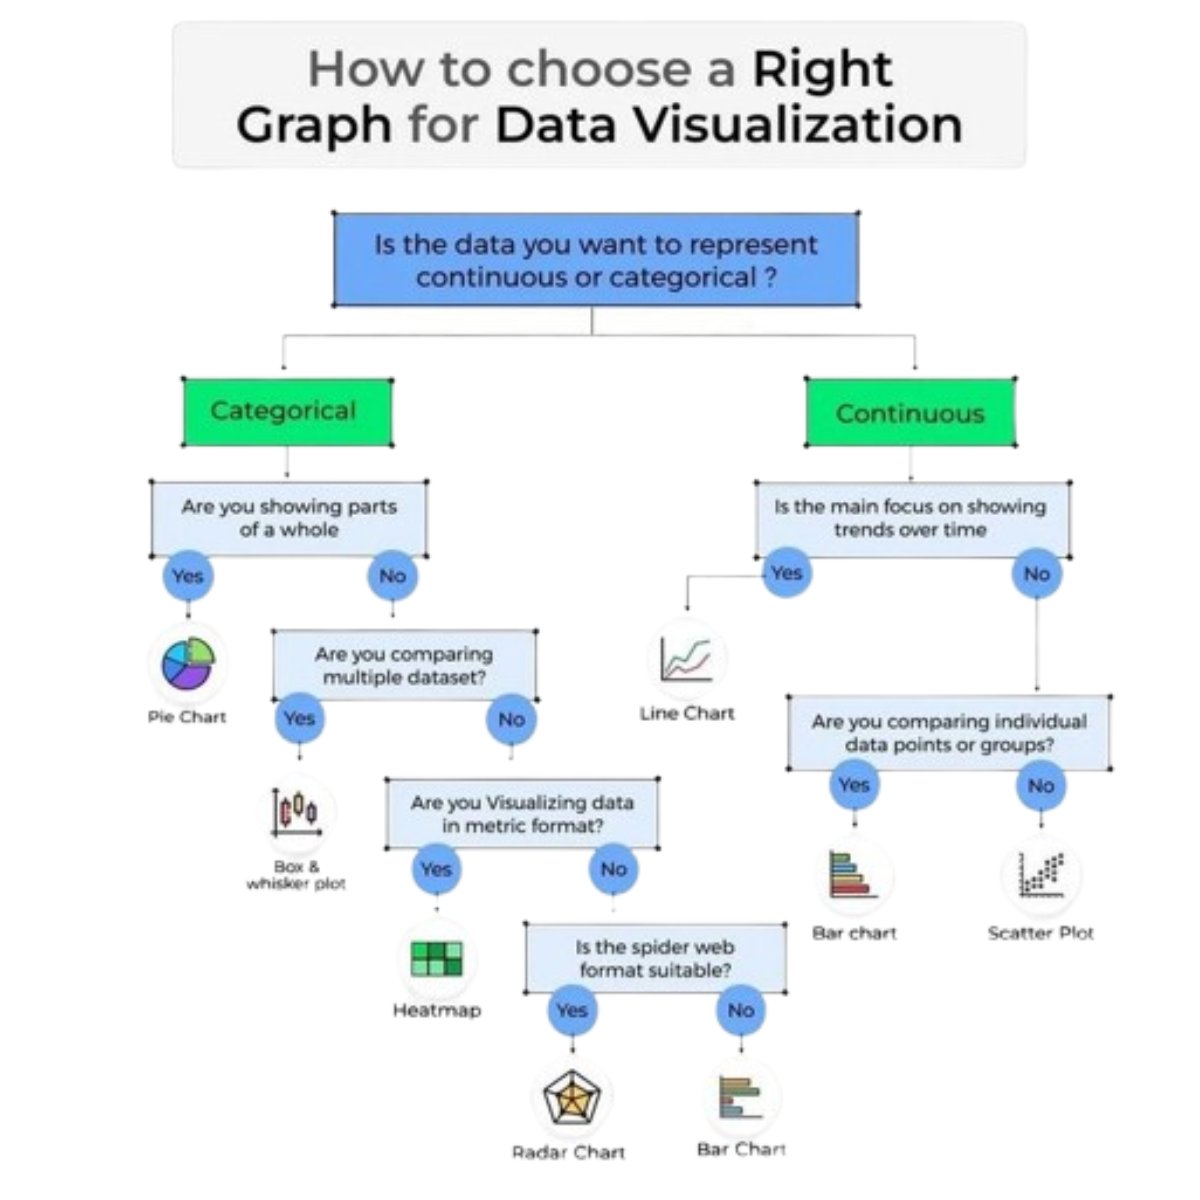
Choosing the Right Graph for Data Visualisation 📊
Data visualisation isn’t just about making charts look good, it’s about communicating insights clearly and effectively.
#DataAnalytics #DataVisualization #VisualizationTips #StorytellingWithData
1
2
42
22 Feb 2025
Scatter plots are a vital visual for uncovering relationships and correlations between variables 🔍 In this article, I delve into the core principles of scatter plots and explore advanced variations such as bubble, categorical scatter, quadrant, and volcano charts. If you are passionate about data 💡 this "Scatter in Focus" guide will take you on a quick journey through the world of scatter visualization!
Let's Focus linkedin.com/pulse/scatter-c…
#ChartsInFocus #ScatterInFocus #Data #DataVisualization #DataViz #ScatterPlots #Analytics #DataScience 🧪 #BusinessIntelligence 💡 #DataStorytelling #VisualizationTips ⚡ #PowerBI 💛

2
59

18 Feb 2025
Struggling to stay motivated? Try this: Close your eyes and vividly picture yourself achieving your goal. Feel the excitement, hear the applause, or see the success unfold. This mental rehearsal programs your brain for success! Give it a try today. #VisualizationTips
7
14 Feb 2025
Struggling to stay consistent with your goals? Try morning visualization! 🧘♂️ Close your eyes, see yourself achieving success, and feel the emotions of accomplishment. This primes your mind for action and keeps you focused. Start your day with intention! #VisualizationTips
44
6 Feb 2025
Struggling to stay motivated? Visualization can help! Before starting a task, close your eyes and picture yourself successfully completing it. Feel the confidence, see the results, and let that energy drive your actions. Try it today! #MindsetMatters #VisualizationTips
1
1
14
4 Feb 2025
Did you know your brain can’t tell the difference between a vividly imagined event and reality? This is why visualization is so powerful—it programs your mind for success. Close your eyes and picture your goals in detail. What does success look like to you? 🌟 #VisualizationTips
14
2 Feb 2025
Visualization isn't just daydreaming—it's training your brain! Studies show mentally practicing an action activates the same brain areas as doing it. Ready to harness this power in your life? Explore more at visualizeit.xyz/ 🧠✨ #VisualizationTips #MindsetMatters
7
29 Jan 2025
Ever wondered why visualization is so powerful? When you vividly imagine achieving your goal, your brain starts treating it as reality. This mental shift boosts focus, motivation, and confidence. Try it today and see the magic unfold! 💡 #VisualizationTips
13
27 Jan 2025
Feeling overwhelmed by your goals? Try this: close your eyes, take 3 deep breaths, and visualize the exact moment your goal is achieved. Feel the emotions and joy as if it’s happening now. This simple practice can shift your mindset and boost motivation. 🌟 #VisualizationTips #MindsetMatters
11
26 Jan 2025
Visualization isn't just daydreaming—it's a tool for success! Research shows that mentally rehearsing your goals can improve focus and performance. Close your eyes, see the win, and feel the victory. Want to dive deeper? Explore techniques at visualizeit.xyz/ 🌟 #VisualizationTips
18
25 Jan 2025
Struggling to stay focused on your goals? Visualization can help! 🧠✨ Close your eyes, take a deep breath, and imagine yourself achieving your dream. Feel the success, the joy—make it real in your mind. Dive deeper here: visualizeit.xyz/ #ManifestYourLife #VisualizationTips
17

21 Jan 2025
Check out these data visualization tips that we have put together to help you, as a data analyst.
linkedin.com/posts/tequant_d…
#dataanalysis #visualizationtips
1
2
321