
Joined August 2008
- Tweets 432
- Following 130
- Followers 91
- Likes 355
11 Photos and videos


18 Mar 2022
This year I plan to use more tools on this challenge so I can reach 15 📊 :D #30DaysChartChallenge2022
3
Ines Teacă retweeted

13 Jan 2022
R-Ladies Edinburgh is looking for new co-organisers. We are happy to help anyone interested during the transition. DM @minebocek or @Karimsinha if you're interested.
1
7
8
Ines Teacă retweeted

1 Oct 2021
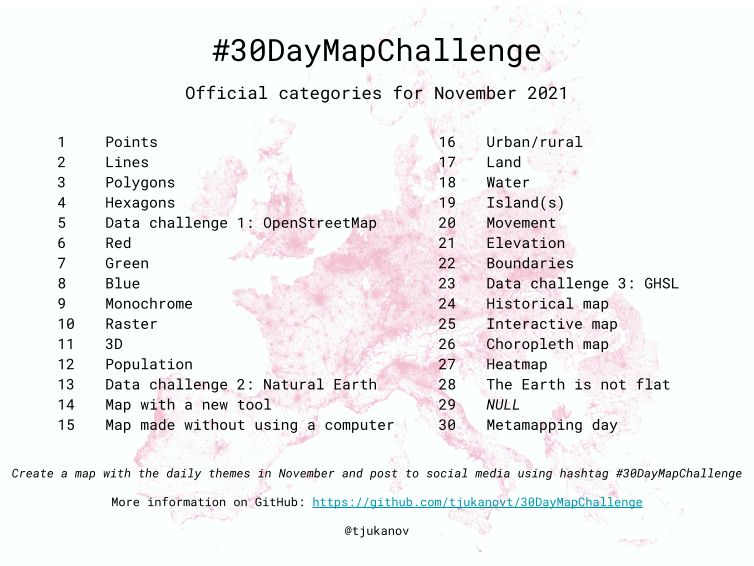
🎉Categories for #30DayMapChallenge 2021 🎉
Join in to create maps around these themes. Use your creativity and share your results with others! Starts 01/11/2021.
More information: github.com/tjukanovt/30DayMa…
18
296
822
15 Jun 2021
Let's talk about challenges that take your (R) coding skills to the next level #rladies . See you tonight at 7PM EET!
15 Jun 2021

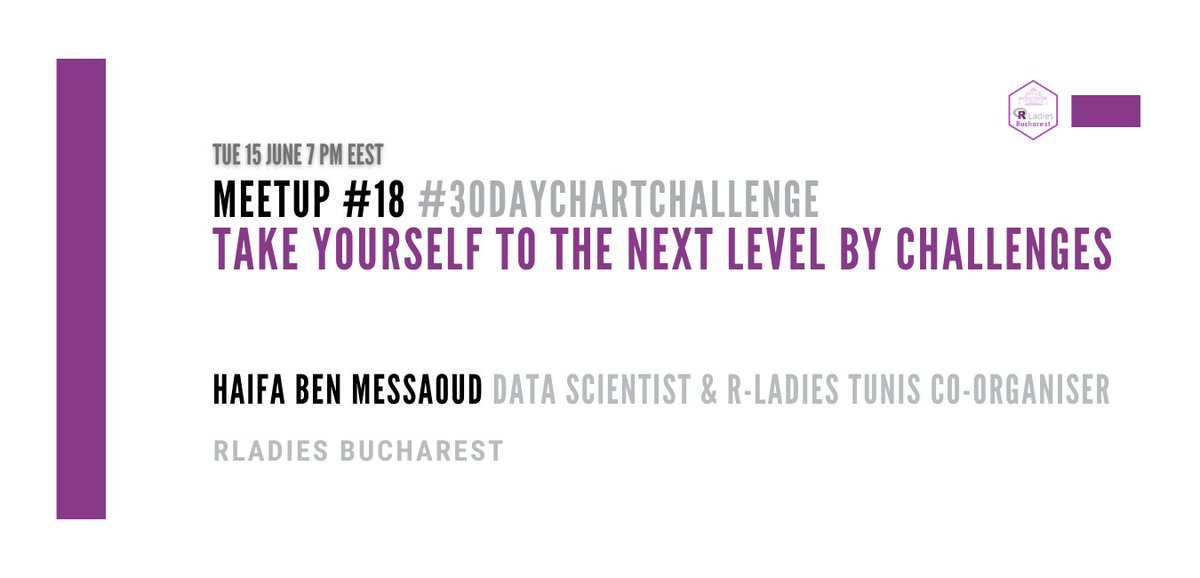
See you tonight at 7PM EET for a new session ! We continue our meetups with #goodRvibes and a talk on challenges effect & the 30daycharchallenge with Haifa Ben Messaoud, co-organizer R-Ladies Tunis & Data Scientist! meetup.com/rladies-bucharest…

1
Ines Teacă retweeted

11 Jun 2021
I will be giving a talk about my participation in #30daychartchallenge and #Tidytuesday to improve my #RStats skills at @rladiesbuchares
For more details check their meetup page :
meetup.com/rladies-bucharest…
3
8
Ines Teacă retweeted

8 Jun 2021
Join us for a new session on the 15th of June, 7PM EET ! We continue our meetups with #goodRvibes and a talk on challenges effect on your R skills with Haifa Ben Messaoud, co-organizer R-Ladies Tunis & Data Scientist! meetup.com/rladies-bucharest…
2
2
Ines Teacă retweeted

6 May 2021
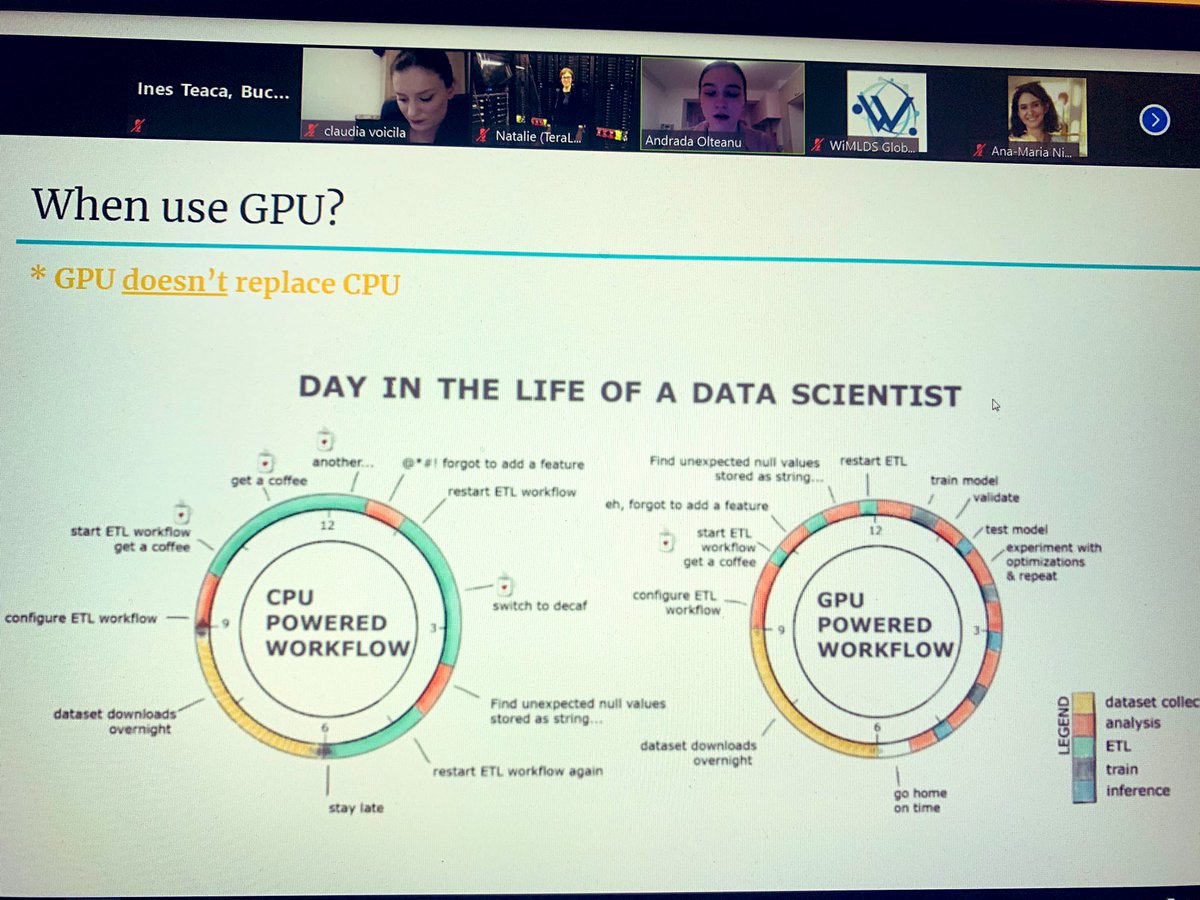
The content from our #WiMLDSOnline meetup with #WiMLDS Bucharest is OUT!
📺 The video
📰 The slides
🖥️ All the tech content shared by @andradaolteanuu, Ana-Maria Niculescu & Denisa Banulescu-Radu from @Laboratoire_LEO
#WiMLDSParis #WiMLDS #WomeninTech
wimlds-paris.medium.com/33-p…
4
8
13 Apr 2021
Another inspiring talk of Ana-Maria Niculescu on 🤩 R and clouds #rladies


1
2
13 Apr 2021
1
3
11
13 Apr 2021
Soon😎
13 Apr 2021
Tonight we are live with 3 speakers and the Bucharest #WiMLDS chapter! 🇷🇴❤️🇫🇷
Join us online to hear about #Fraud, #RAPIDS, #Kaggle, #RStats & #AWS. More details ⬇️ @andradaolteanuu @Laboratoire_LEO @Univ_Orleans
meetup.com/Paris-Women-in-Ma…
3
3
13 Apr 2021
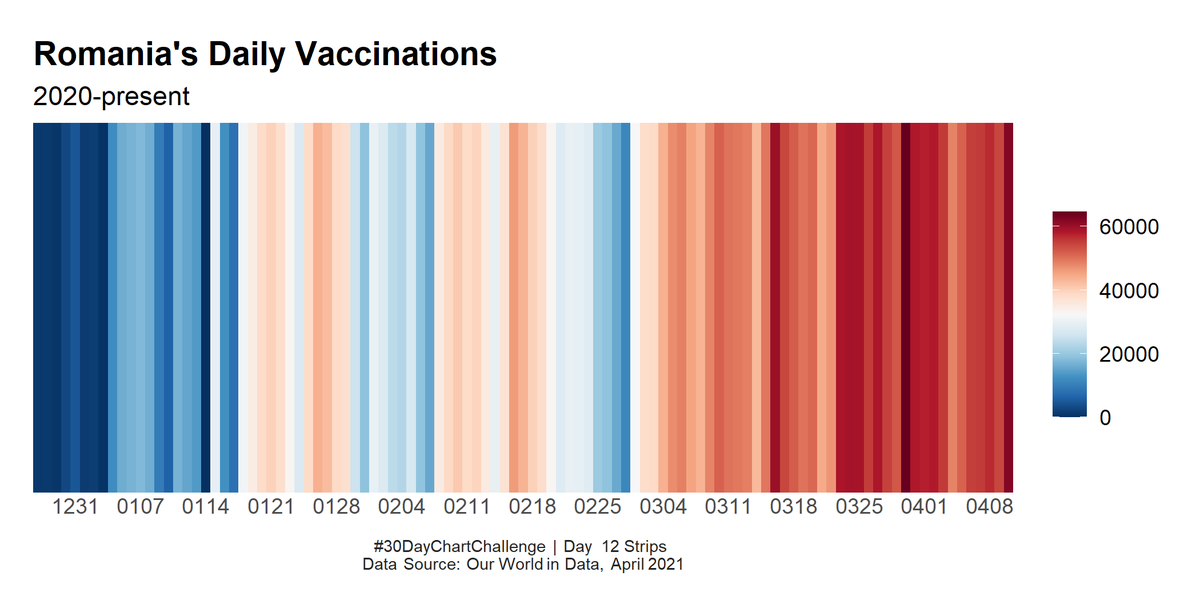
#30DayChartChallenge! This is only a replica using @dr_xeo tutorial on strips with R. I am totally charmed by the power of mixing wise the colors...
🗓️ Day 12. Strips @30DayChartCall
Data source: data.World
1
1
5
Ines Teacă retweeted

11 Apr 2021
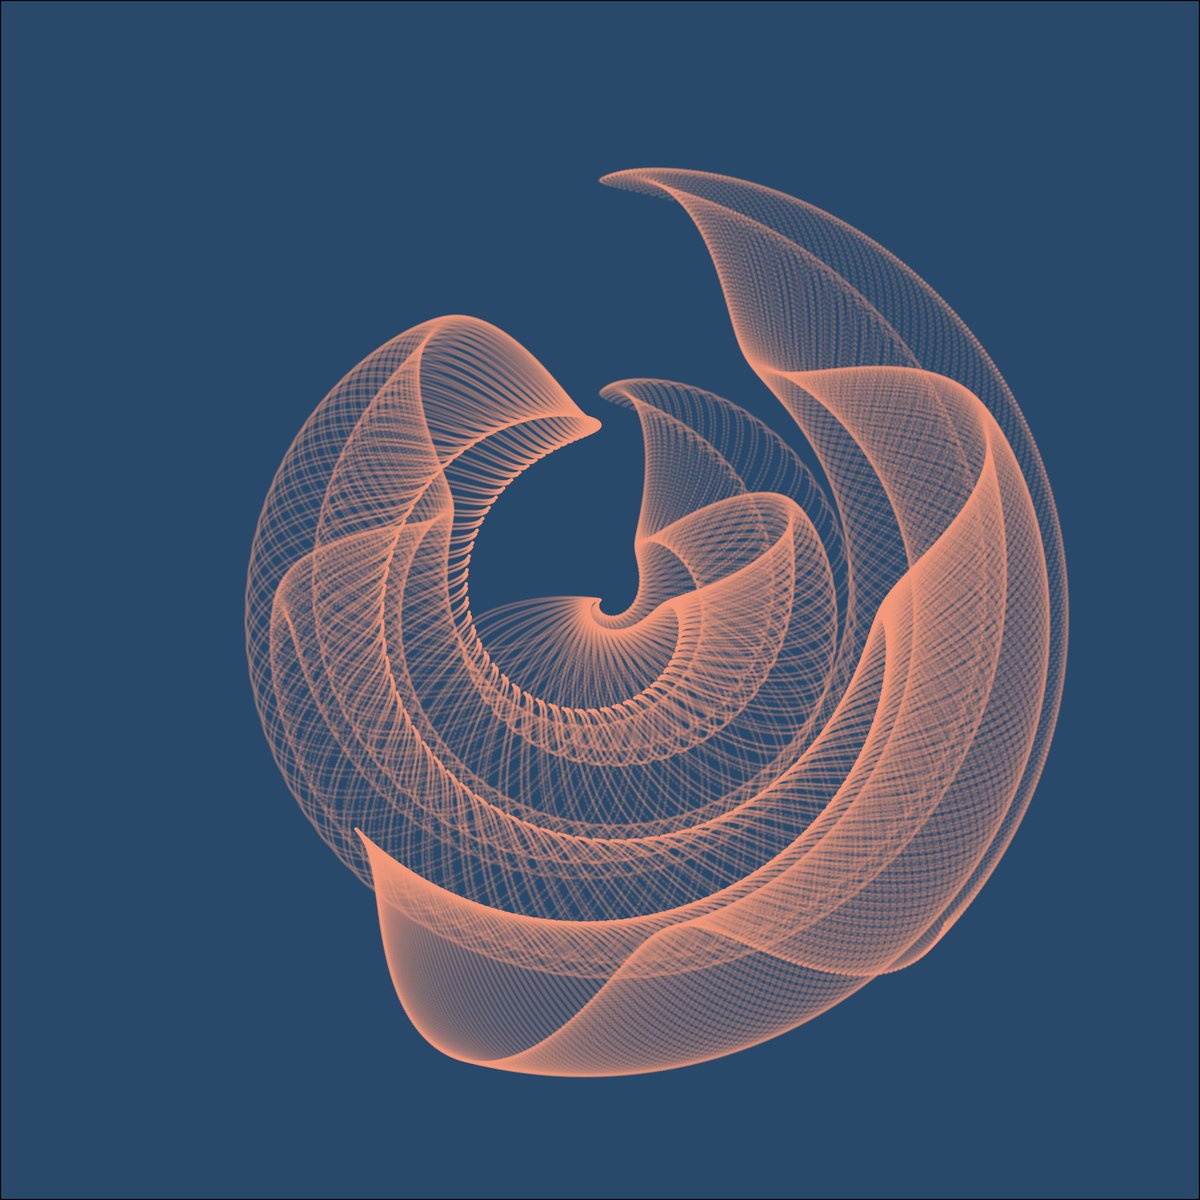
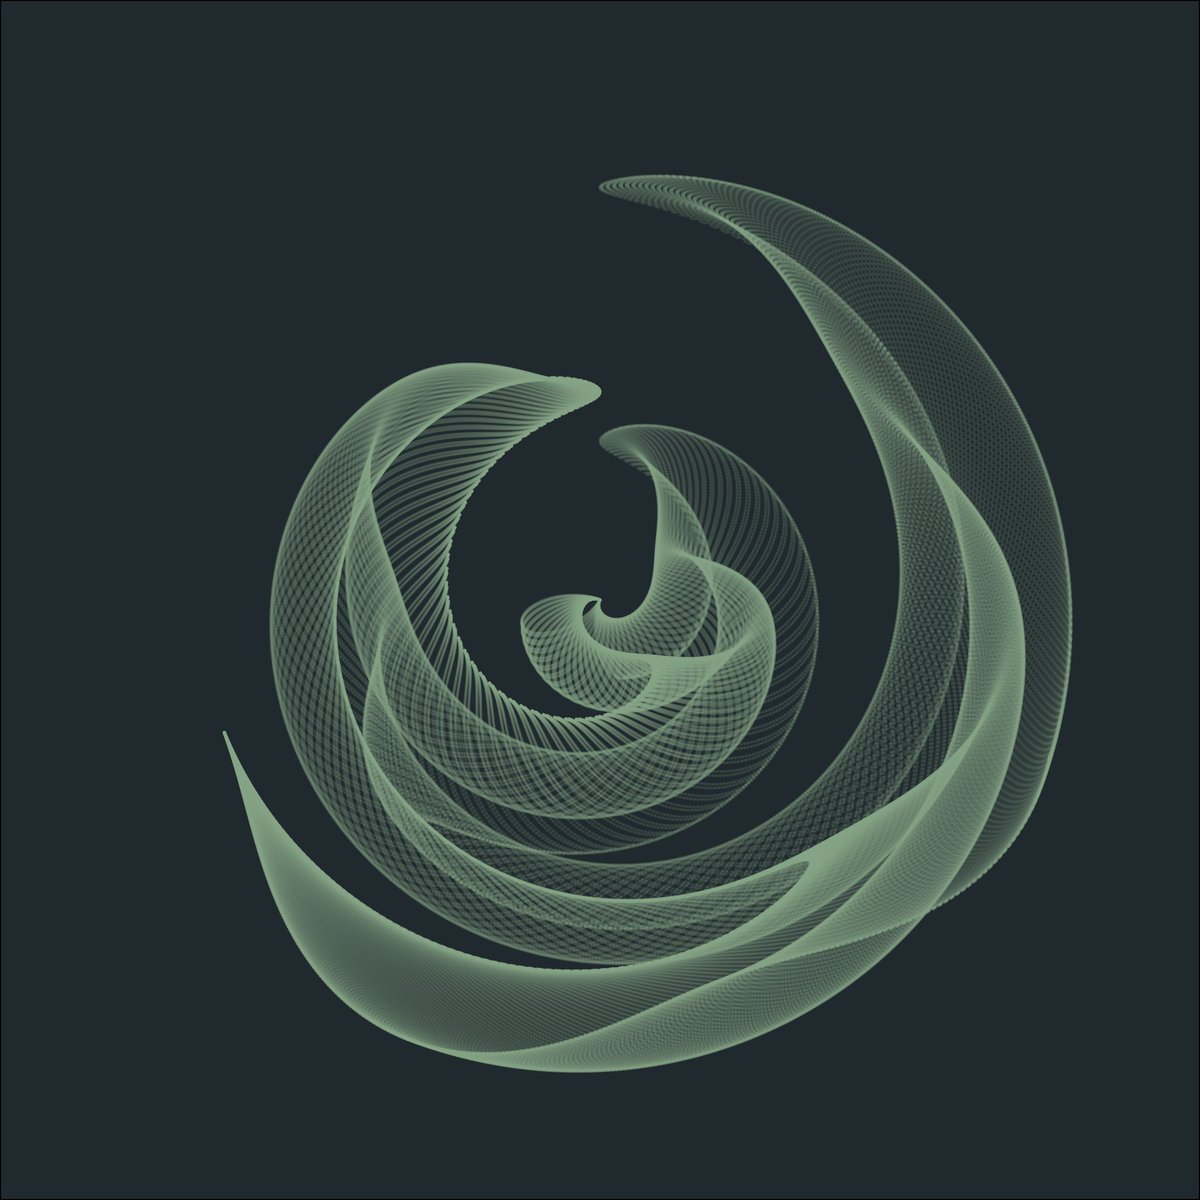
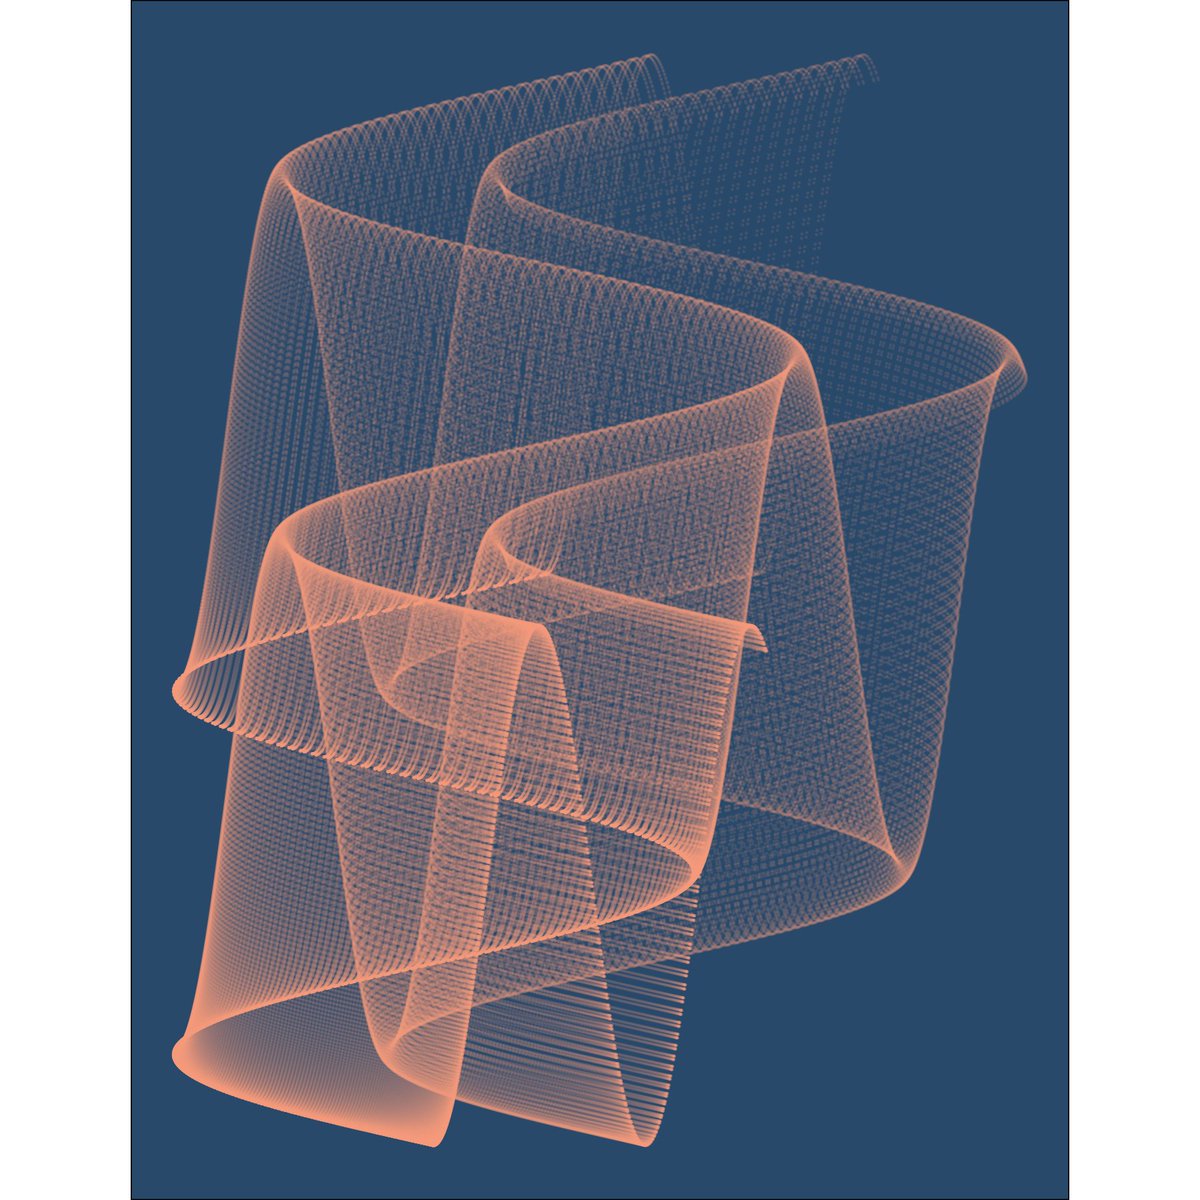
#30DayChartChallenge day 10: abstract
I also interpreted today's theme abstractly... and made some generative art with the #generativeart R package!
(github.com/cutterkom/generat…)
so gorgeous and so much fun!
#rstats #dataviz #Rtistry

1
10
92
11 Apr 2021
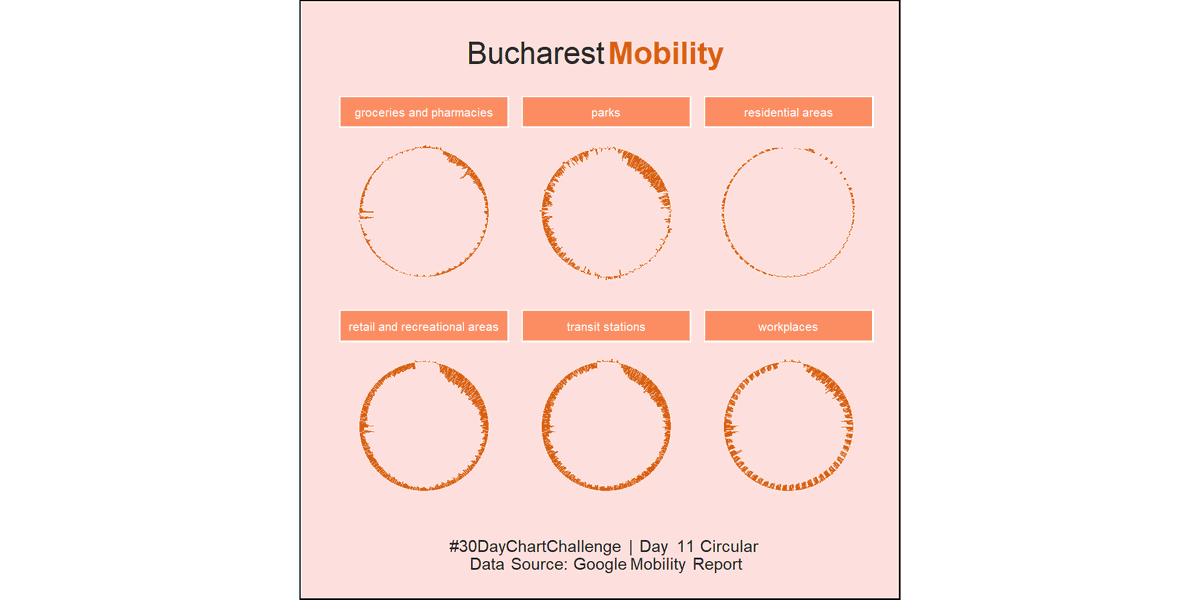
#30DayChartChallenge! Lack of originality on my side, so I continued with mobility data for circular and played with facet_wrap option.
🗓️ Day 11. Circular @30DayChartCall
Data source: Google Mobility Report
1
5
9 Apr 2021
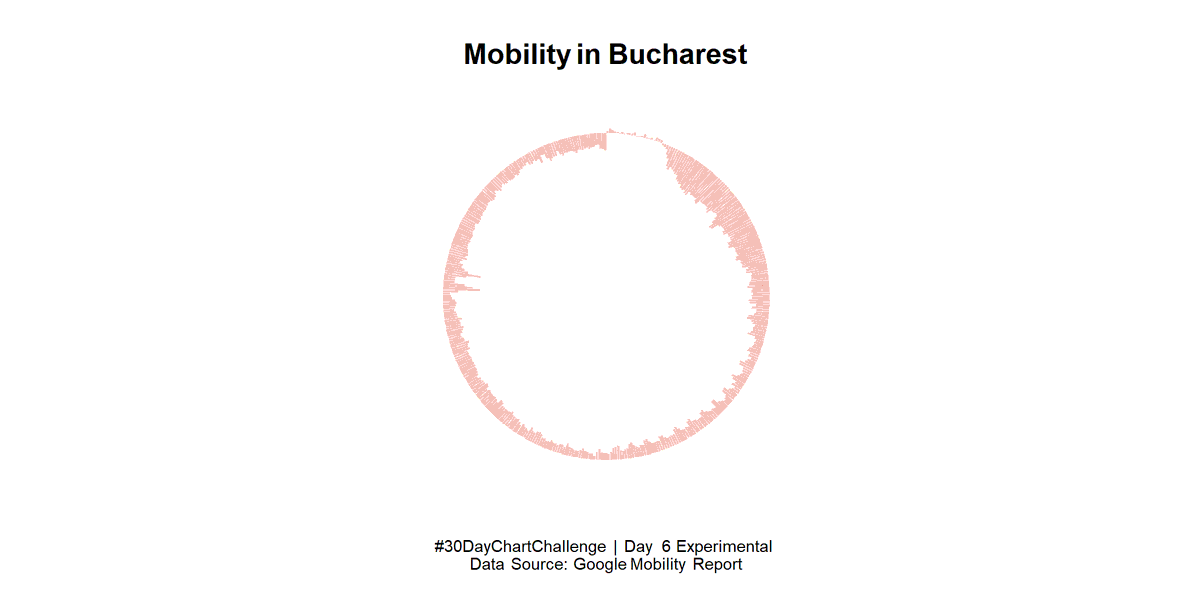
#30DayChartChallenge! Playing with mobility data for Bucharest and circular barplot.
🗓️ Day 6. Experimental @30DayChartCall
Data source: Google Mobility Report
1
8
Ines Teacă retweeted

8 Apr 2021
I'm trying to catch up with the #30DayChartChallenge, Day7: physical, I looked at the age & sex distribution of the medalists in the Summer Olympic Games, I found the dataset on #Kaggle.
Code : git.io/JYHpI
#rstats #dataviz
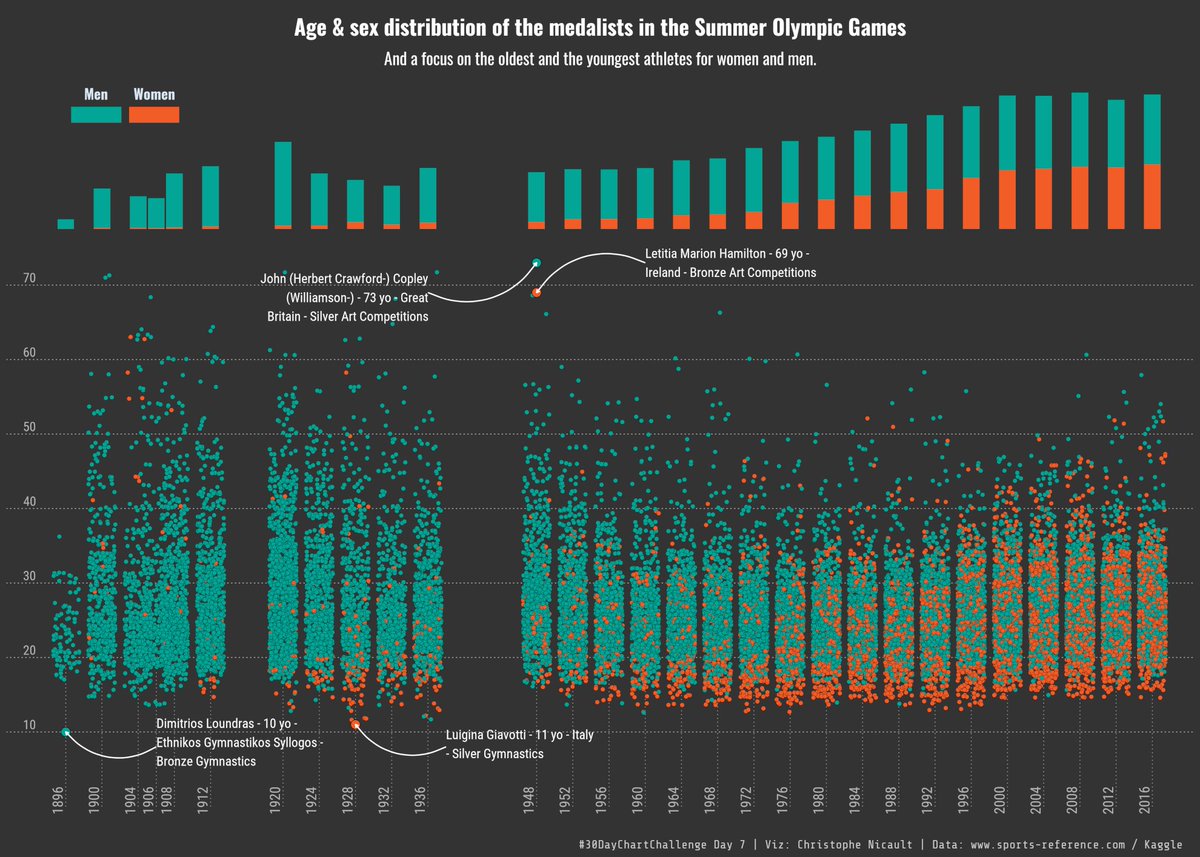
ALT Age & sex distribution of the medalists in the Summer Olympic Games
2
19
118
Ines Teacă retweeted
8 Apr 2021
Next week, we host an amazing online meetup with the Bucharest chapter.
Learn about #R models in #AWS, #FraudDetection & #RAPIDS with @andradaolteanuu !
More details ⬇️
meetup.com/Paris-Women-in-Ma…
2
3
5 Apr 2021
Women median earnings index 2019-2020 #30DayChartChallenge!
🗓️Day 5. Slope @30DayChartCall
Data source: TidytuesdayR
1
6