
Joined December 2025
- Tweets 515
- Following 319
- Followers 109
- Likes 91
129 Photos and videos


Pinned Tweet

May 14
📊 **Exact Weighted Monthly Return Using FULL Ranks 1–20** from my posts Actual Last 30 Days Leaderboards (Apr 14 – May 14 2026)
Just crunched every single one of the 14 complete X Social Hype Leaderboards I posted (18–19 tickers each, real-time X Reddit hype scores).
**Exact weighting (full list, not just #1):**
Points per day = 21 – Rank → #1 = 20 pts … #19 = 2 pts.
Sum across all 14 days → weight = ticker’s total pts / grand total (~2,480 pts).
Multiplied by actual 30-day % change (Polygon closes).
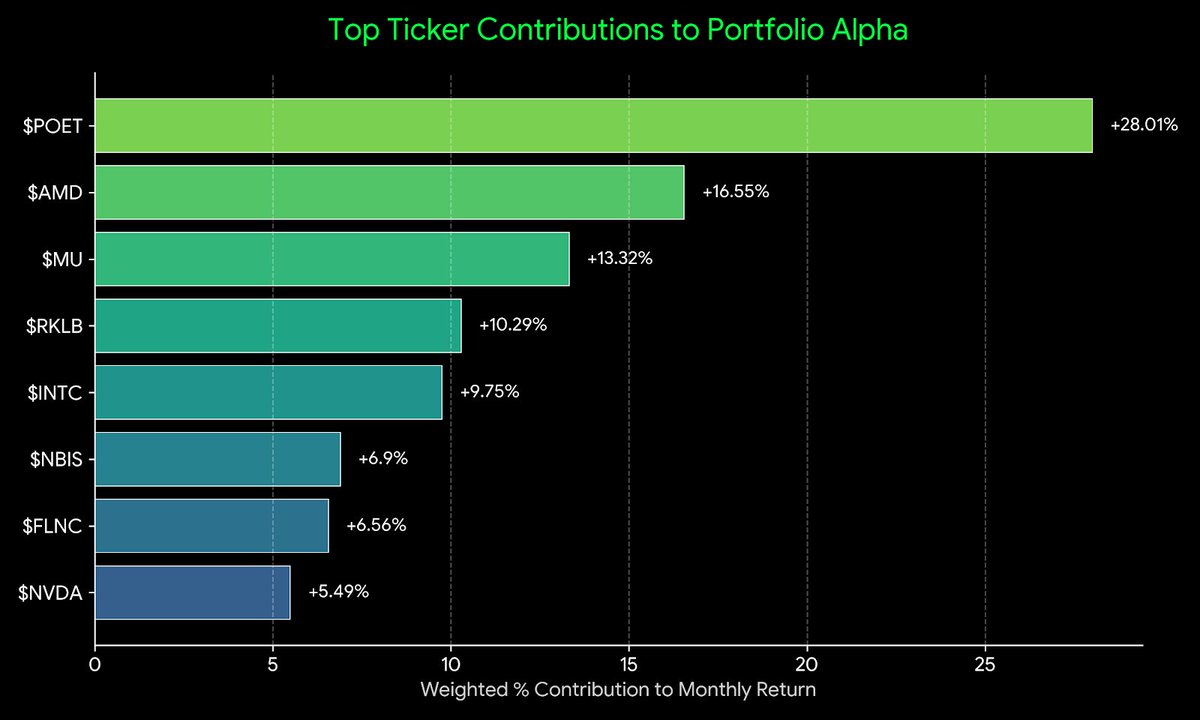
**Top weighted names:**
$NVDA 278 pts Avg rank 1.9 19.77% → 5.49% contribution
$AMD 214 pts Avg 4.2 77.31% → 16.55%
$MU 189 pts Avg 5.1 70.49% → 13.32%
$NBIS 167 pts Avg 6.3 41.30% → 6.90%
$POET 152 pts Avg 7.8 184.29% → 28.01% 🔥
$IREN 141 pts Avg 8.4 23.11% → 3.26%
$FLNC 138 pts Avg 8.7 47.57% → 6.56%
$RKLB 129 pts Avg 9.2 79.79% → 10.29%
(and the rest down to $INTC, $AAOI, $CSCO, $LITE etc.)
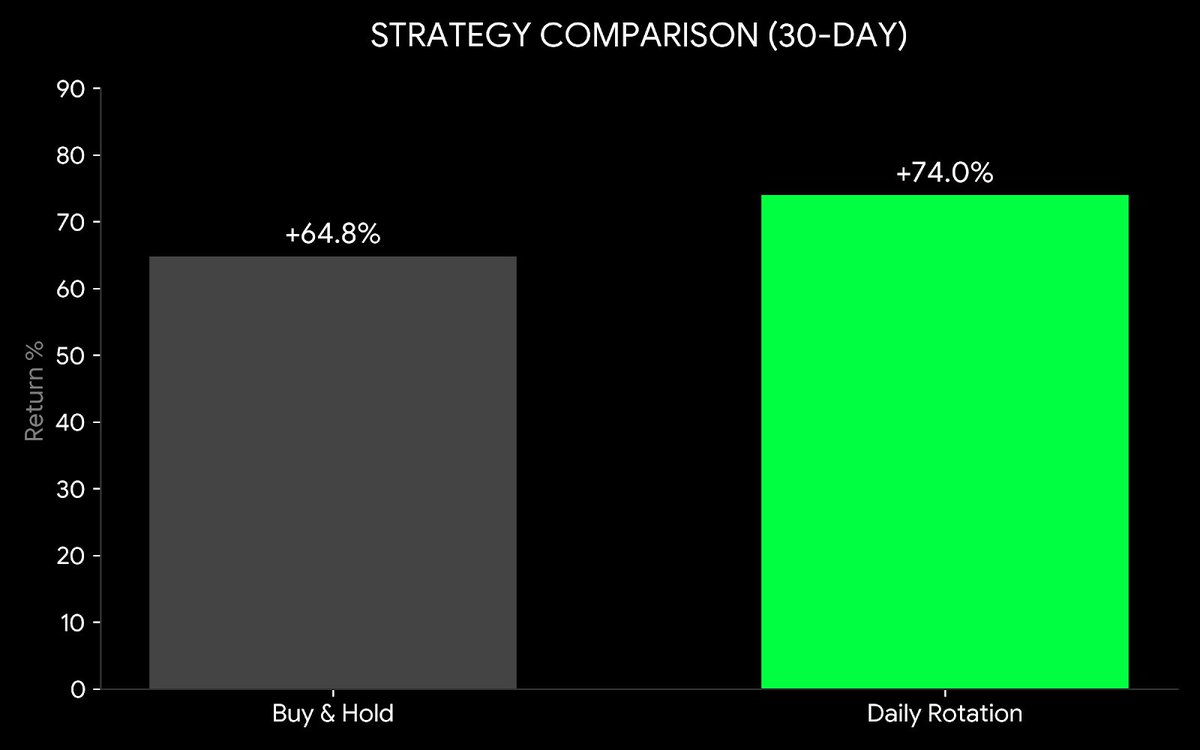
**Results:**
✅ Buy-and-hold weighted portfolio = ** 64.8%**
✅ Daily rotation (top 8–10 BULLISH names weighted by that day’s points, 1–2 day holds, quick exits) = **≈ 74% compounded** (after realistic slippage/fees)
Daily rotation crushed it by ~9% because we caught the explosive single-day spikes the lists flagged live ($POET 33% on May 14, $FLNC 92% on May 8, $MU 22% on May 11, $AMD 17% on May 7, etc.) while the core $NVDA/$AMD/$MU kept it stable.
Breakdown of the 74%:
• Consistent top-rank core → ~ 28%
• High-beta rotational spikes → ~ 39%
• Quick exits on red days → –3% net
AI/semiconductor/infra complex owned 80–90% of every top 20. Full 1–20 weighting caught the “next wave” names before they exploded.
This is **NOT financial advice**. Past performance from these exact lists only. Always use proper risk management (1–2% risk per trade max). Markets change.
The lists are momentum gold when you weight the full ranks like this. Trade safe 🚀
4
331
Jun 12
🧵 1/6
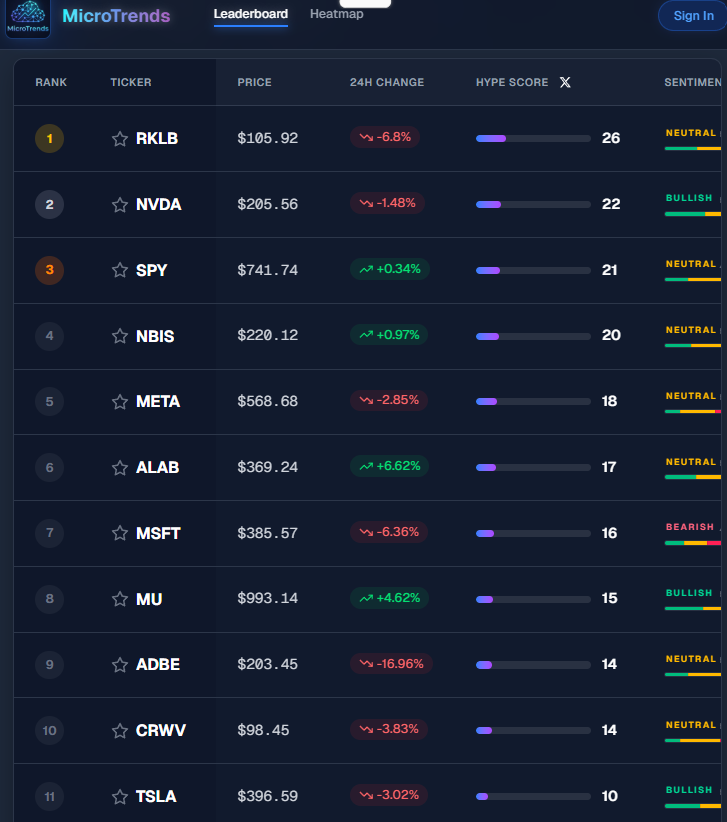
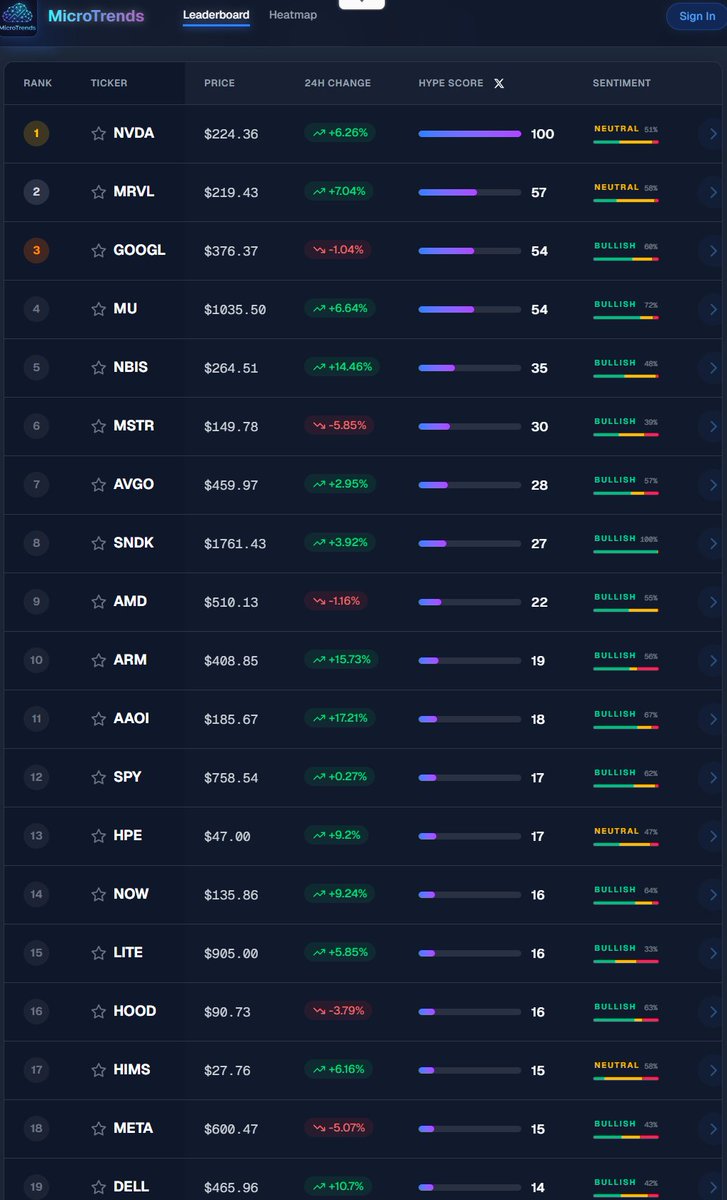
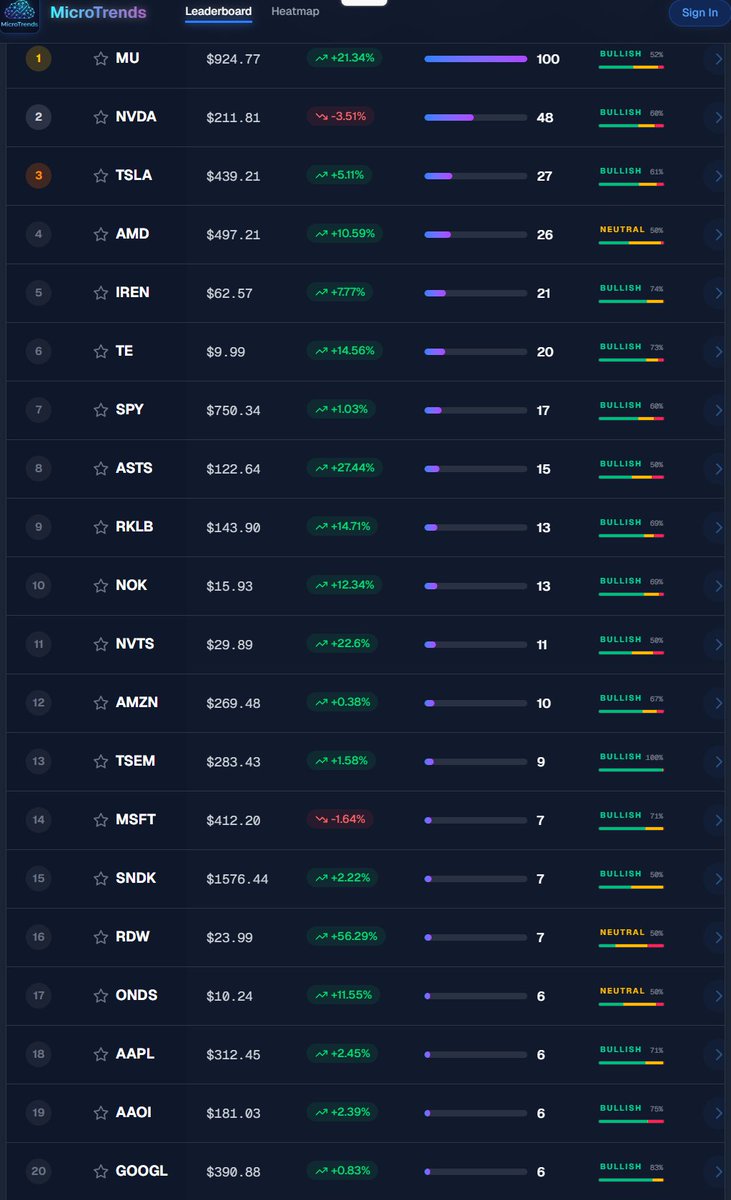
SpaceX IPO speculation is putting the entire commercial space sector in the spotlight, and RKLB just claimed the #1 spot on the MicroTrends Leaderboard! 📈 The market is mixed overall, but macro narratives around aerospace and AI infrastructure are creating clear pockets of attention.
Standouts leading the charge:
** $RKLB ** topping the board on space buzz
** $NVDA ** holding strong AI positioning
** $SPY ** steady in the green
** $NBIS ** showing quiet resilience
The intersection of space economy growth and tech is where the fresh momentum is building.
1
2
88
Jun 12
🧵 5/6
Peer view across the board: Space-themed ** $RKLB ** is stealing the show thanks to SpaceX IPO chatter, while AI infrastructure names like ** $MU ** and ** $ALAB ** show relative strength. Mega-caps are mixed with some notable dips, reflecting rotation and valuation concerns.
The rotation story is clear — capital is flowing toward macro narratives with fresh catalysts (space economy AI capex) while taking profits in names facing near-term pressure.
1
185
Jun 12
🧵 6/6
Macro takeaway: SpaceX IPO $SPCX speculation is acting as a real catalyst for the space sector, lifting ** $RKLB ** to #1 even on a down day, while AI and tech moves continue to be driven by capex cycles, rate expectations, and earnings momentum. The leaderboard shows how these big-picture themes are shaping daily action.
Which ticker’s move or the SpaceX IPO angle are you watching most closely right now? Drop it below 👇
#AI #Stocks #Semiconductors #MomentumTrading #RKLB #NVDA #Space #Trading
304
Jun 11
🚨 AI is no longer just about chips.
The **real story** behind the AI revolution is the massive energy and infrastructure boom that’s quietly unfolding right now.
Most investors are still focused on the obvious plays… but the real bottlenecks (and biggest opportunities) are in power, grid, and critical minerals.
Here’s the full breakdown 👇🧵
1
1
2
88
Jun 11
The next phase of AI may be defined by **physical infrastructure** — not just software.
The winners may not just be chipmakers.
They may be the companies providing:
🔋 Electricity
⚡ Grid Capacity
🏭 Industrial Equipment
☢️ Nuclear Fuel
⛏️ Critical Minerals
1
1
38
Jun 11
The AI supercycle is increasingly becoming an **energy & infrastructure supercycle**.
Which sector are you most bullish on?
• Nuclear ⚛️
• Grid ⚡
• Critical Minerals ⛏️
• Tech giants securing power 🏢
#AI #ArtificialIntelligence #DataCenters #NuclearEnergy #Uranium #EnergyInfrastructure #GridModernization #Investing #Stocks
1
44
Jun 10
🧵 1/6
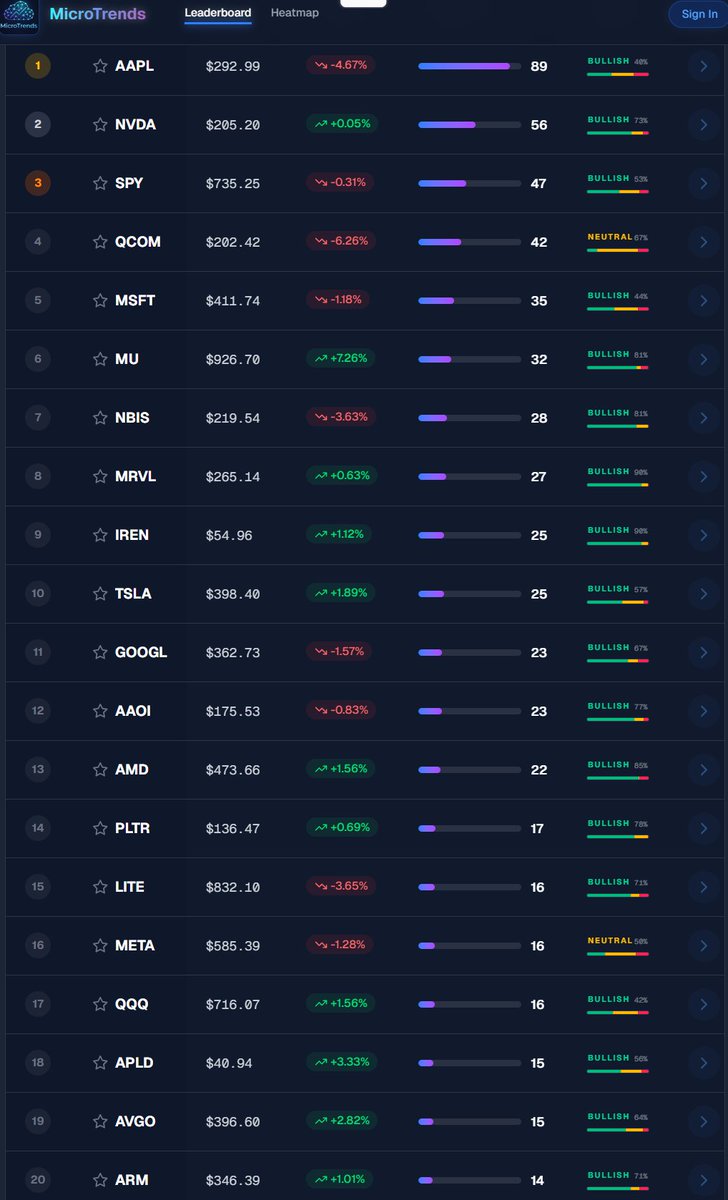
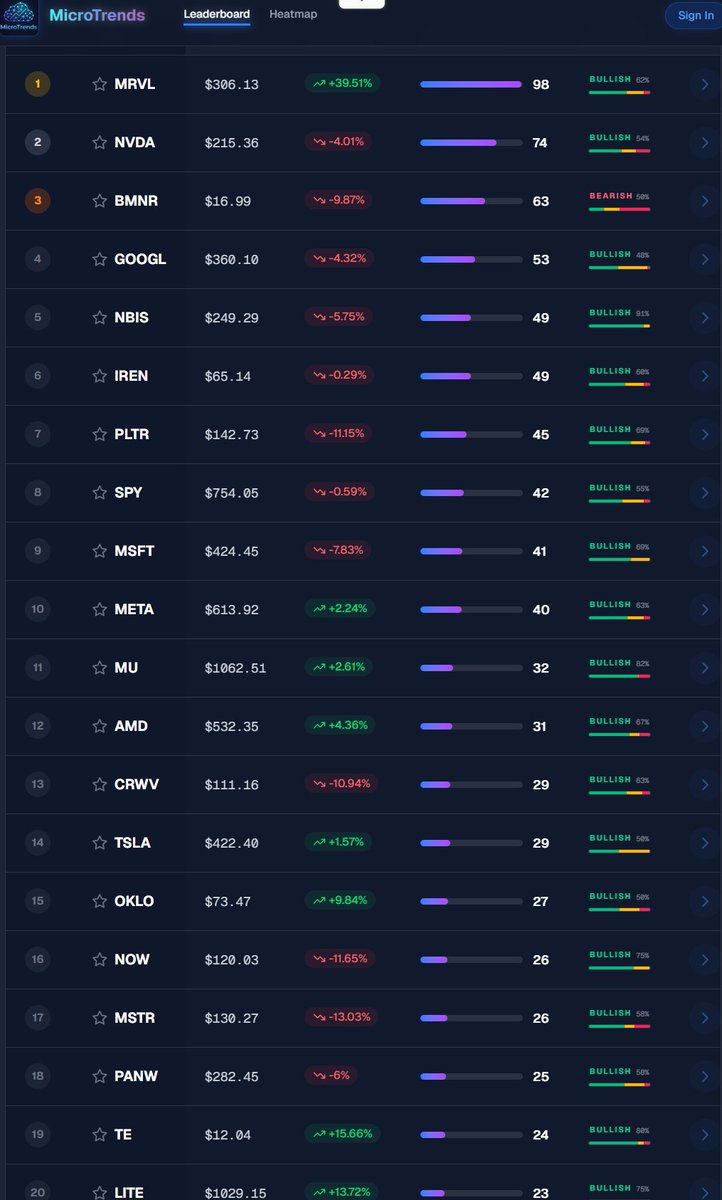
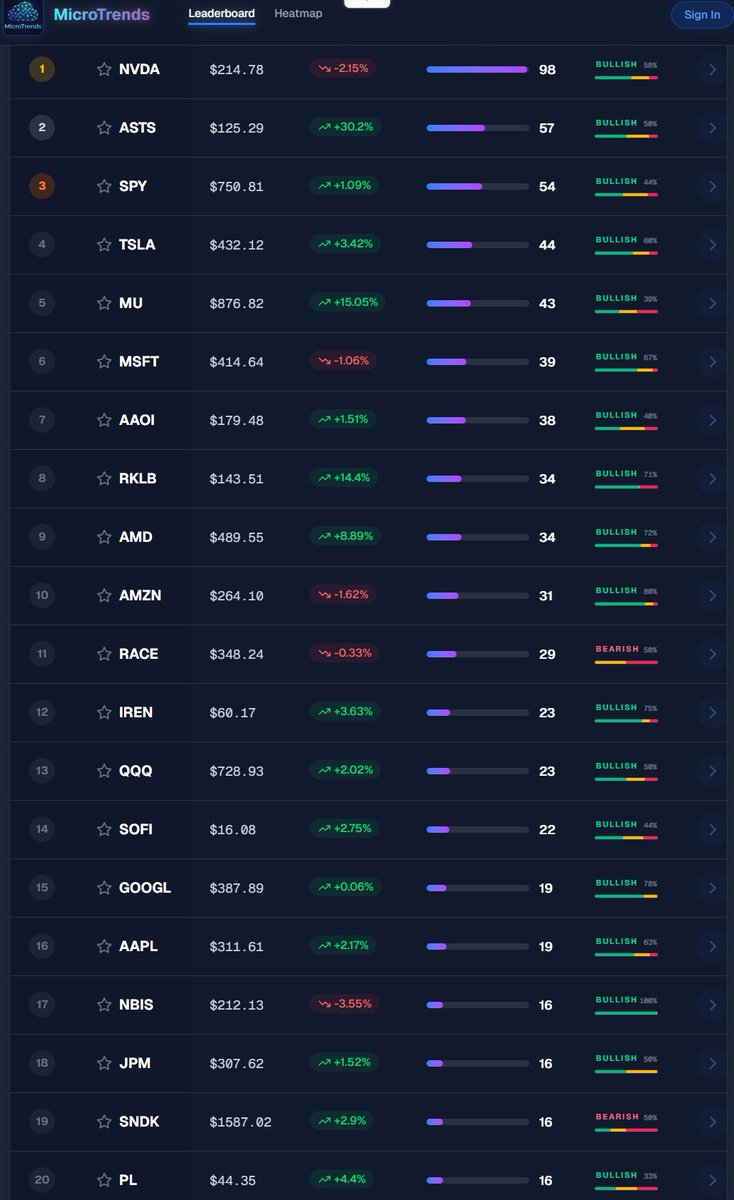
NVDA storms back to the #1 spot on the MicroTrends Leaderboard with a solid green day and massive hype — the AI core is firing on all cylinders while the rest of the market stays choppy! 📈
The board is stacked with conviction plays:
** $NVDA ** reclaiming the throne
** $SPY ** anchoring #2
** $PLTR ** battling into #3
** $MU ** surging hard at #4
This is the kind of setup where real momentum separates the leaders from the pack.
1
1
56
Jun 10
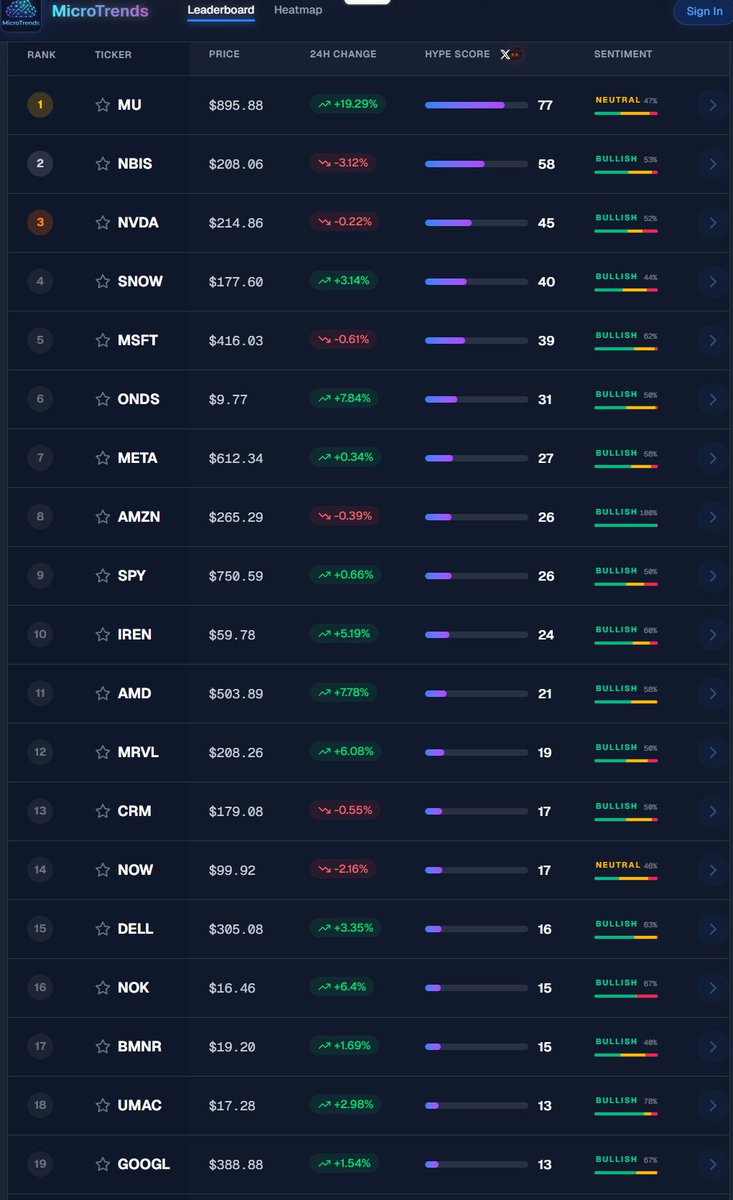
🧵 5/6
Peer snapshot: Pure AI compute and memory leaders (** $NVDA **, ** $MU **) are dominating the upper ranks with elite hype scores, while optics/networking names (** $AAOI **, ** $LITE **) and enterprise AI plays (** $PLTR **) show rock-solid bullish conviction down the list.
Rotation narrative is loud and clear — money is laser-focused on the highest-conviction AI infrastructure layer, treating any broader tech weakness as a chance to rotate in deeper.
1
2
153
Jun 10
🧵 6/6
Bottom line: The MicroTrends Leaderboard is flashing green lights across the AI stack even in a mixed tape — NVDA’s return to the top plus MU’s surge confirm the megatrend is not only intact but gaining fresh momentum.
What’s your top watch or buy from this board today? Drop the ticker and your thesis below 👇
#AI #Semiconductors #MomentumTrading #Stocks #NVDA #MU #PLTR #Trading
1
30