
Powerful visualization and analytics platform for guiding risk-related decision making.
- Tweets 255
- Following 5
- Followers 38
- Likes 3


ALT A map of ICEYE flood depth data and impacted policy locations, visualized in the Opterrix platform.

ALT A map of ICEYE flood-depth data and impacted policy locations in Everson, Washington, visualized on the Opterrix platform.
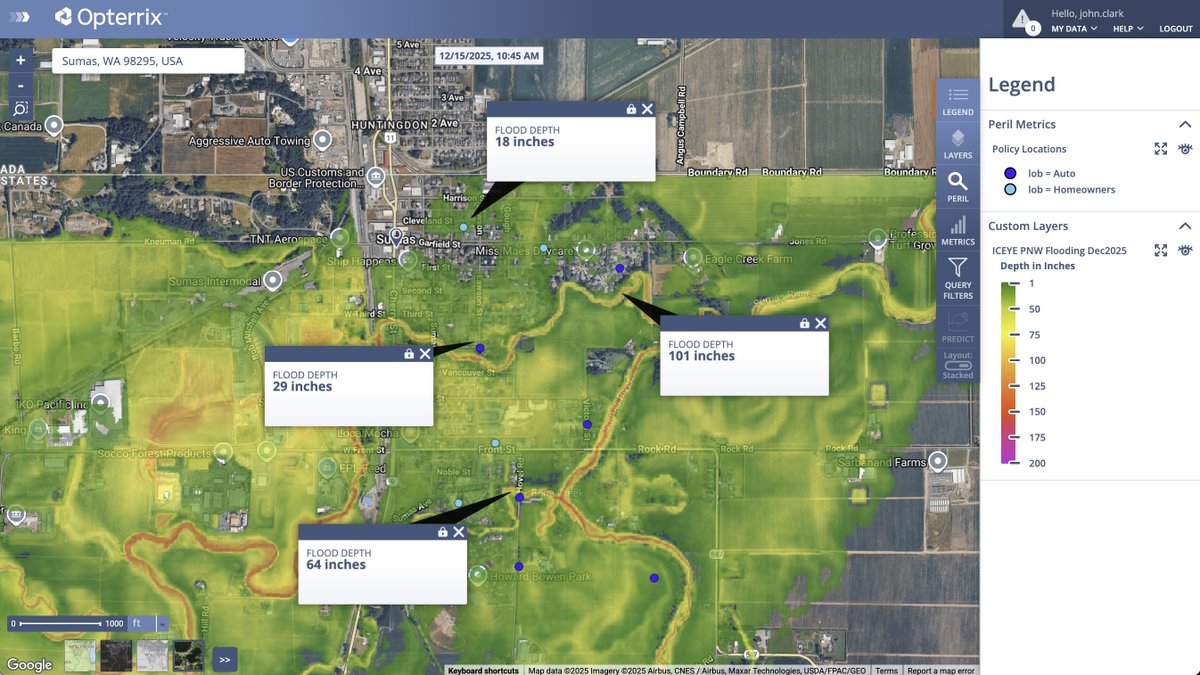
ALT A map of ICEYE flood-depth data and impacted policy locations in Sumas, Washington, visualized on the Opterrix platform.
ALT Map of the Opterrix Underwriting & Book Assessment module visualizing capacity limits in a 3-mile hex grid for Chicago.
ALT FEMA flood map for Apalachicola, Florida, visualized in the Opterrix Underwriting Module.
ALT A detailed map of Louisiana and Mississippi's Gulf coastline data from Natural Earth, and visualized in the Opterrix platform.
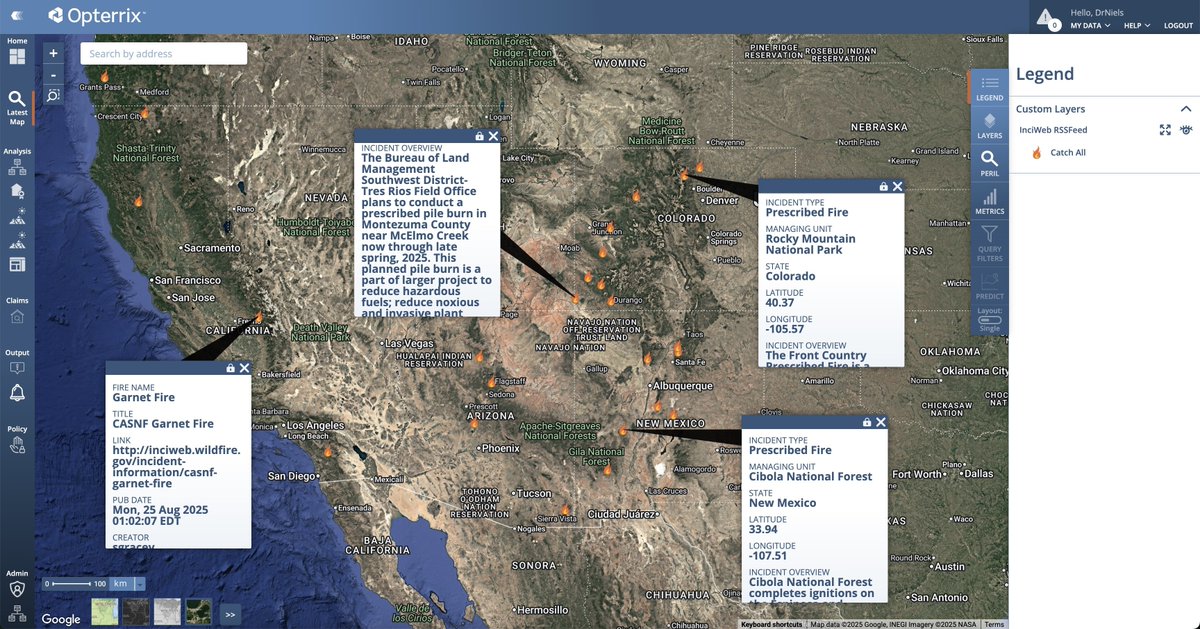
ALT A map of current wildfires and prescribed burns across the Southwest US provided by InciWeb's RSS feed, and visualized on the Opterrix platform.
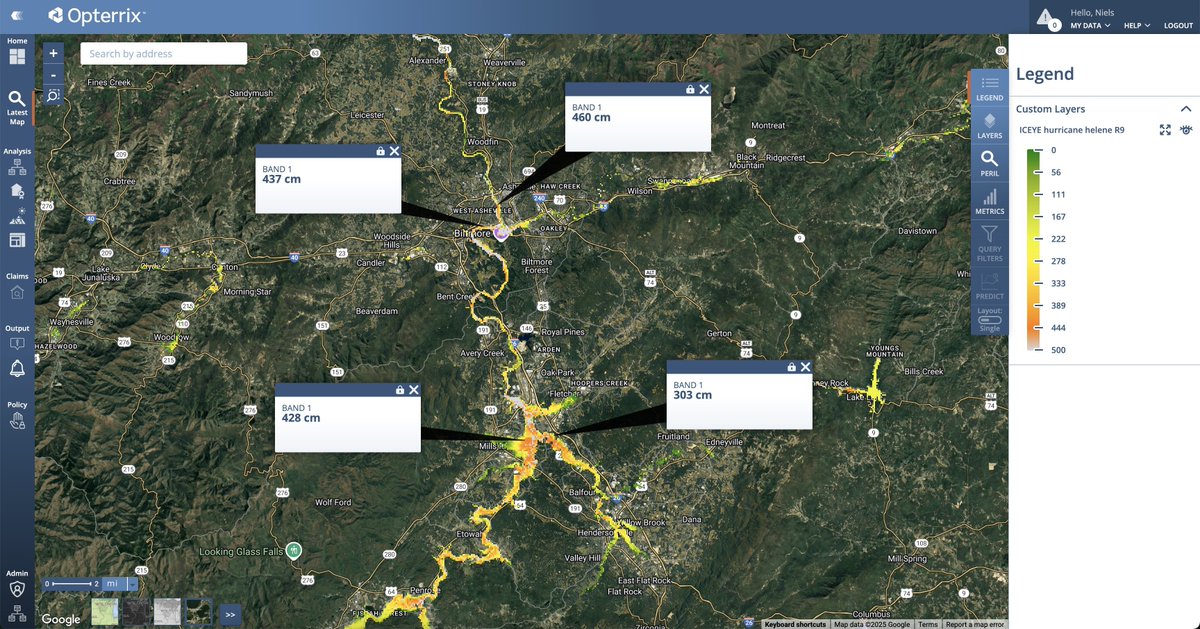
ALT ICEYE flood depth data from Hurricane Helene, over Asheville, NC, visualized in the Opterrix platform.
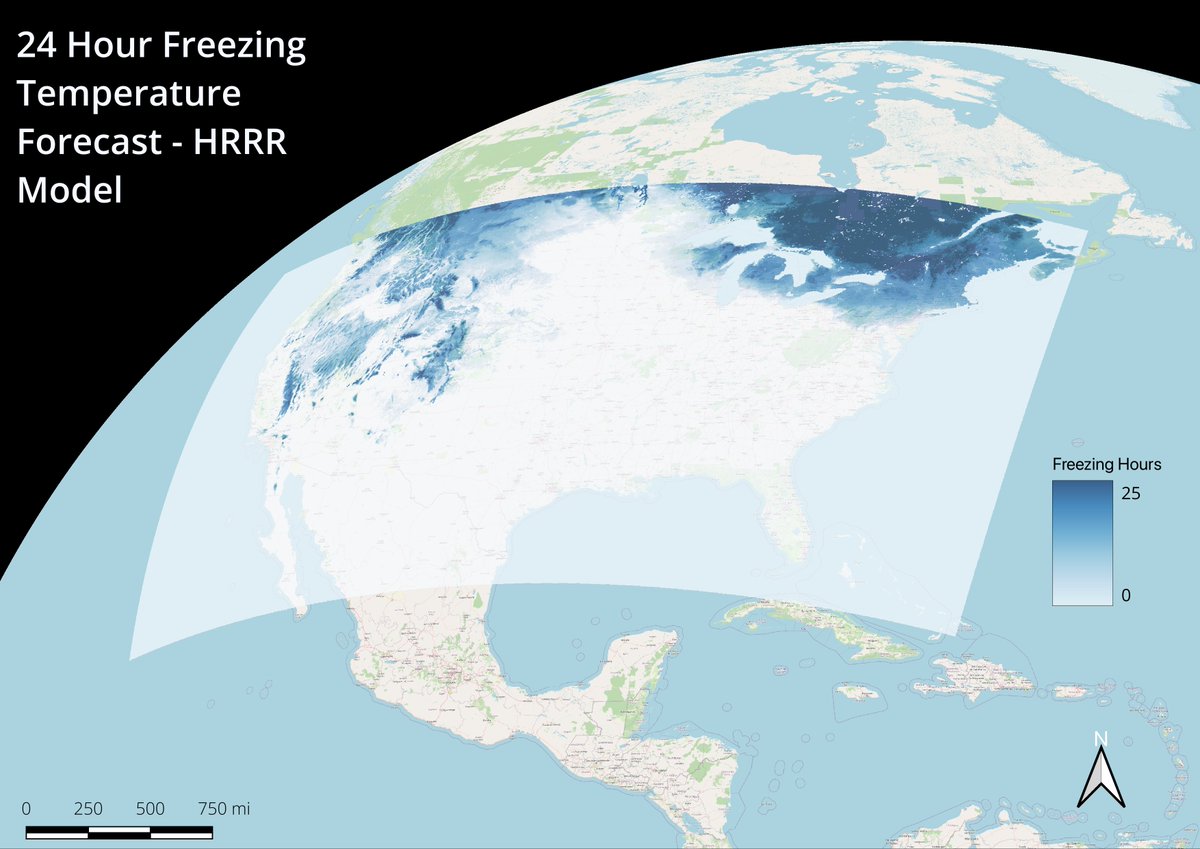
ALT Map of HRRR 24-hour freezing temperature forecast model
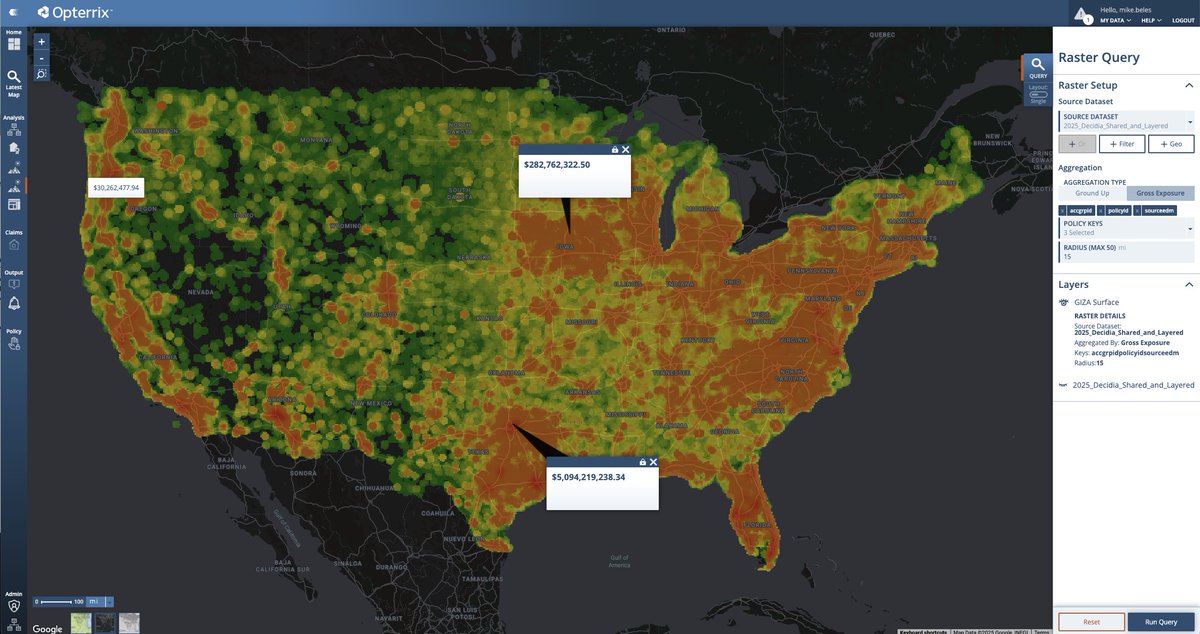
ALT Real-time Giza visualizes spatial distributions of risk in the Opterrix platform.
ALT The 3-mile hex grids used in Opterrix's Underwriting & Book Assessment Tool help measure and visualize Capacity levels.
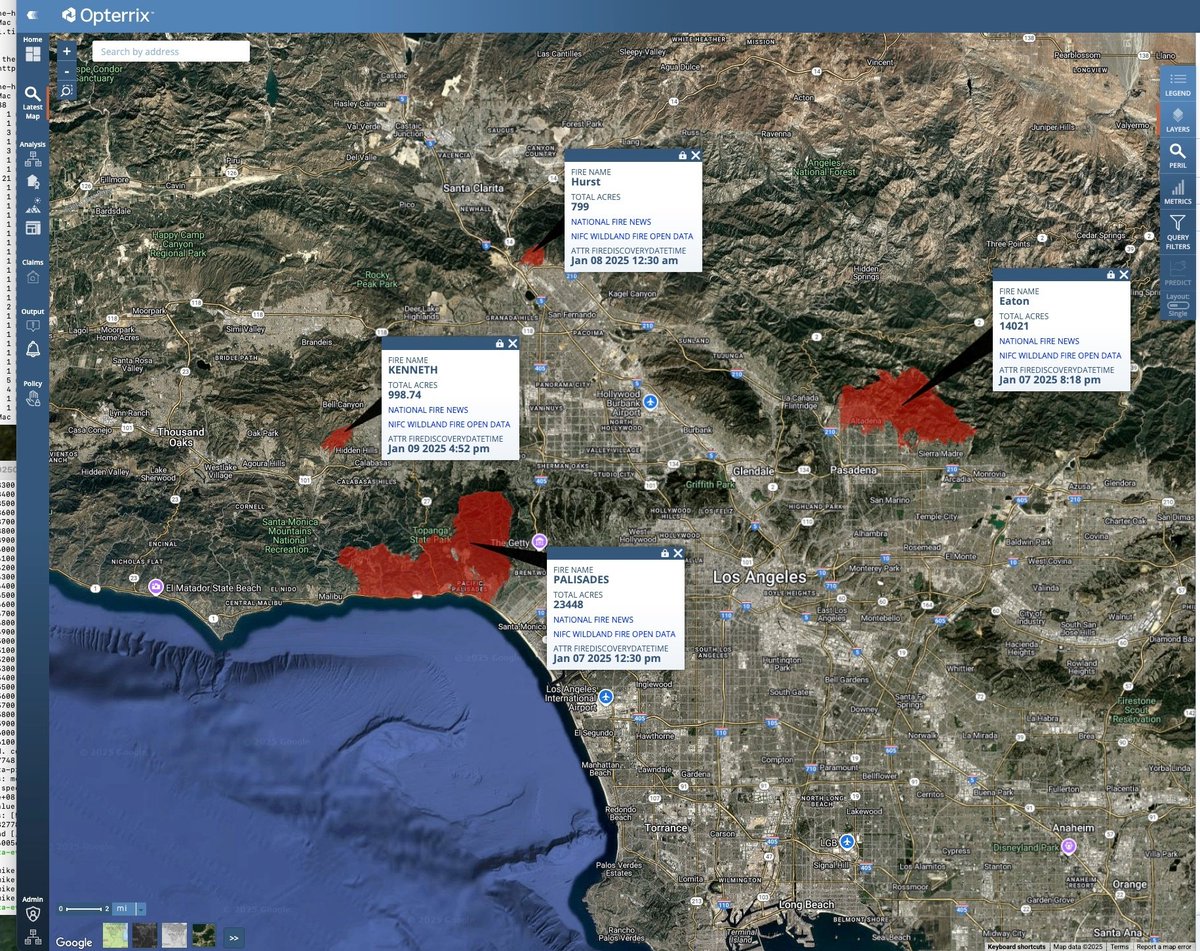
ALT Map of wildfire perimeters during 2025 in the Los Angeles area, including the Palisades and Eaton fires, visualized in the Opterrix risk intelligence platform.
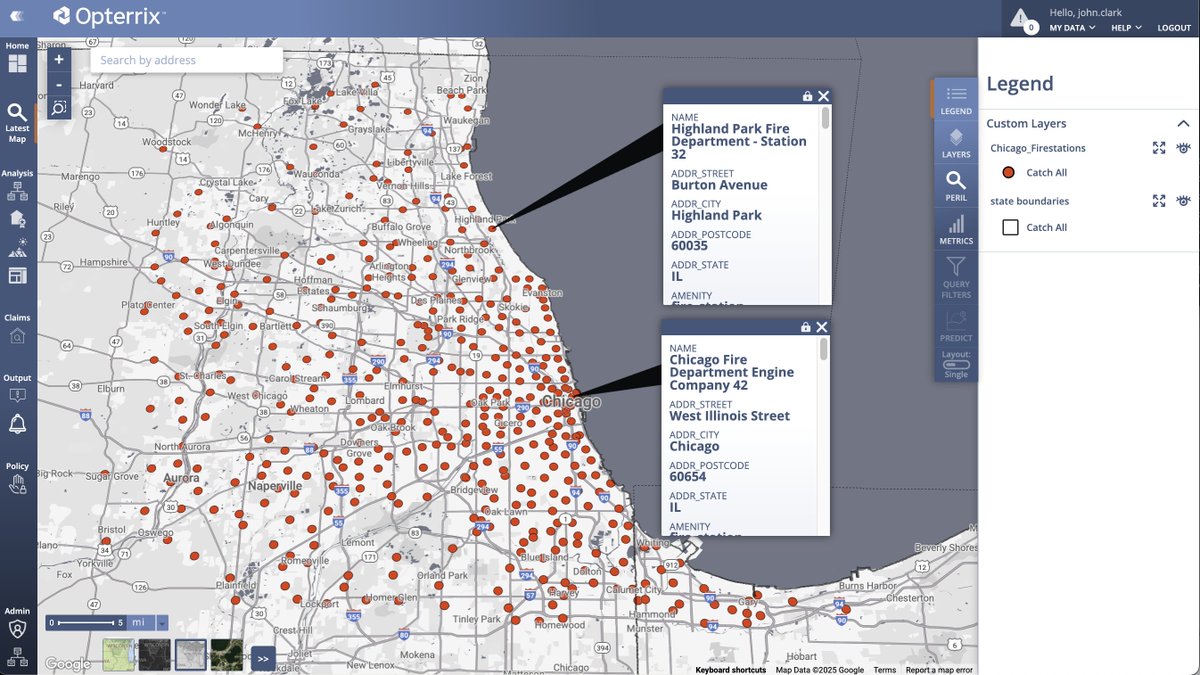
ALT A map of fire stations in the Chicago area, visualized in the Opterrix platform.

ALT Opterrix map of current evacuation zones from Genasys and 48-hour forecast rainfall for the Palisades Fire area, in Southern California.