
Joined August 2009
- Tweets 20,414
- Following 31
- Followers 30,873
- Likes 10,732
4,960 Photos and videos


Jun 12
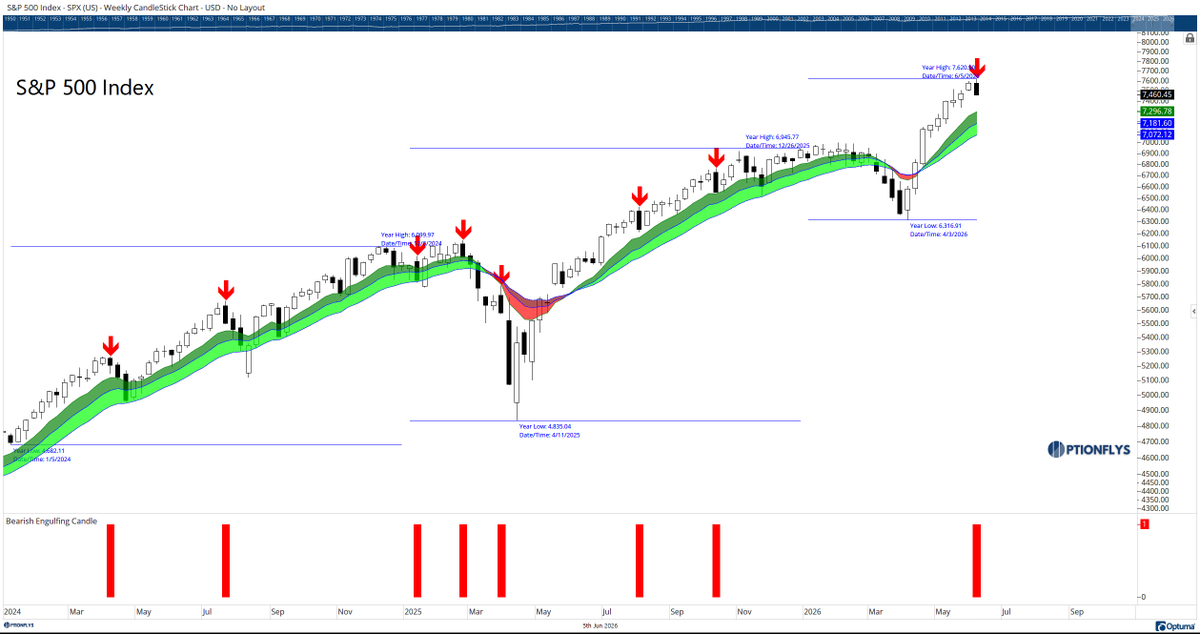
Last week the $SPX printed a Bearish Engulfing Candle after 10 straight weeks higher and fresh all-time highs.
This week?
A Doji.
The market spent an entire week trying to decide whether last week's selloff mattered.
That is where things get interesting.
The last time we saw a Bearish Engulfing Candle followed by a Doji near the highs was in early 2022. The market eventually rolled over into a bear market.
Does that mean history repeats?
No.
But it does mean this is a pattern worth respecting.
One candle is information.
Two candles become a message.
The next move matters more than either of these candles.
Price is still near all-time highs.
The trend is still up.
Now we wait for confirmation.
$SPY $QQQ @Optuma
24
25
268
29,905
Jun 11
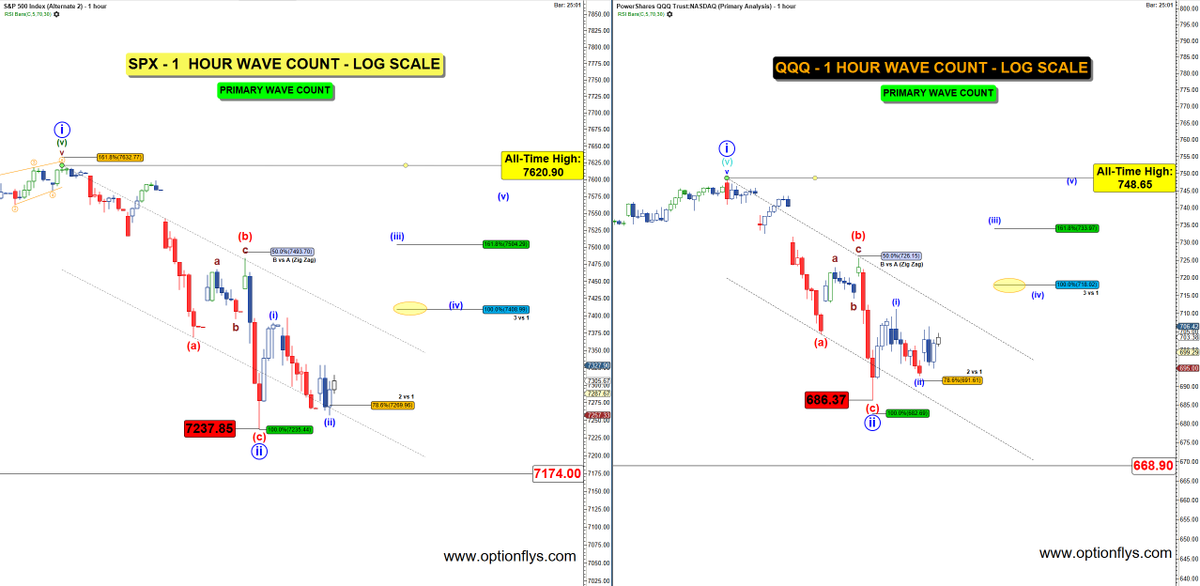
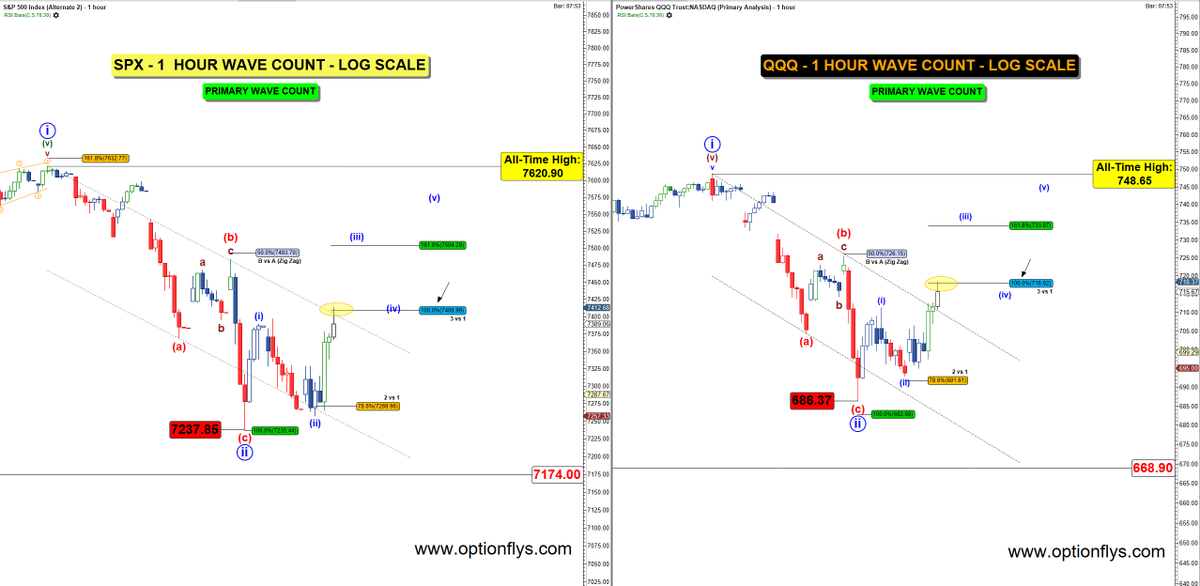
A few hours ago I posted the 1-hour $SPX and $QQQ wave counts.
The targets on the chart were:
SPX: 7408.99
QQQ: 718.02
Both levels were reached.
The funny part?
The comments were focused on arguing about the wave count instead of paying attention to the levels.
The purpose of a roadmap isn't to predict every tick.
It's to identify high-probability paths and objective targets.
Could price still take out the recent lows?
Absolutely.
Could the larger Weekly and Monthly uptrend still remain intact?
Absolutely.
Markets are not as binary as social media wants them to be.
Price first.
Opinions second.
$SPY
13
13
105
8,502
Jun 11
The 1-hour wave count on both SPX and QQQ are still trading inside the same corrective channel.
Could price take out the recent low?
Absolutely.
Markets don't ring a bell at the bottom.
That's why I don't trade opinions. I trade structure.
Right now the Daily trend is under pressure, the Weekly trend is still intact, and the Monthly trend barely notices the correction.
A break below the recent low would simply be the next piece of information, not a reason to panic.
The mistake most traders make is deciding what the market should do instead of preparing for what it can do.
Price can take out the low.
Price can also break the channel and squeeze higher.
Both outcomes remain on the table until the market decides.
$SPX $SPY $QQQ
12
15
99
6,914
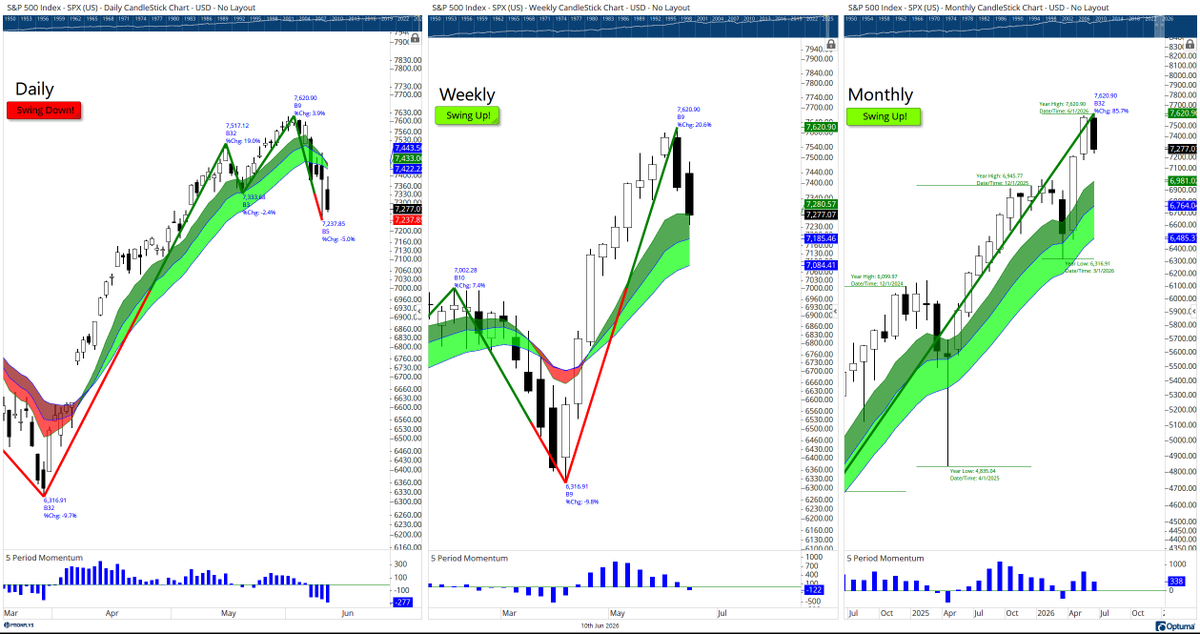
Jun 10
The Daily says:
Sell first. Ask questions later.
The Weekly says:
First real pullback we've seen since March.
The Monthly says:
Relax.
That's the problem with staring at one timeframe.
The Daily looks ugly.
The Weekly looks normal.
The Monthly barely notices.
Same market.
Different perspective.
$SPX $SPY $QQQ @Optuma
12
13
116
9,937
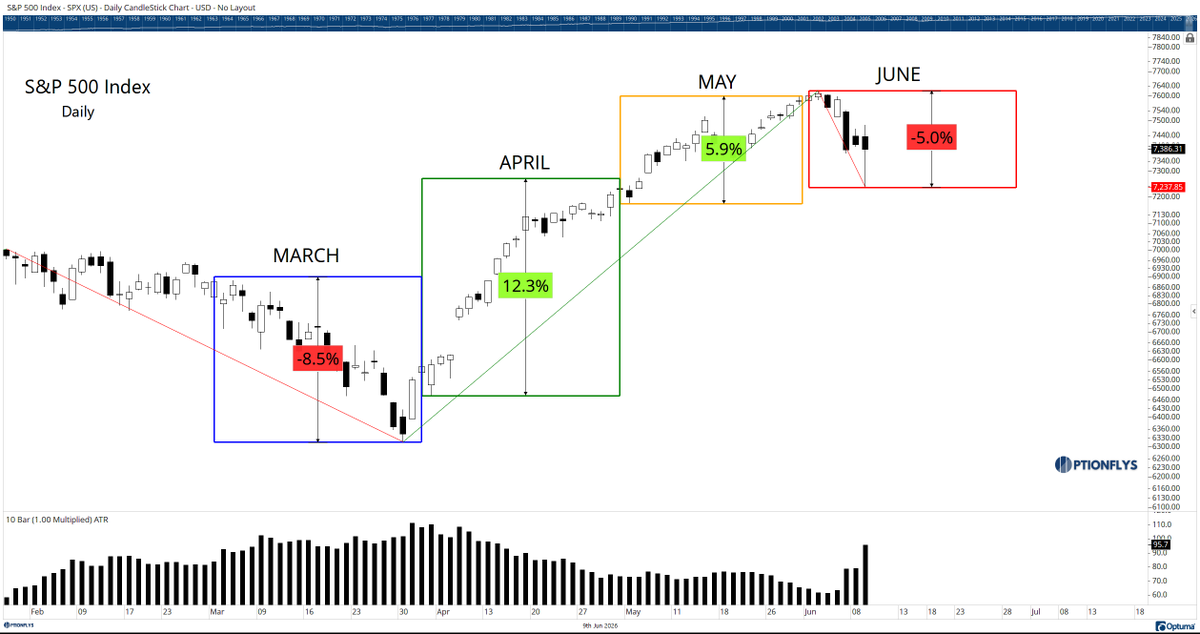
Jun 10
Price, time, and volatility.
March: -8.5%
April: 12.3%
May: 5.9%
June: -5.0% (so far)
A Time Box creates a visual reference between time and price. It helps identify trends, measure swings, and highlight potential reversal windows.
June has already retraced most of May's advance.
Now look at ATR.
Volatility collapsed throughout May as traders got comfortable.
June changed that.
Price corrected.
Volatility expanded.
Risk returned.
The easy money environment is gone.
$SPX $SPY $QQQ @Optuma
7
30
144
7,343
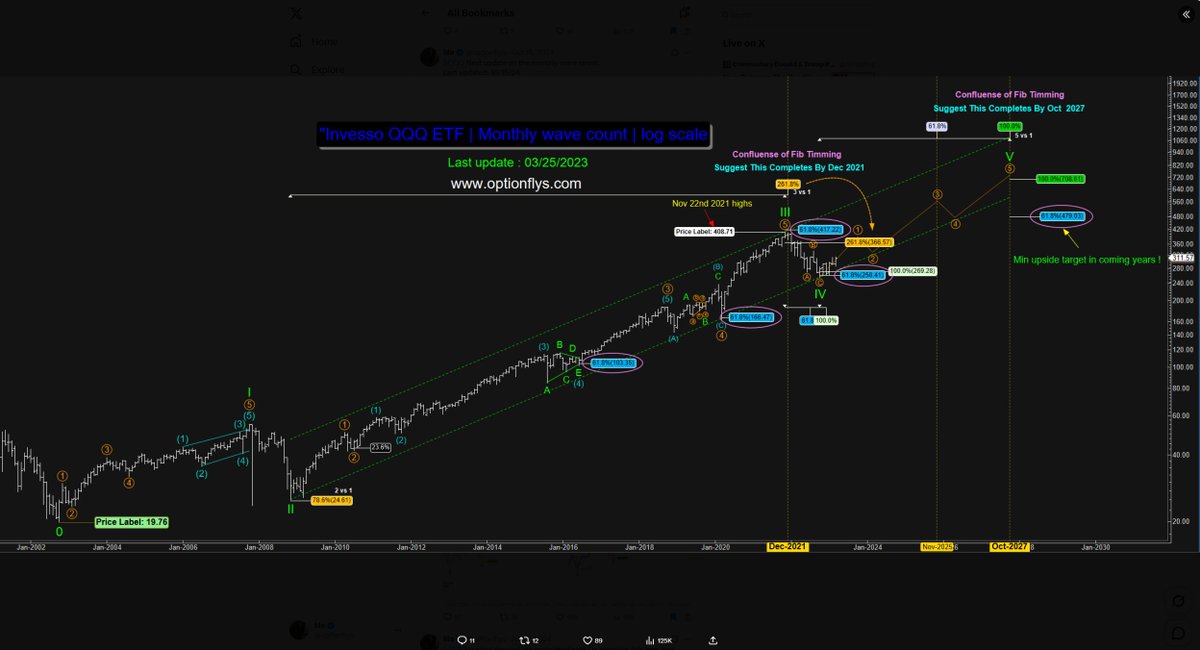
Jun 9
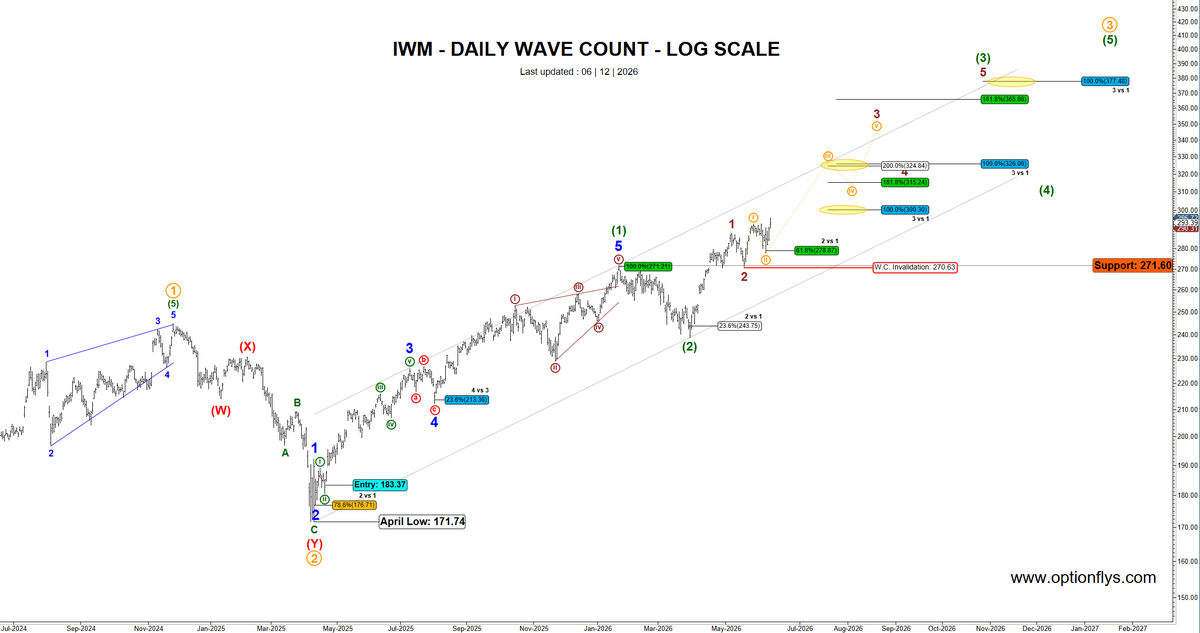
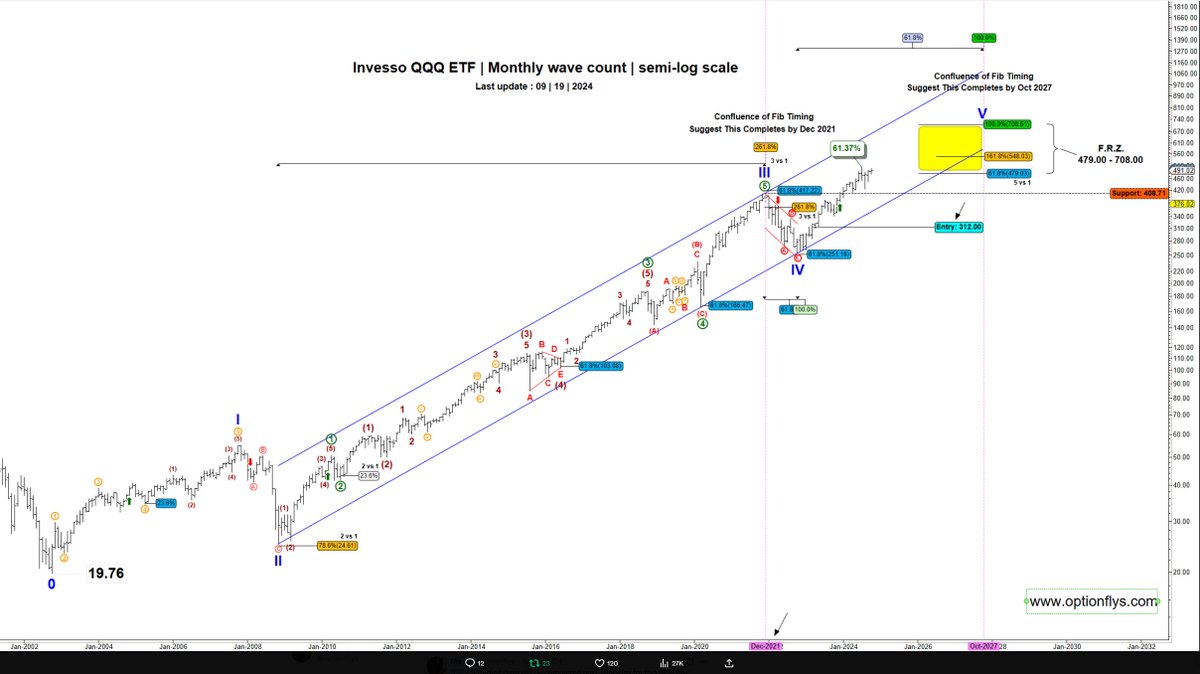
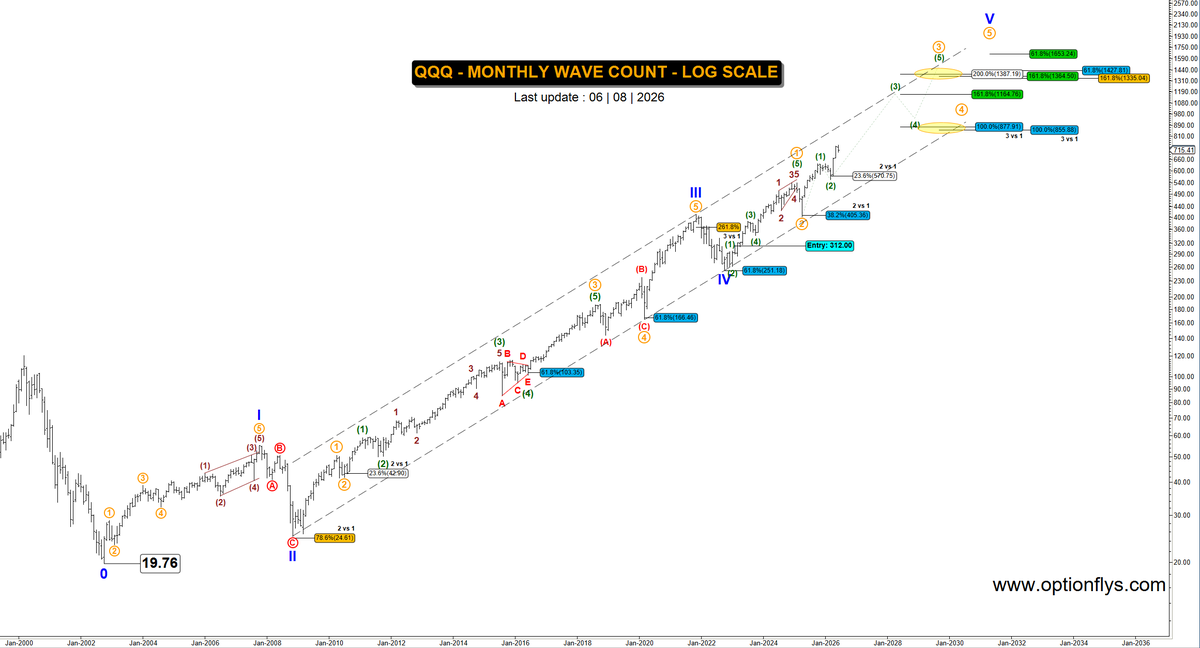
$QQQ Monthly Wave Count Update
The original count was published on 03/25/2023 when QQQ was trading near 312.
The first update was posted on 09/19/2024 when QQQ was trading near 491.
Today QQQ is trading above 700 and the larger degree 5th wave remains in progress.
This is not a trading wave count.
It is an investor map designed to identify the primary trend and the long-term path of least resistance.
Monthly wave counts are measured in years, not weeks. The objective is not to forecast the next pullback, but to track the progression of the larger secular advance as it unfolds over time.
With Q2 ending in a few weeks and the AI-driven expansion continuing across semiconductors, cloud infrastructure, and data centers, it is time to update the count and extend the 5th wave projection.
The market will continue to experience corrections, pullbacks, and periods of volatility along the way.
The larger framework remains intact.
$SPX $SPY
41
38
201
9,156
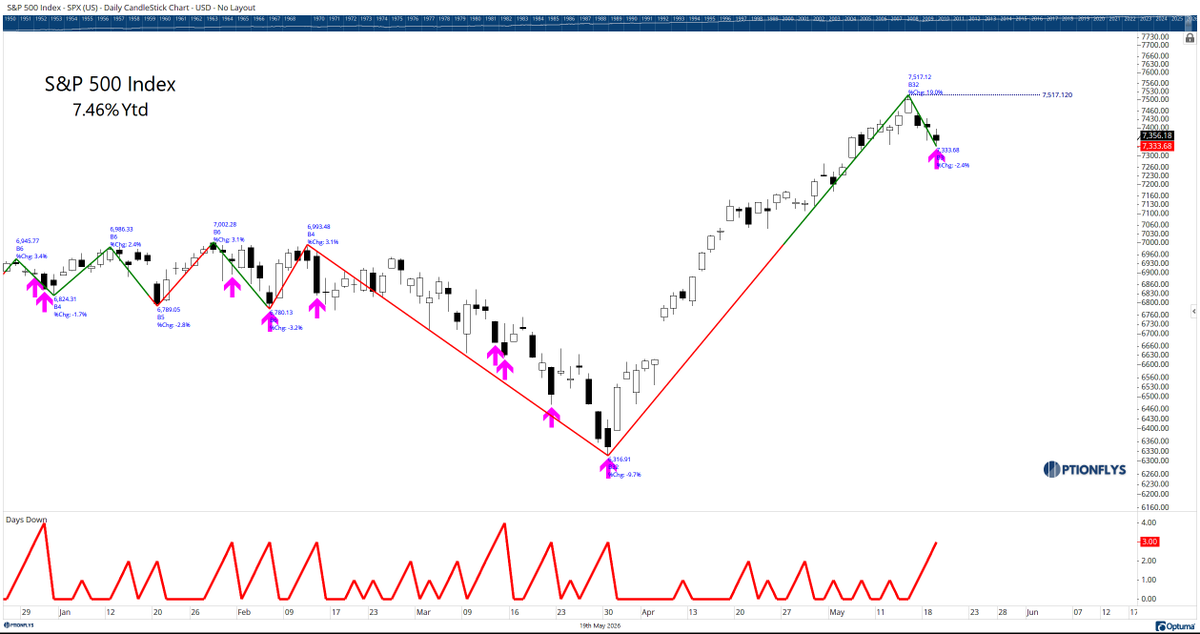
Jun 8
The market rallied 20.6% off the March low in just 9 weeks.
Last week's selloff grabbed everyone's attention, but let's keep it in perspective.
We now have well-defined support at 7333 and resistance at 7620, creating roughly a 4% trading range.
Today printed an inside day after Friday's damage.
That tells me one thing: the market is taking a breather, not waving a white flag.
Daily charts have taken some hits. Weekly charts are still holding up.
The next move will come from price, not headlines.
Trade the structure. Ignore the noise.
$SPX $SPY $QQQ @Optuma
12
18
118
9,865
Jun 5
10 straight weeks higher.
Fresh all-time highs.
Six straight sessions where advances outnumbered declines.
Everyone called it a healthy rally.
This week only 9 stocks in the entire S&P 500 turned their weekly swing UP.
Nine.
Think about that.
The index was making headlines.
Breadth was quietly drying up.
A healthy bull market expands participation.
More stocks join.
More sectors contribute.
More opportunities appear.
Instead, money crowded into the same handful of names while the rest of the market watched.
Now the first real selloff arrives and everyone is shocked.
I'm not.
The scanner has been showing it for weeks.
The index can hide weakness.
Breadth can't.
The easy money phase is over.
Now the market starts separating stock pickers from index chasers.
$SPX $SPY $QQQ @Optuma
8
8
85
13,157
Jun 5
10 straight weeks higher.
Fresh all-time highs.
A bullish trend ribbon.
Now a bearish engulfing candle.
One candle doesn't end a bull market.
But it does remind everyone that markets don't move in a straight line forever.
The biggest risk is not fear.
It's complacency.
What happens next week matters more than what happened this week.
$SPX $QQQ $SPY @Optuma
22
28
158
14,343
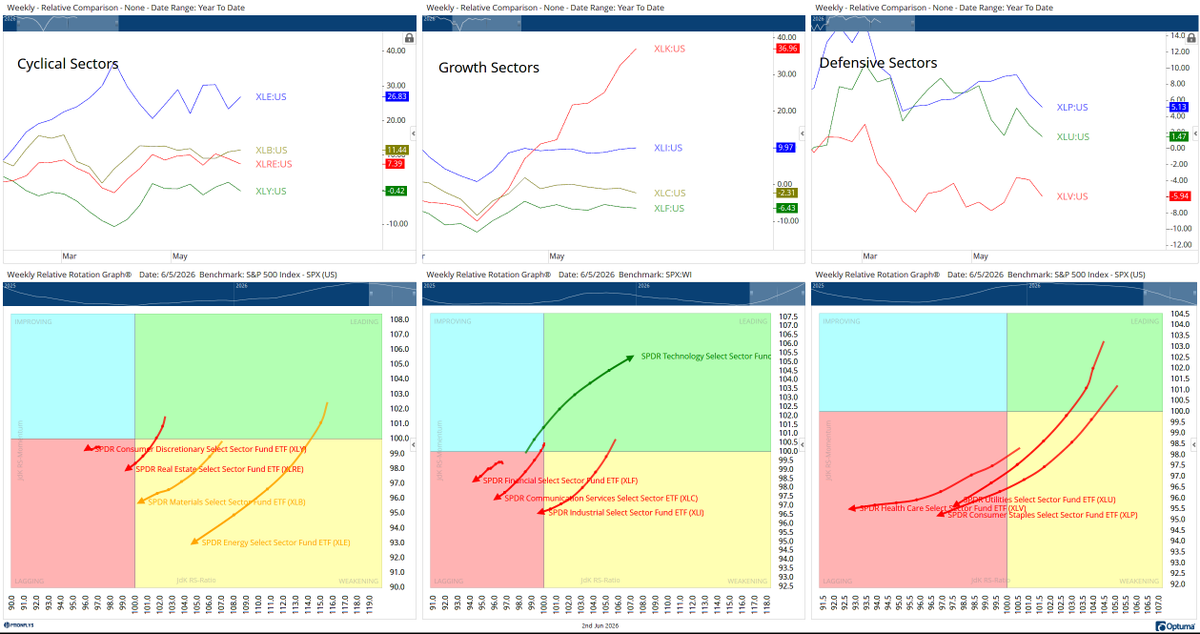
Jun 2
Everyone keeps asking where the next trade is.
The answer is right in front of you.
Technology is leading.
AI infrastructure is leading.
Software is leading.
Financials are lagging.
Healthcare is lagging.
Consumer sectors are lagging.
The market is literally telling you where the money is going.
Yet traders insist on fishing in the parking lot and wonder why they can't catch anything.
Stop arguing with rotation.
Follow the money.
$SPX $SPY $QQQ @Optuma
7
11
82
8,922
May 31
$SPX
9 consecutive higher weekly closes.
The last occurrence was December 29, 2023.
Since then, the market continued higher and made new all-time highs.
Today, we find ourselves in the same position again.
Money Flow remains positive.
Most traders spend strong trends looking for tops.
The market keeps rewarding those who respect the trend.
Price is the final vote.
$SPY $QQQ @Optuma
10
18
125
10,117
May 29
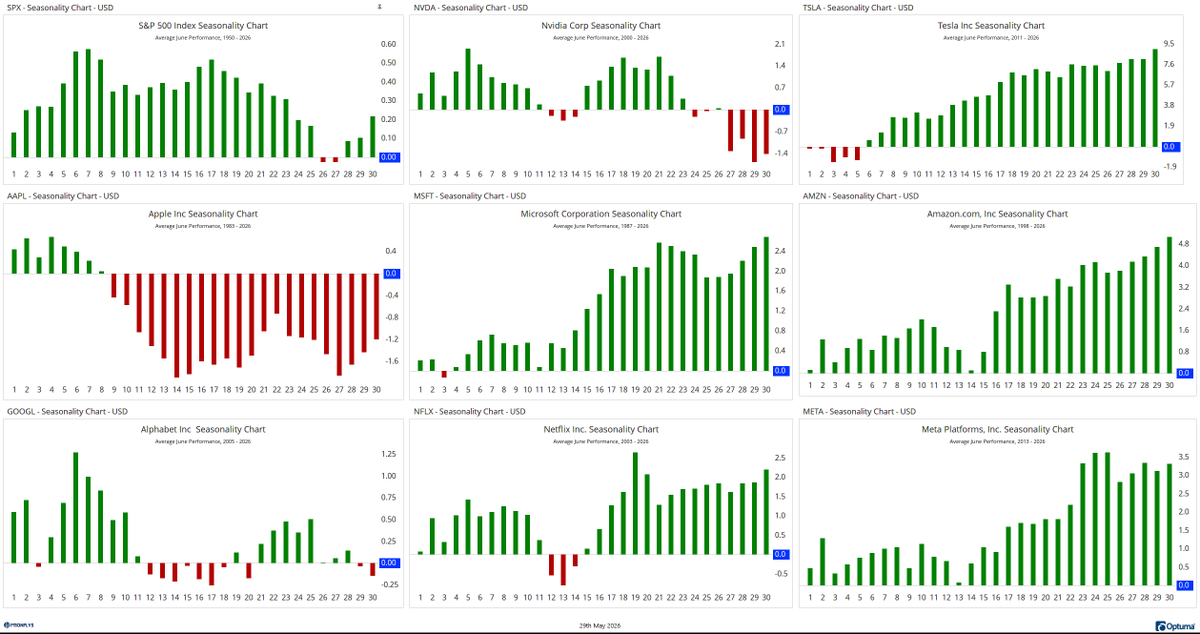
June seasonality is very clear.
$SPX
Strong early June → steady advance through mid-month → seasonal pause late month → positive finish into month end.
$AAPL
Early strength → weakness develops → one of the softer June profiles.
$MSFT
Slow start → strength builds → one of the strongest June trends.
$AMZN
Steady accumulation → consistent upside → strong finish.
$GOOGL
Strong early June → choppy middle → modest edge late month.
$META
Momentum improves as the month progresses → strongest period is the back half.
$TSLA
Early digestion → steady bid → one of the strongest late-month ramps.
$NFLX
Mid-month softness → recovers → strength returns into month end.
$NVDA
Strong first half → momentum cools → softer seasonal tendency into the final week.
June is not a straight line.
It's a month of rotation.
Early strength.
Mid-month trend.
Late-month consolidation.
If leadership continues to broaden, names like TSLA, MSFT, META and AMZN may have the wind at their back.
If not, expect money to continue rotating beneath the surface while the indexes grind higher.
$SPY $QQQ @Optuma
9
28
187
15,546
May 23
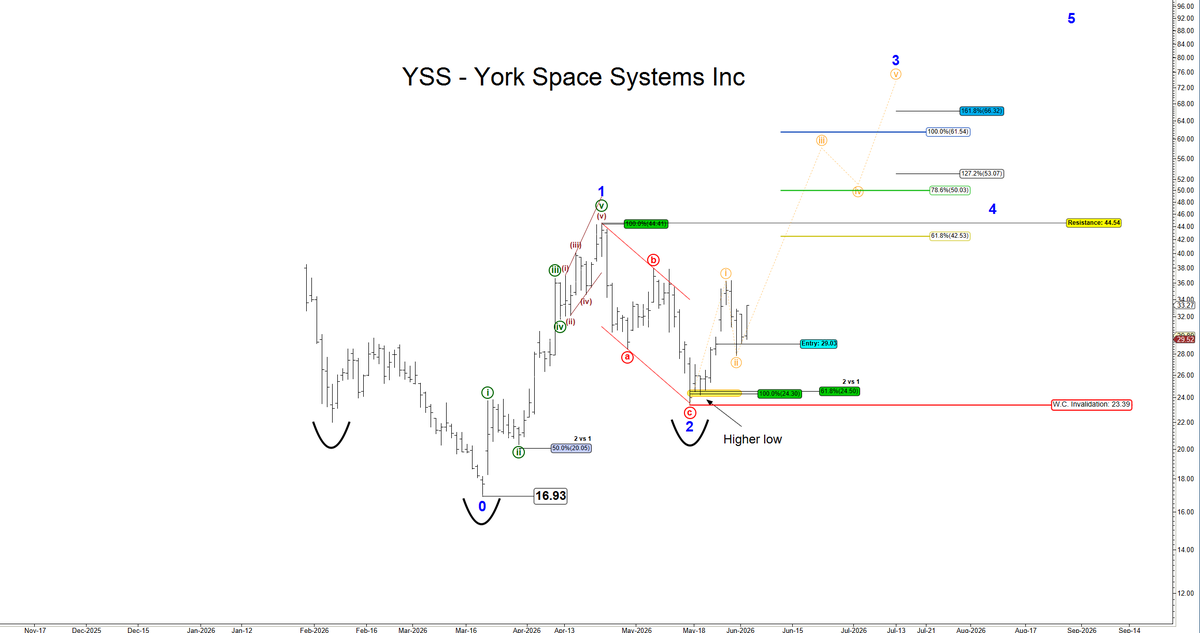
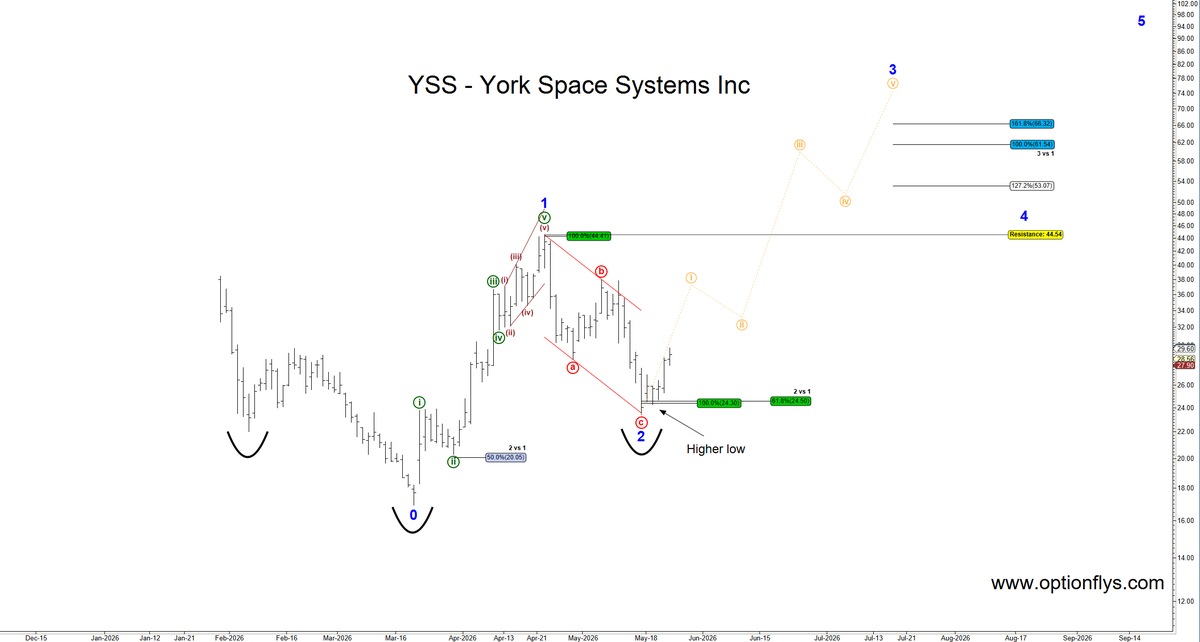
$YSS is an interesting name developing quietly in the aerospace & defense space.
The company focuses on:
• Satellite infrastructure
• Military communications
• Space networking systems
• Land / Sea / Air connectivity
Projected growth over the next few years remains very strong.
Technically the chart appears to be attempting a higher low after a major corrective phase.
If structure confirms above resistance, expansion can happen very quickly in volatile growth names like this.
Watching closely over the coming weeks.
Structure over narrative. Always.
$SPX $SPY $QQQ
10
4
70
7,968
May 22
8 consecutive higher weekly closes on the $SPX
Last time this happened was late 2023.
Back then everybody was calling for the top too.
Market just kept grinding higher anyway.
Now here we are again.
Still seeing narrow leadership underneath though.
This is not one of those “everything goes up” environments.
This is a sniper market, not a shotgun market.
Money is rotating very selectively right now.
Some names look incredible.
Some are completely dead money.
That’s why rotation matters.
That’s why structure matters.
Most people still chasing headlines.
Have a great long weekend with your family and friends. Thank you.
$SPY $QQQ @Optuma

12
19
160
10,946
May 19
After a 19% move in 32 trading days, the market is finally cooling off.
Meanwhile:
• 30YR yields elevated
• crude oil firm
• VIX still asleep
• QQQ leadership barely cracking
This is no longer broad easy-money bullish behavior.
Now it becomes:
rotation,
selective liquidity,
narrow leadership,
and risk management.
The market is starting to reward positioning again instead of blind beta.
Structure > narrative.
$SPX $SPY $QQQ @Optuma
10
10
93
11,644
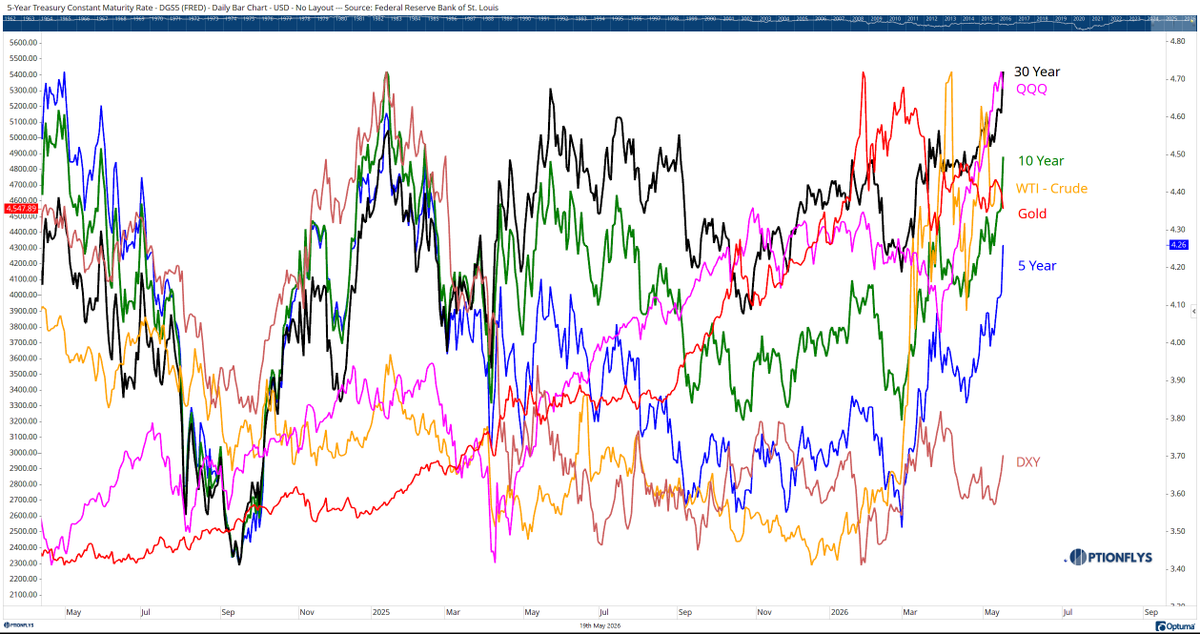
May 19
Something unusual is happening beneath the surface.
• 30YR yields rising
• Crude oil rising
• Gold consolidating after a massive run
• QQQ still making new highs
Historically this combination doesn’t normally persist together for long.
The bond market is signaling inflation/debt pressure while AI liquidity continues overpowering macro tightening.
Gold exploded higher first.
Now it’s digesting while tech and energy continue rotating underneath.
Very unusual market structure.
Structure > narrative.
$SPX $QQQ $SPY @Optuma
9
9
89
8,046
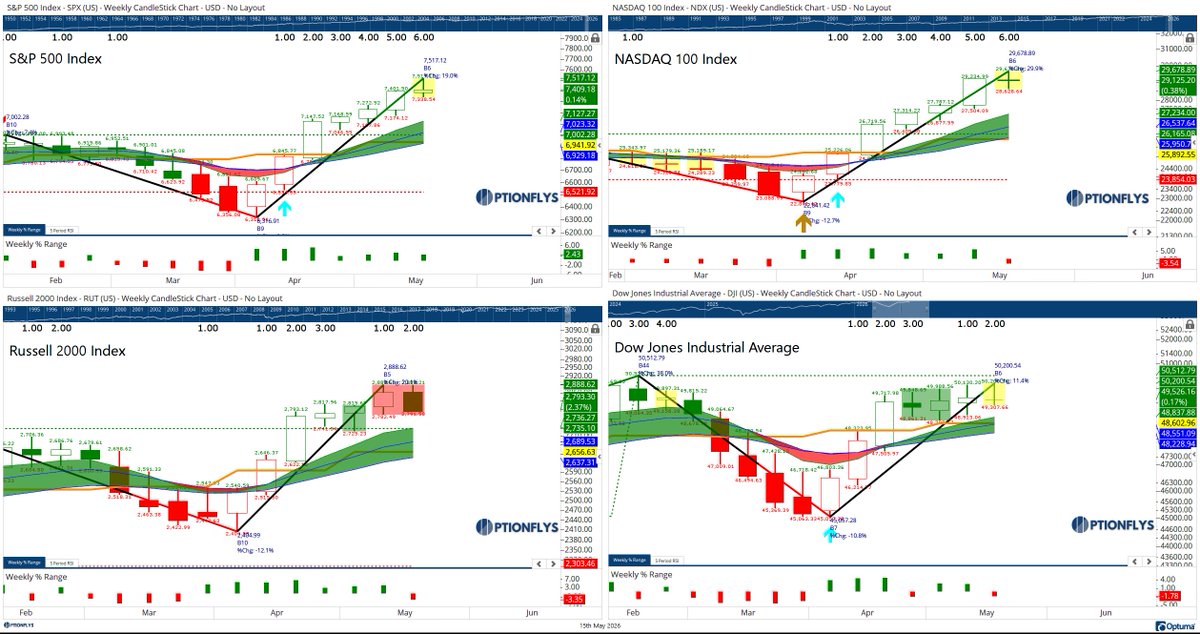
May 15
This is exactly why next week matters.
$SPX = Weekly Doji
$NDX = Weekly Doji
$DJI = Weekly Doji
$RUT = bearish weekly structure developing
The market paused after a massive 6-week expansion.
Now comes the decision point:
Higher low and continuation?
Or lower high and rotation deeper?
Doji weeks are equilibrium weeks.
Both sides fight.
Nobody fully wins.
The breakout usually comes the following week.
$SPY $QQQ @Optuma
14
10
127
11,385
May 15
$TSLA just printed another weekly doji at a lower high after a 34% rebound off the April lows.
That’s not breakout behavior yet.
That’s compression.
That’s negotiation.
The market is deciding whether this was:
• a bear market rally
or
• the setup before the next expansion leg higher.
Meanwhile…
Everyone is waiting for the potential SpaceX IPO narrative to hit the tape.
Volatility is coming either way.
$SPX $SPY $QQQ

13
7
88
10,069
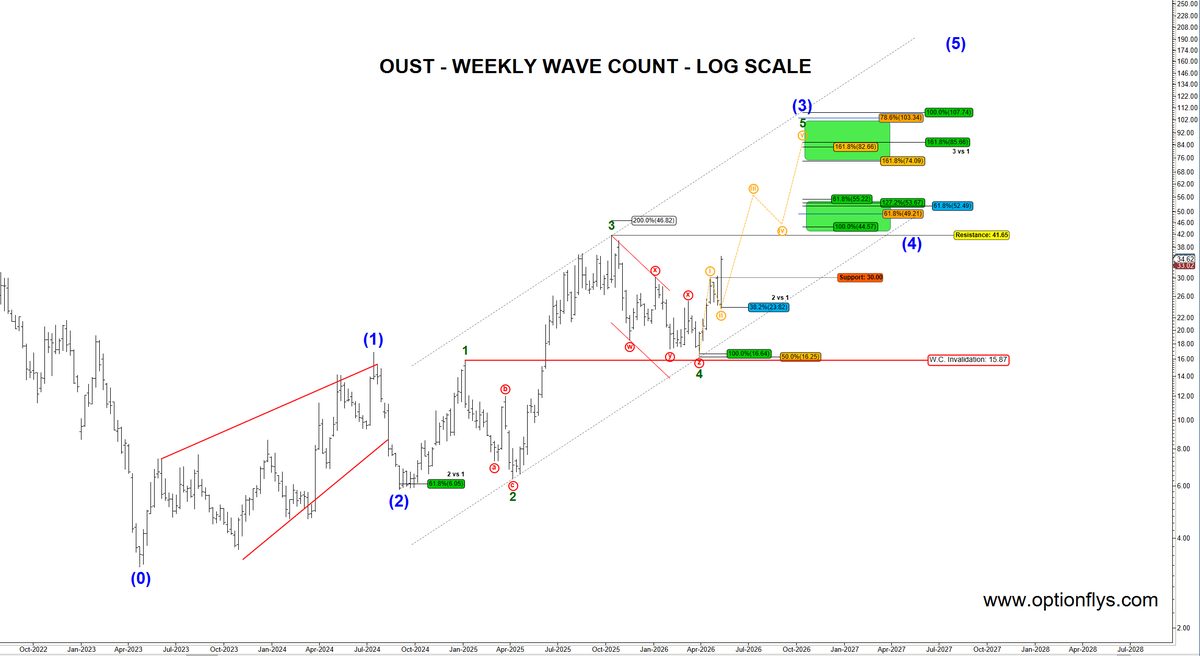
May 14
Everybody talking about AI software.
Nobody paying attention to the physical AI bottleneck yet.
Humanoid robots don’t run on prompts alone.
They need:
• sensors
• perception
• LiDAR
• motion control
• machine vision
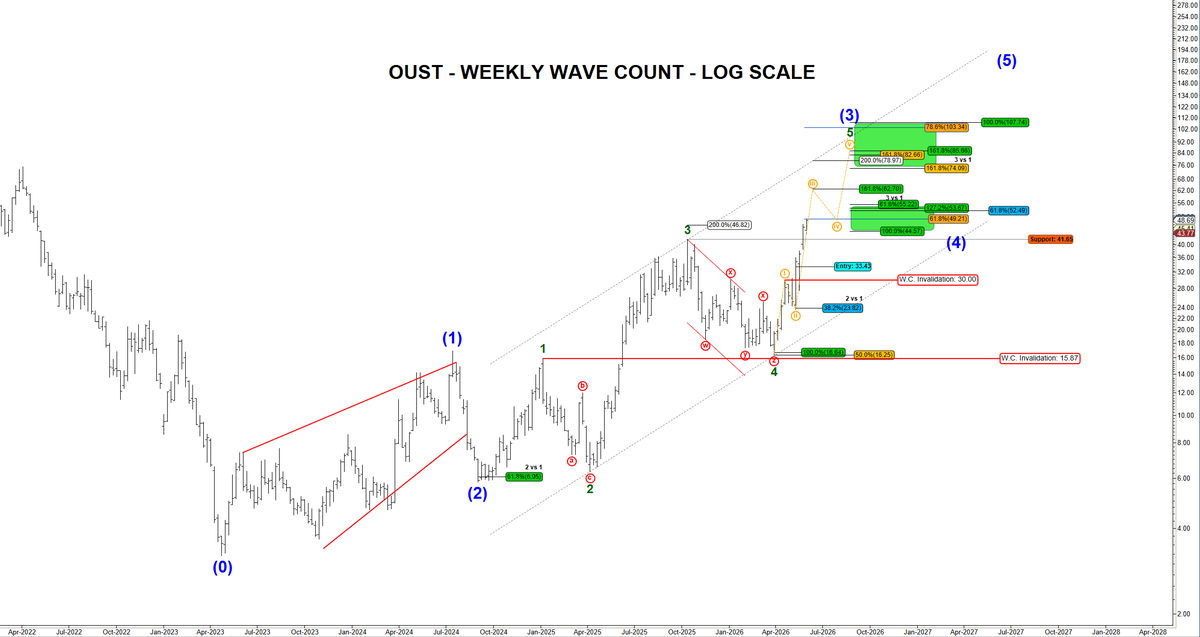
That’s why $OUST is getting interesting.
LiDAR was left for dead for years.
Now the world suddenly wants:
autonomous systems,
robots,
smart factories,
warehouses,
drones,
and machine perception at scale.
Weekly wave count now trying to transition into a new expansion phase.
41.65 is the key level.
If that breaks clean on the weekly, the next leg can accelerate very fast.
Small cap.
High volatility.
But the wave count narrative are finally starting to align.
$SPX $SPY $QQQ
13
17
140
21,407