
Tech|| Data analyst|| Taking it one step at a time|| Virgo ♍|| @Manutd
Joined October 2022
- Tweets 193
- Following 126
- Followers 31
- Likes 938
13 Photos and videos


Patrick Ogbonna retweeted

Gmail should introduce a bluetick or seen functionality. We deserve to know if recruiters read the emails or not…
199
1,388
8,955
174,275

Patrick Ogbonna retweeted

10 Feb 2025
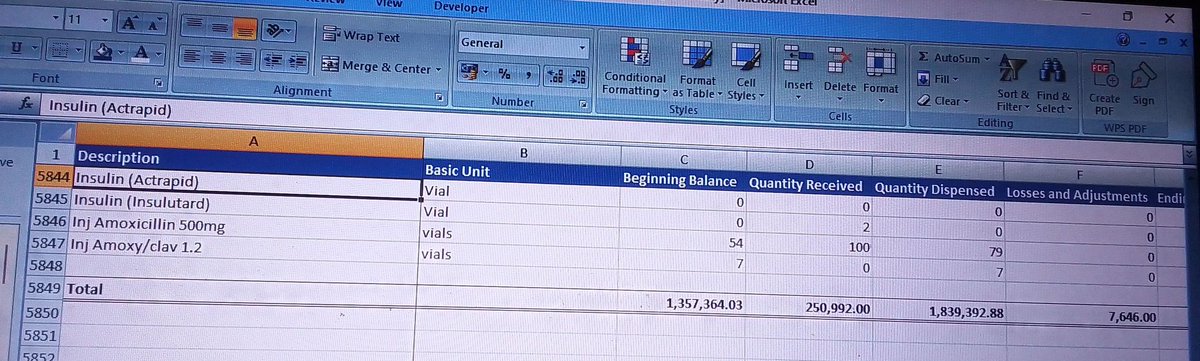
5 Common Data Cleaning Mistakes You Might Be Making
Cleaning data is important, but small mistakes can mess up your results. Here are five mistakes you should avoid:
1. Ignoring Missing Data
You see empty cells and think, "It’s just a few blanks—no problem." But missing data can change your results. Instead of deleting them, ask yourself why they are missing. Should you fill them in? Should you remove them? Think before you act.
2. Deleting Duplicates Without Checking
You spot repeated entries and delete them right away. But wait—what if they are supposed to be there? A customer could have made two purchases, or an employee could appear twice for a reason. Always check before removing.
3. Not Fixing Inconsistent Formats
One column has "Jan 1, 2024," another has "01-01-24." Some names are in lowercase, others in uppercase. If your formats don’t match, your data won’t work properly. Standardizing everything from the start makes your work easier.
4. Removing Outliers Without Thinking
You see one number that looks too high or too low, and you delete it. But what if it’s real? A big sale, a rare event—outliers can tell an important story. Always check before removing them.
5. Skipping Error Checks
You finish cleaning and move on, but did you check for mistakes? If someone’s birth year is 1800, or a price is negative, that’s a clear error. A quick check can save you from bad analysis.
9
46
205
14,309
Patrick Ogbonna retweeted
21 Jan 2025
ANOVA (Analysis of Variance) is a statistical test used to determine whether there are significant differences between the means of three or more groups. It helps answer: Are the group means statistically different from each other?
1. Null Hypothesis (H₀): All group means are equal.
2. Alternative Hypothesis (H₁): At least one group mean is different.
3. Use Case: When comparing more than two groups. If you only have two groups, a t-test is simpler.
ANOVA compares two types of variation:
1. Between-group variation: Differences between the group means.
2. Within-group variation: Variability of data points within each group.
If the between-group variation is much larger than the within-group variation, it suggests the means are significantly different.
Types of ANOVA:
1. One-way ANOVA: Tests the impact of one factor (e.g., comparing test scores across three teaching methods).
2. Two-way ANOVA: Tests the impact of two factors and their interaction (e.g., comparing test scores by teaching methods and gender).
Example: One-Way ANOVA
Scenario: You test three diets (A, B, C) to see if they lead to different weight loss results.
Data:
Group A: [4, 5, 6]
Group B: [7, 8, 9]
Group C: [3, 4, 5]
Steps:
1. Calculate the mean for each group.
2. Measure the variation between and within groups.
3. Compute the F-ratio (a statistic that compares the variations).
4. Check the F-value against a critical value or p-value:
If p-value < 0.05, reject the null hypothesis (significant difference exists).
ANOVA tells you if there's a difference but not which groups differ. For that, use a post-hoc test (e.g., Tukey's test).
Data should meet these assumptions:
1. Groups are independent.
2. Data is normally distributed.
3. Variances are roughly equal (homogeneity of variance).
21 Jan 2025

Anova test
14
80
417
31,273
Patrick Ogbonna retweeted
21 Jan 2025
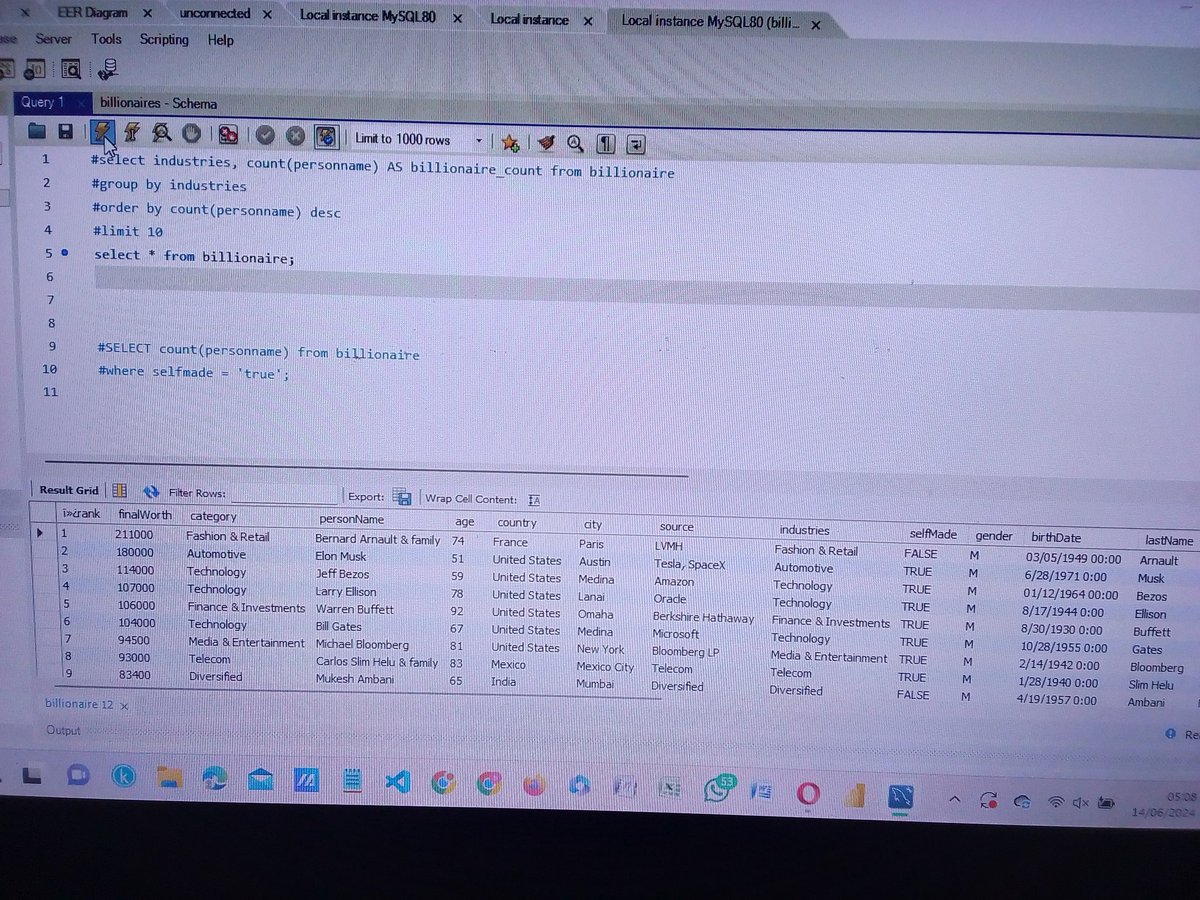
A subquery is a query inside another query. Think of it as a mini-question that helps answer the main question.
Why Use Subqueries?
Sometimes, you need to get some data first (the subquery) to use it in your main query.
Example:
Scenario: You want to find employees who earn more than the average salary in a company.
Step 1: Start with the Subquery
The subquery calculates the average salary:
SELECT AVG(salary) FROM employees;
Step 2: Use it in the Main Query
Now, find employees earning more than that average:
SELECT name, salary
FROM employees
WHERE salary > (SELECT AVG(salary) FROM employees);
Here, the subquery (SELECT AVG(salary) FROM employees) runs first, calculates the average, and passes it to the main query.
Types of Subqueries:
1. Single-row subquery: Returns one value (like an average or a max value).
2. Multi-row subquery: Returns multiple values (like a list of IDs or names).
3. Correlated subquery: Depends on the main query and runs for every row.
Tips for Understanding:
Subqueries are enclosed in parentheses ().
They can be in the SELECT, WHERE, or FROM clause.
Always think: What does the subquery do first?
21 Jan 2025

Sub queries
2
5
24
1,778
Patrick Ogbonna retweeted

15 Dec 2024
5 ways you can make money as a Data Analyst.
- Get a 9-5 job
- Freelance on Upwork and Fiverr
- Become a Technical Writer.
- Solve Projects and Assignments for Masters students
- Teach
7
74
523
45,209
Patrick Ogbonna retweeted

9 Dec 2024
Want to wrap up the year finally cracking containers in Tableau? 🚀 Say no more...
I've got you covered with this Medium blog—an easy, digestible guide to mastering Tableau containers!
👉 Read it here: medium.com/@ayodejiomokehind…
#TableauTips #DataViz #DataFam #Tableau

5
12
48
2,954
Patrick Ogbonna retweeted

13 Dec 2024
Hey #datafam
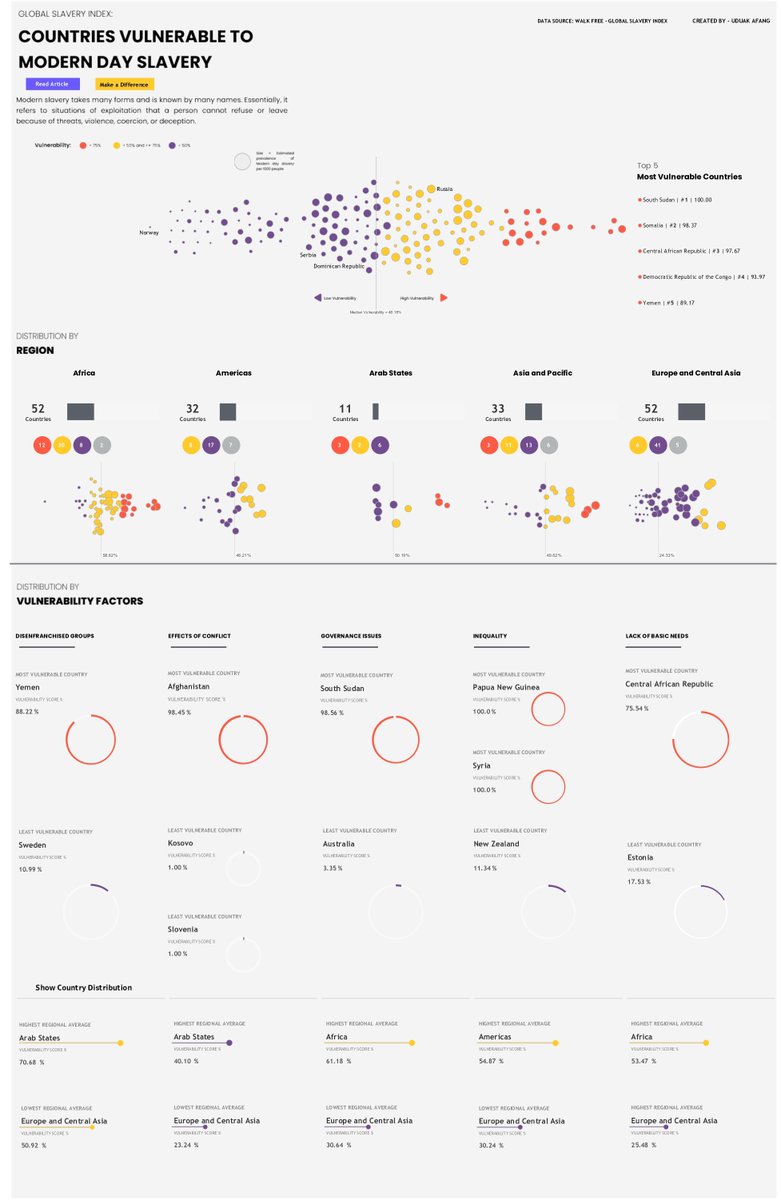
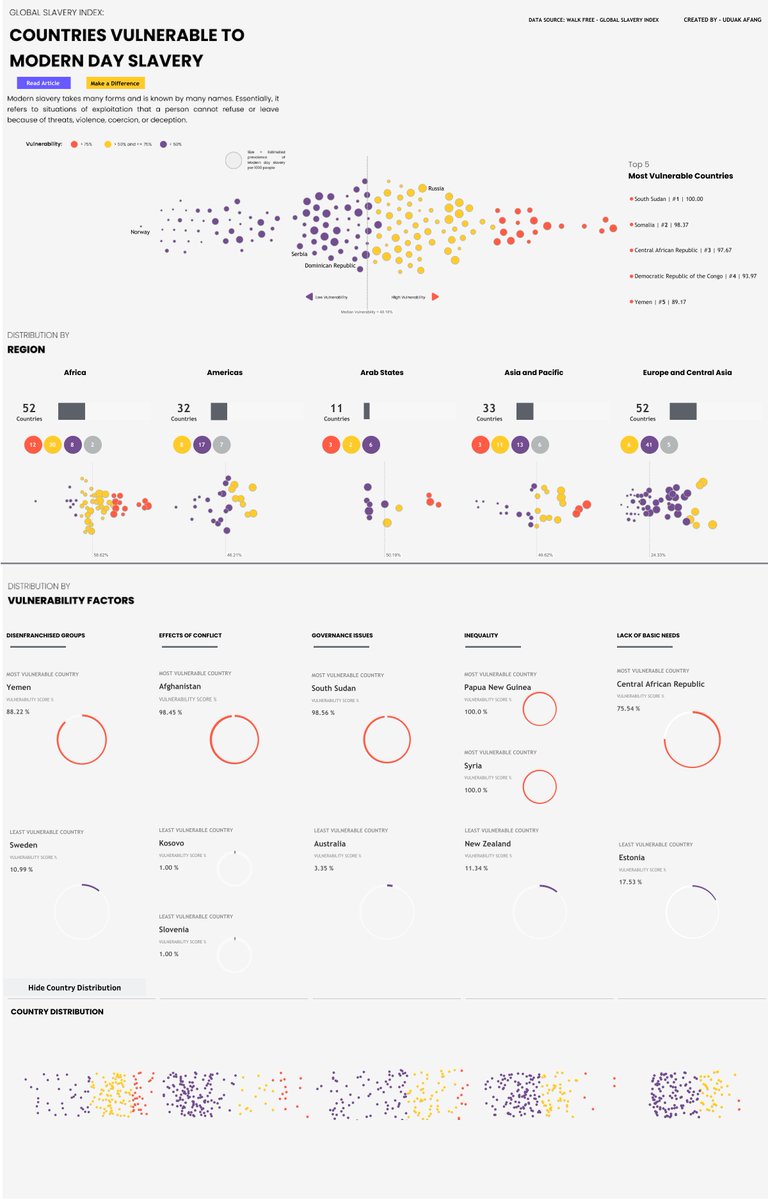
Here's my submission for this year's Week 49 of #MakeoverMonday
It was a very sensitive topic so I wanted to show the information clearly and understandably.
Check it out here: shorturl.at/s1gnm
3
4
36
1,496

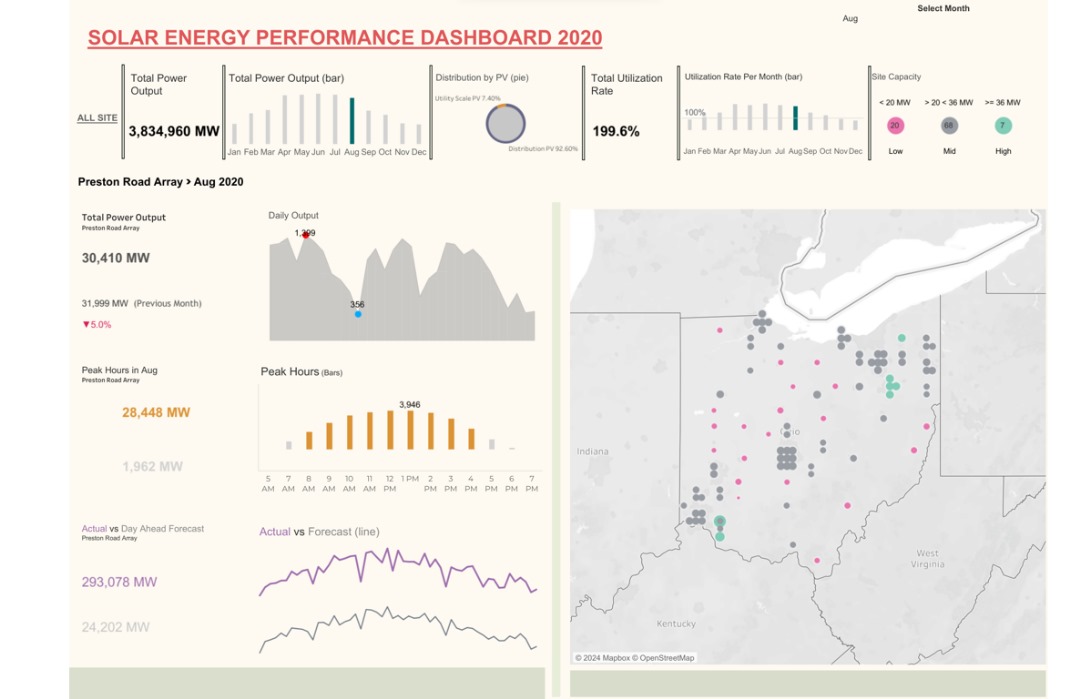
12 Dec 2024
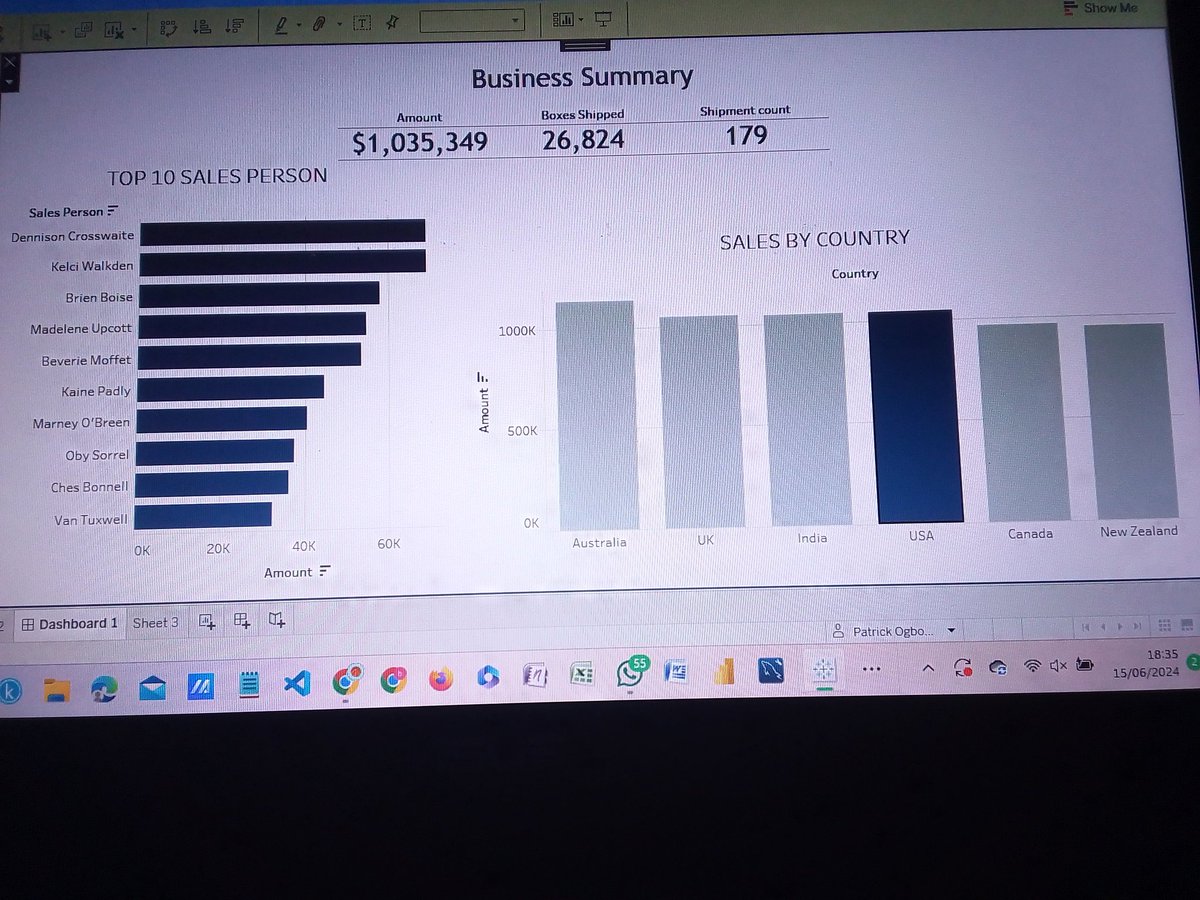
Excited to share my dashboard for week 4. Special thanks to @ud_analyst for helping out and @LagosTUG for this boot camp.
Here is the link to the dashboard: public.tableau.com/views/Sol…
1
1
18
295
Patrick Ogbonna retweeted

9 Dec 2024
Help Me Find My Next Role!
I’m seeking opportunities as a Data Visualization Analyst, #TableauDeveloper, or BI/Data Analyst. Check out my work showcasing impactful dashboards and insights.
🔗 linktr.ee/victoryomovrah #DataFam #OpentoWork
@salesforce @Google @tableau
1
51
122
5,857
6 Dec 2024
My submission for week 4 @LagosTUG and thanks to @911xclusive for a wonderful session and what a wrap learning Tableau.
Learnt a lot through this series.
1
4
27
920
6 Dec 2024
Special thanks to @gbolahaann @Babajide_Tobi @EmeritusAli @KhennieNectar @Sir_kayleb for the opportunity gonna to learn to implement a lot on my own and build more data solution dashboard.
Here is the link to the dashboard public.tableau.com/views/Hel…
3
2
6
122
Patrick Ogbonna retweeted

5 Dec 2024
1) When you get loads of rejections, you stop fearing it. Don't settle for less.
2) When you know what you want, have a plan to achieve it, and do the work consistently, nothing can stop you.
16
69
2,793
Patrick Ogbonna retweeted

3 Dec 2024
Don’t start a Data Analytics career.
Yet.
Read this first:

8
56
355
32,767

Patrick Ogbonna retweeted

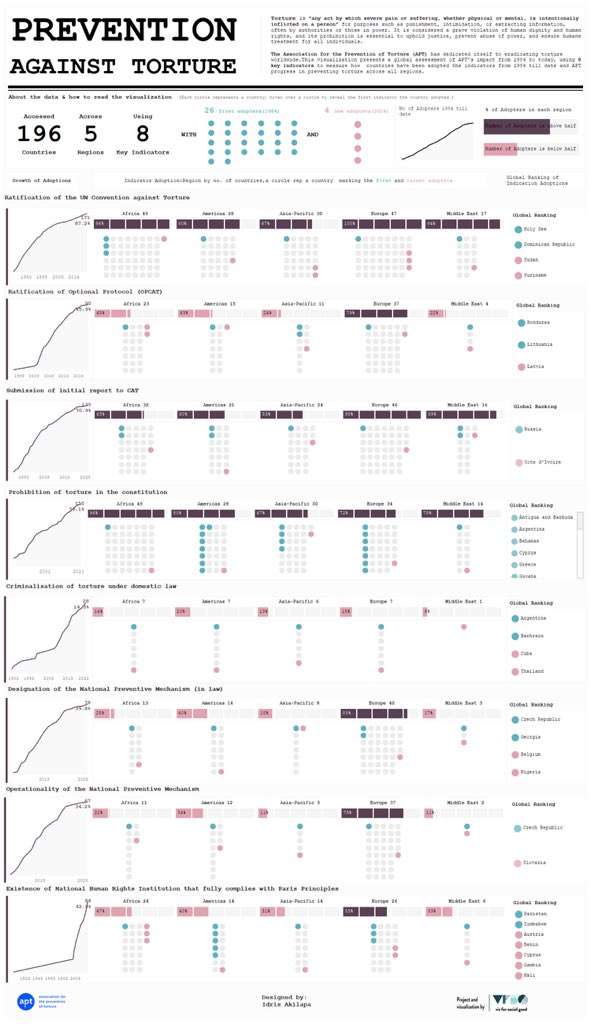
I'm honored to share my first Svelte and D3.js data visualization project since I began learning a few months ago. This submission for the #VizforSocialGood initiative, in collaboration with @APTGeneva, presents global progress in torture prevention.
Link in the comments.
6
14
46
2,113
Patrick Ogbonna retweeted

29 Nov 2024
Hi #datafam , long time no viz, excited to share my latest and first @VizFSG project: a dashboard visualizing 40 years of global progress in preventing torture..
Dashboard link: public.tableau.com/app/profi…
3
12
36
1,636
Patrick Ogbonna retweeted

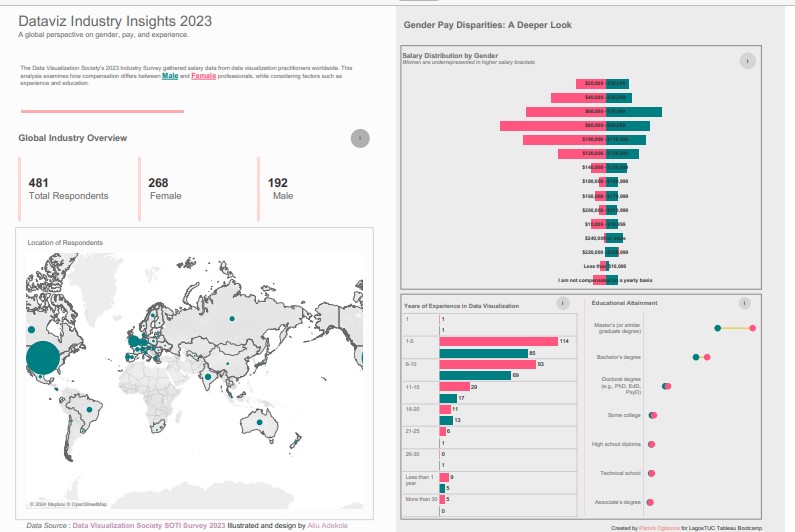
28 Nov 2024
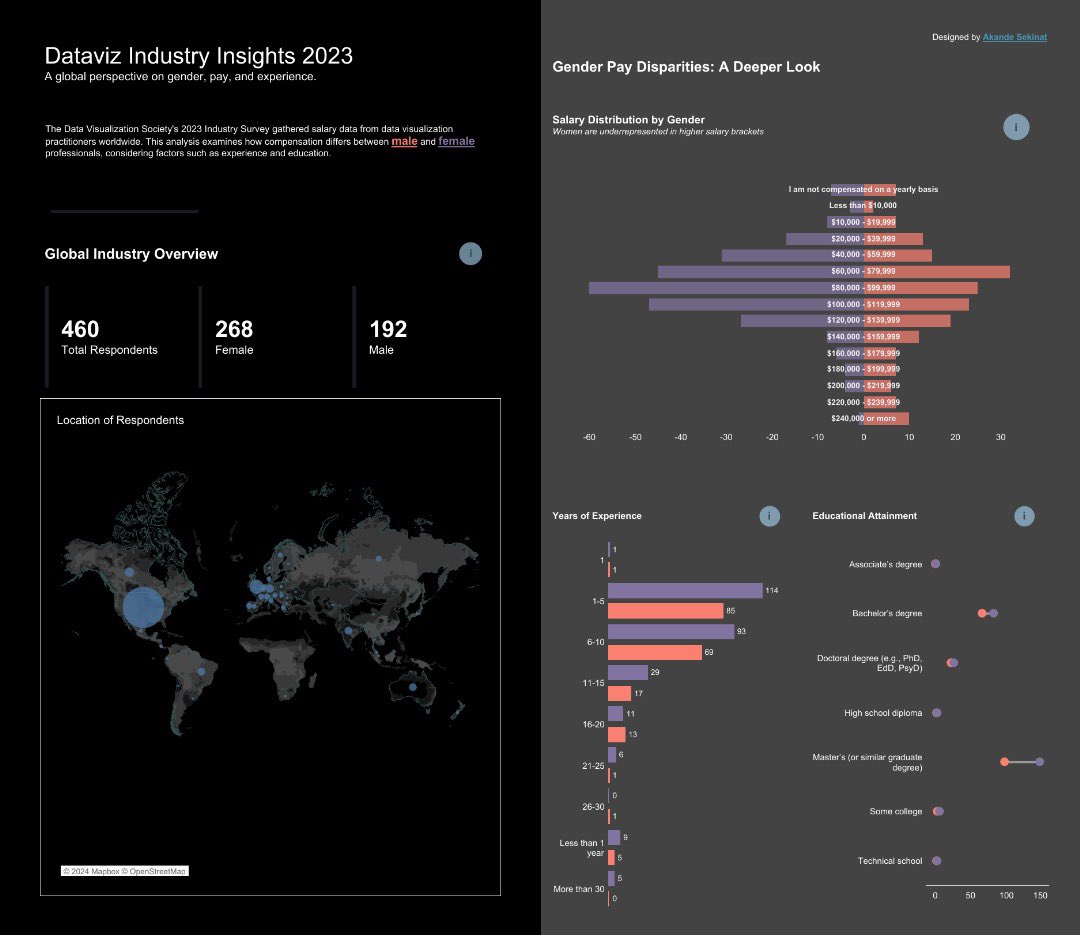
Hi #DataFam
I just work on DataViz industry dashboard that explores global trends in gender, pay, and experience within the data visualisation industry
Link to viz: tinyurl.com/yc2kk4me
2
17
110
4,567
Patrick Ogbonna retweeted

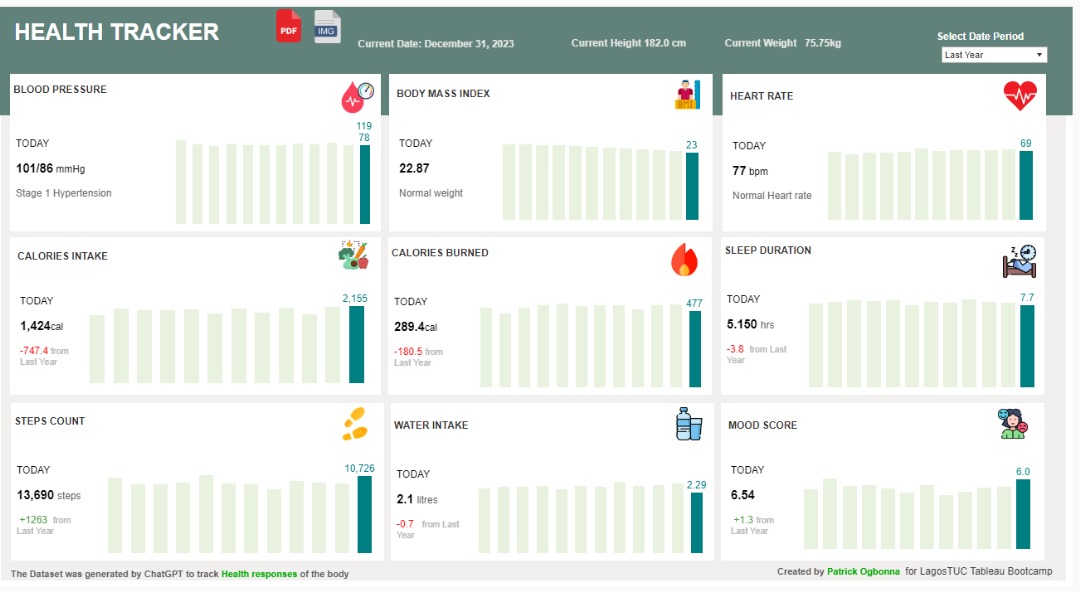
27 Nov 2024
Hi #datafam 🙋🏽♂️
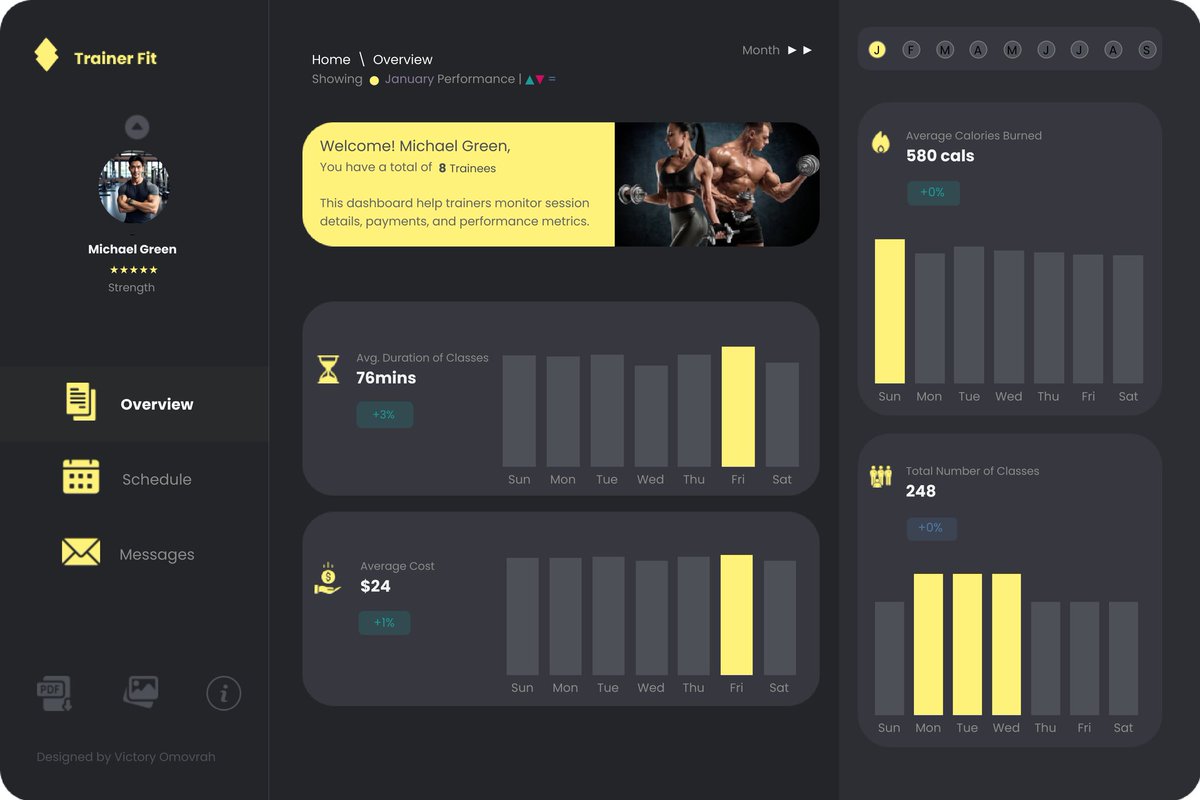
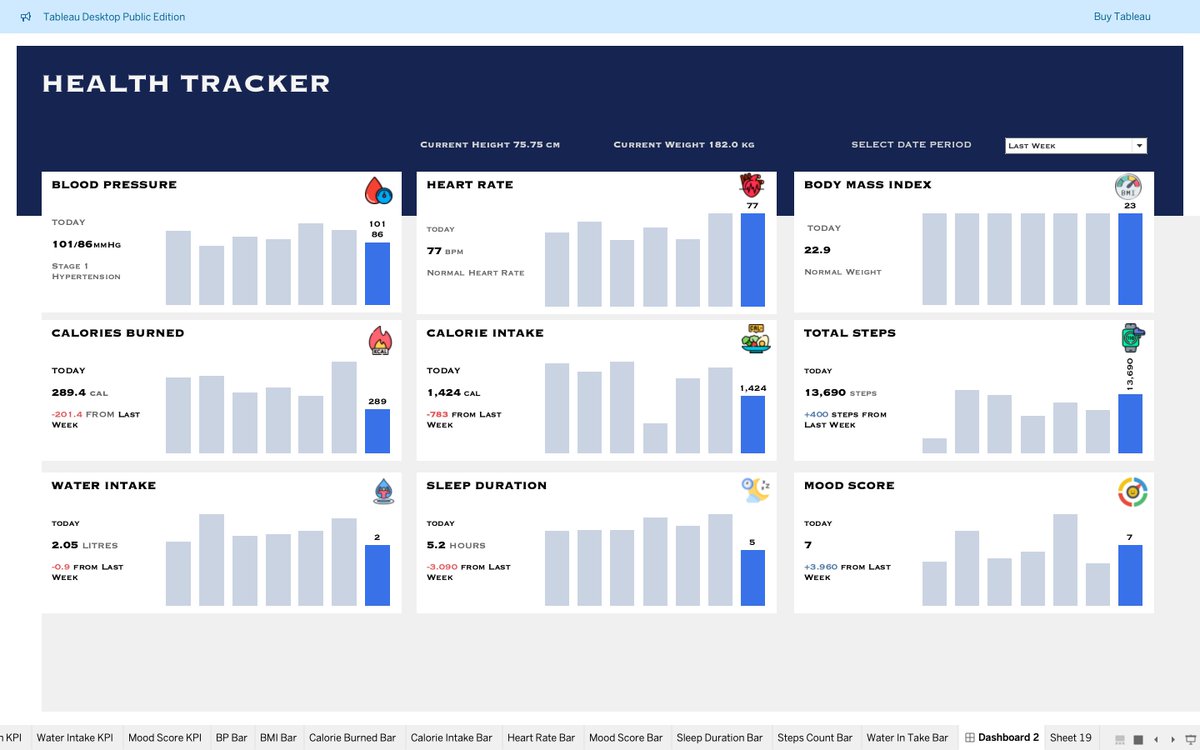
I recreated this dashboard by @Babajide_Tobi and @LagosTUG which tracks user's Health performance by last year, month, and week.
Tracks Blood Pressure, BMI, mood score, etc.
Feel free to interact with the dashboard below👇🏾
public.tableau.com/views/Hea…
2
7
16
441