
Making fun things on the web and sharing how you can do it too | 📊🏀🎨🇨🇦 | dataviz engineer @netflix | tidyjs, buckets, shotline
Joined November 2009
- Tweets 1,192
- Following 925
- Followers 3,963
- Likes 4,474
169 Photos and videos


Pinned Tweet

2 Nov 2020
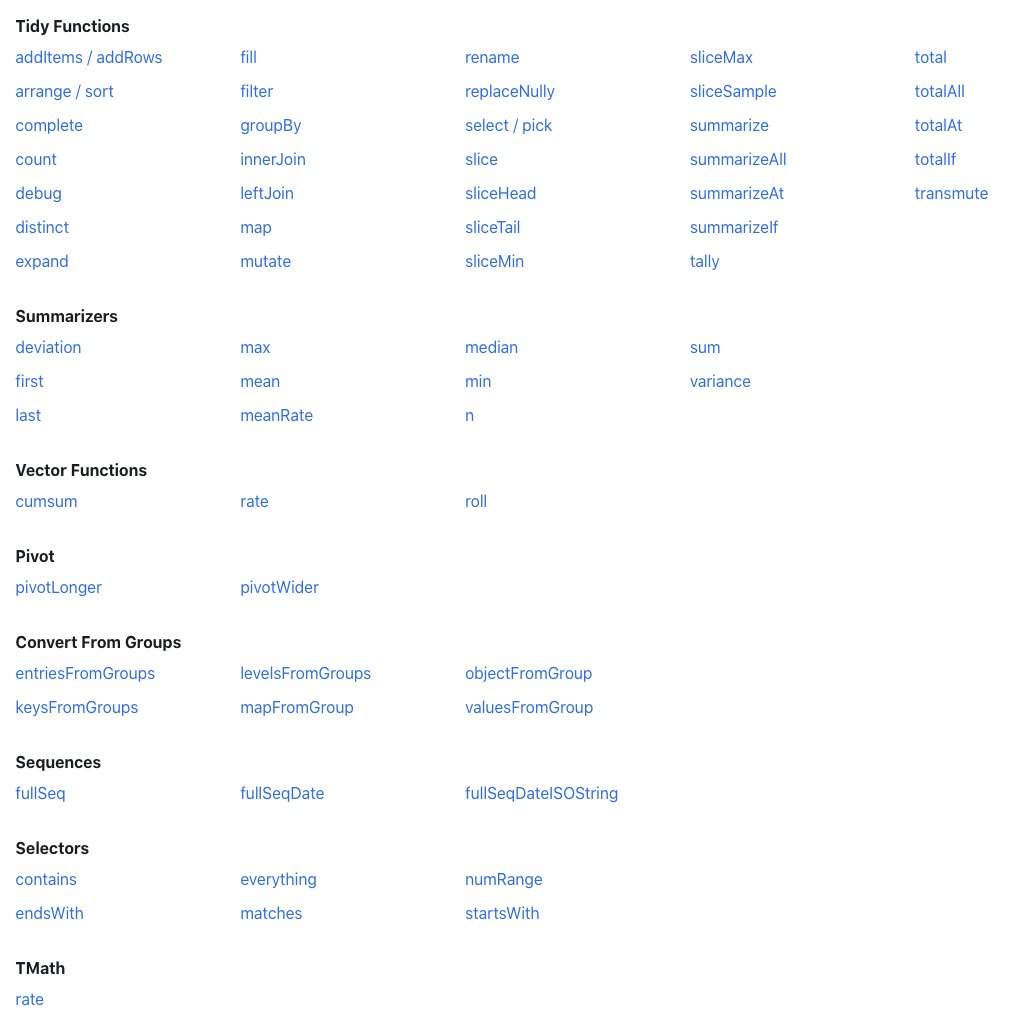
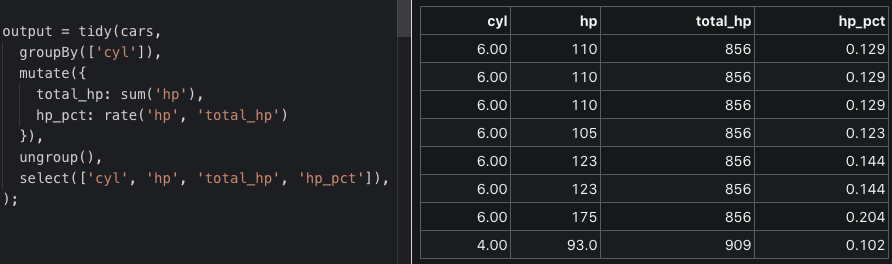
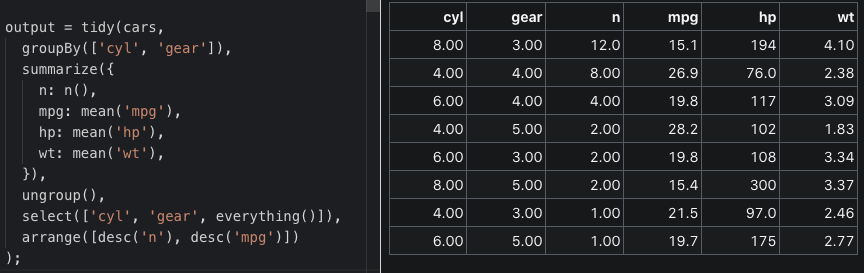
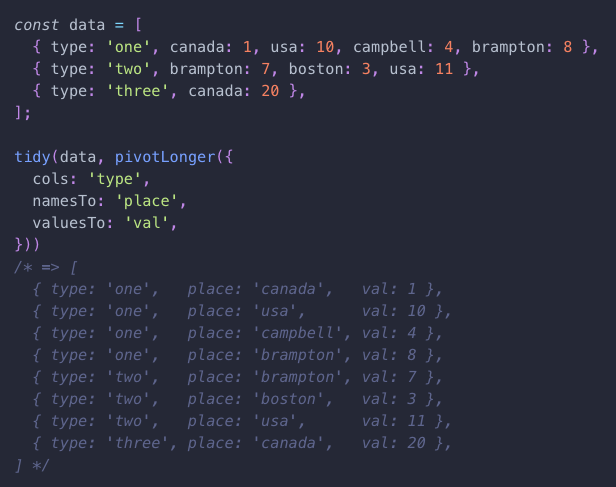
A few months ago I made Tidy.js, a javascript data wrangling package modeled after #rstats dplyr. It works on plain arrays of js objects. Curious if there'd be any interest in this lib if I were to open source it (currently it's internal to Netflix) esp given arquero now exists.
16
24
301
Peter Beshai retweeted

1 May 2023
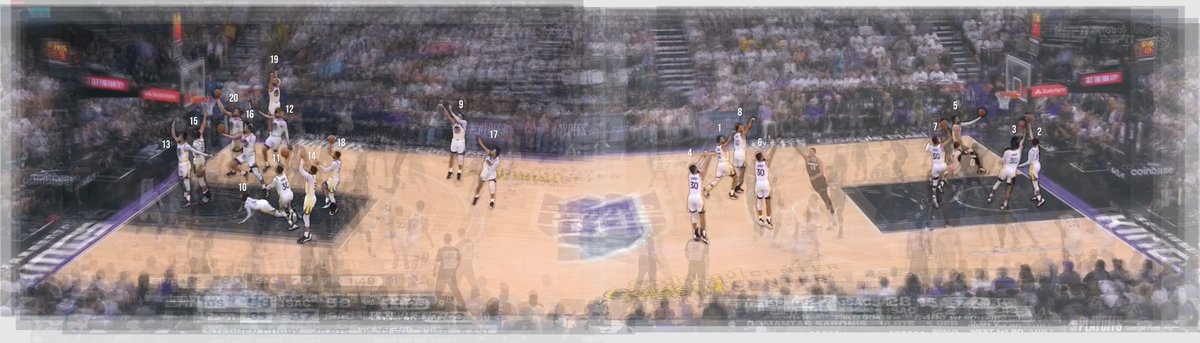
Steph Curry's 20 made shots from Game 7.
80
931
7,098
645,909
Peter Beshai retweeted

20 Nov 2022
The Spellcaster, my new #webgl experience using #threejs, #gsap and a ton of #shaders. I guess you got the reference. 🧙
💫 adinunz.io/spellcaster/
#gpgpu #realtime #glsl #particles #trails #parametriccurves #instanced
24
101
698
Peter Beshai retweeted

10 Nov 2022
we can _finally_ talk about an experiment @GitHubNext in the works for a long time: GitHub Blocks!
tldr
✨
There's a lot more to your codebase than just.. code. We want to make it easier to create interactive docs, support your team workflows, and bring your repo to life
✨
🧵

34
205
1,431
Peter Beshai retweeted

30 Jul 2022
There are a ton of threads and advice on Twitter. But the best advice I can give you is just build something. Use a tutorial to start, change it into something you want. You will never learn more and as fast as you do, building something of your own
25
114
814
Peter Beshai retweeted

30 Jul 2022
#rstudioconf2022 was so busy talking about R & Python we overlooked a WAY CRAZIER combo in @quarto_pub: R & @observablehq! 🤯 We can do #rstats stuff in one chunk and DIRECTLY PASS THAT into an observable chunk for plotting!? I can fangirl D3 and R in ONE notebook! Blogging ASAP
12
20
193
Peter Beshai retweeted

19 Jul 2022
Join me in an hour for my discussion with @pbesh about what it takes to become a successful data visualization engineer! #datavisualizaiton
18 Jul 2022

Tomorrow for my next #vizcareers interview, I'm hosting @pbesh, Staff #Datavisualization Engineer in @NetflixEng. His career journey intersects with so many early trends in 3rd Wave #Dataviz like #D3js, @OpenVisConf, dataviz pioneer @bocoup and more.
youtube.com/watch?v=7a79djXj…
1
3
18 Jul 2022
Excited to talk with Elijah tomorrow about my path through the software engineering -> data viz world
18 Jul 2022
Tomorrow for my next #vizcareers interview, I'm hosting @pbesh, Staff #Datavisualization Engineer in @NetflixEng. His career journey intersects with so many early trends in 3rd Wave #Dataviz like #D3js, @OpenVisConf, dataviz pioneer @bocoup and more.
youtube.com/watch?v=7a79djXj…
1
4
23
Peter Beshai retweeted

8 Jun 2021
WebGL 2 is enabled in yesterday's iOS/macOS/etc Safari releases. Also, everything is now running on top of Metal via ANGLE. Please test measure your content and report bugs.
15
103
689
Peter Beshai retweeted

8 Jun 2021
I helped build this visualization of a library collection for Ireland’s entry in the London Design Biennale. Cool project and a fun technical/interface challenge: collection.dropeverything.ne…
11
46
279
24 May 2021
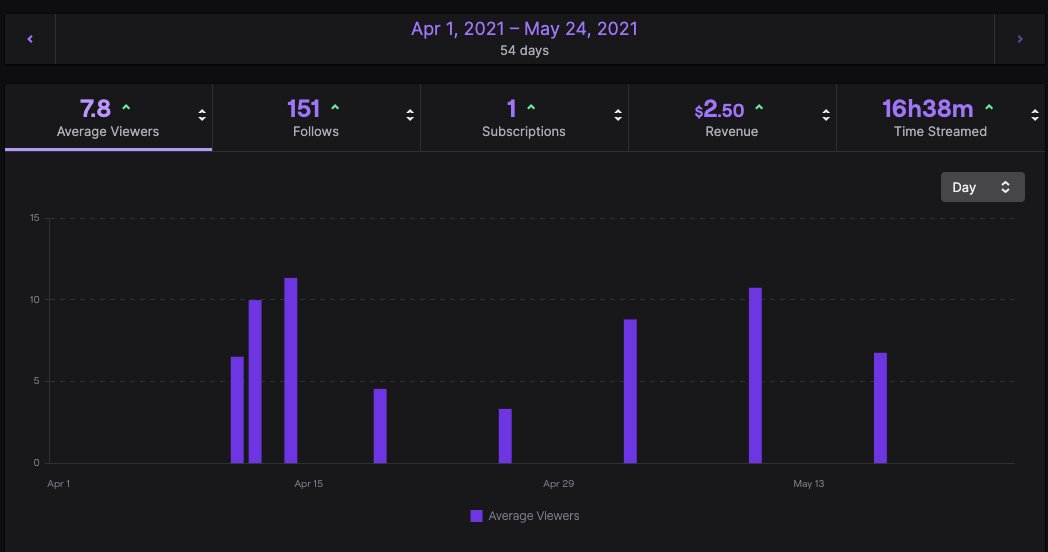
Decided I'm going to take a break from streaming. It was pretty fun! But a bit stressful to keep thinking of things to make on stream. Avg 7.8 viewers over 8 streams (16.5hrs), became an affiliate. Pretty happy with the experience overall, but also happy to have that time back.
7
20
24 May 2021
and to be clear (and for my own posterity), that's average concurrent viewers.
333 unique viewers
58 unique chatters
564 live views
seeing a few people return was always nice :) Twitch is a cool place to build a community. Educational content better on async platforms imo
1
24 May 2021
Big thank you to everyone who came by to chat and hang out with me during streams! 🙏
3
Peter Beshai retweeted

19 May 2021
All my Keynote presentations moving forward...

3D pie chart generator in your browser with React, Three.js, and R3F (React Three Fiber)? @pbesh makes it look easy as, well... 3dpie.peterbeshai.com/
2
4
19 May 2021
holy cow @github? we out here! 🤯
3D pie chart generator in your browser with React, Three.js, and R3F (React Three Fiber)? @pbesh makes it look easy as, well... 3dpie.peterbeshai.com/
7
44

threejs has a market, today we release market.pmnd.rs 🎉
🔎 free minified/ready-to-use CC0 models/textures/hdris
🚥 starters for threejs and react-three-fiber
👤 accounts
📬 request assets
🥇 favorites
🔌 api endpoint
☁️ CDN with caching
📦 npm install assets soon
32
288
1,641
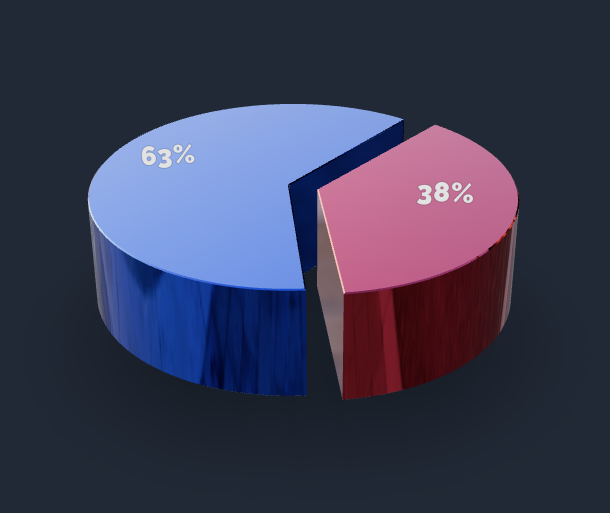
18 May 2021
🥧🚀 Find me a window sill because these 3d pie charts are freshly baked. The filling: react threejs r3f and a splash of #dataviz disdain. Try it out live in the browser:
3dpie.peterbeshai.com
code on github:
github.com/pbeshai/3dpie
17
25
188
18 May 2021
#dataviz tends to hate 3d pie charts due to their perceptual shortcomings, but honestly after playing with them while making this project, I think they're kinda fun. And anything that can make data fun has value if you ask me ✌️
3
1
7
18 May 2021
2
7