
Planet OS is the one-stop-shop for weather and climate data, supporting leading energy companies, top research institutes & climate innovators worldwide.
Joined September 2011
- Tweets 5,914
- Following 887
- Followers 2,842
- Likes 39,433
717 Photos and videos


26 Oct 2021
Great article on the importance of community energy in addressing the climate crisis. We profile the work of Planet OS user @Enercoop_SCIC. Their energy cooperative model is a trailblazing example of how community energy can empower communities.
medium.com/planet-os/cop26-l…
1
1
17 Aug 2021
We recently included a new dataset into Datahub - DWD ICON. This is a regional European short-range forecast detailed in the graphic below. Temperatures in southern Spain and Portugal set to soar in the next few days!
1
2
12 Aug 2021
Our latest blogpost written by @pkeys dives into climate change and its effect on the semiconductor industry. Fascinating insight into the danger of droughts on our vital supply chains.
medium.com/planet-os/climate…
9 Aug 2021
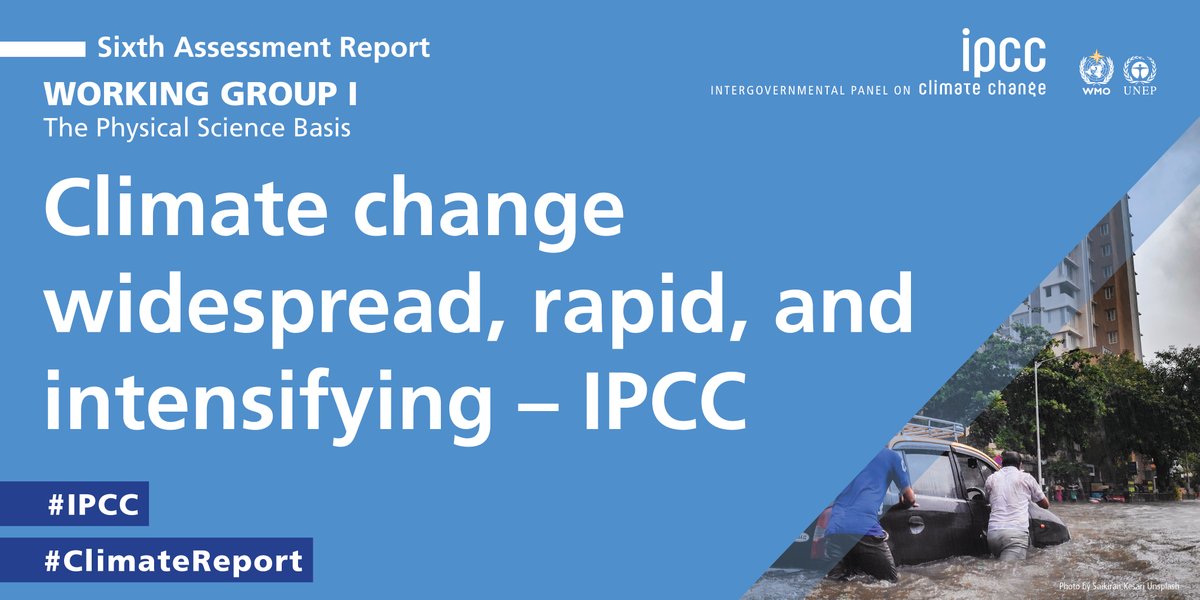
IPCC reports have continually sounded the alarm on humanity's GHG emissions, but this year's report which arrives as many are recovering from devastating floods and fires, shows that we must act NOW.

#ClimateChange is widespread, rapid, & intensifying – #IPCC
Scientists are observing changes in the Earth’s climate in every region & across the whole climate system, says the IPCC’s latest #ClimateReport, released today.
➡️ bit.ly/WGICC2021PR
➡️ bit.ly/WGICC2021
1
1
1
9 Aug 2021
@planetos and @IntertrustTech, we committed to developing data-driven technologies that will help businesses, governments and other organizations to tackle climate change.
1
12 Jul 2021
Scorching summer heatwave across Europe this July, with much of South and Eastern Europe reaching record temperatures.
2
2
8 Jul 2021
"Are people actually prepared for this to happen again? From what I’ve read, probably not very much."
medium.com/planet-os/a-discu…
6 Jul 2021
Make sure to read our discussion with Andres Luhamaa about climate risk and its implications for energy infrastructure.
How resilient and adaptable are our energy systems to climate change?
medium.com/planet-os/a-discu…
22 Jun 2021
Record breaking temperatures hit Europe this June, as shown by GFS Forecast data from the Planet OS Datahub.
1
7 Jun 2021
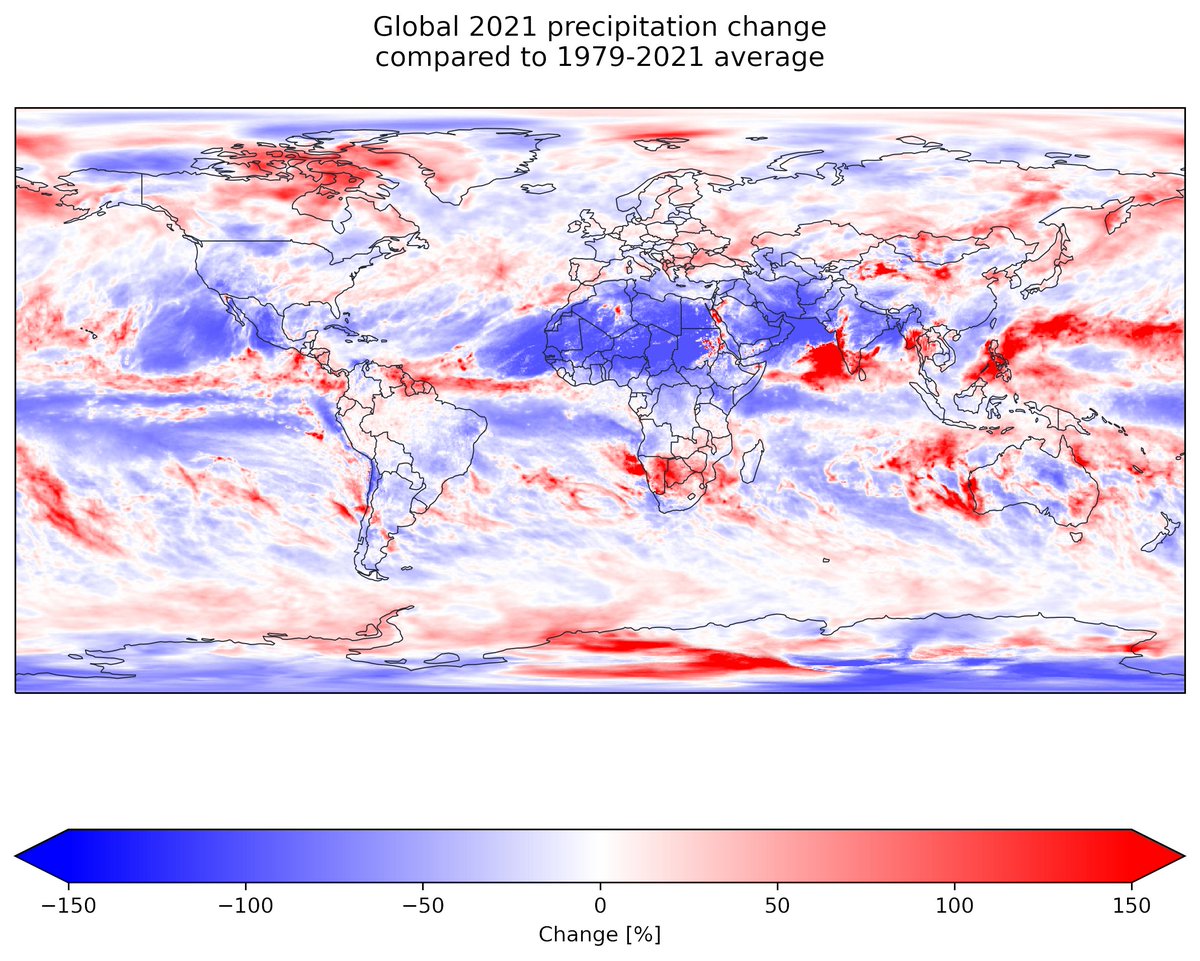
Droughts are becoming more common across the globe. Using the ERA5 dataset, we pulled up this image that details the drop in precipitation levels across places like the Western US, Central Africa and Brazil. Check out Planet OS Datahub to access more climate & weather datasets.
2 Jun 2021
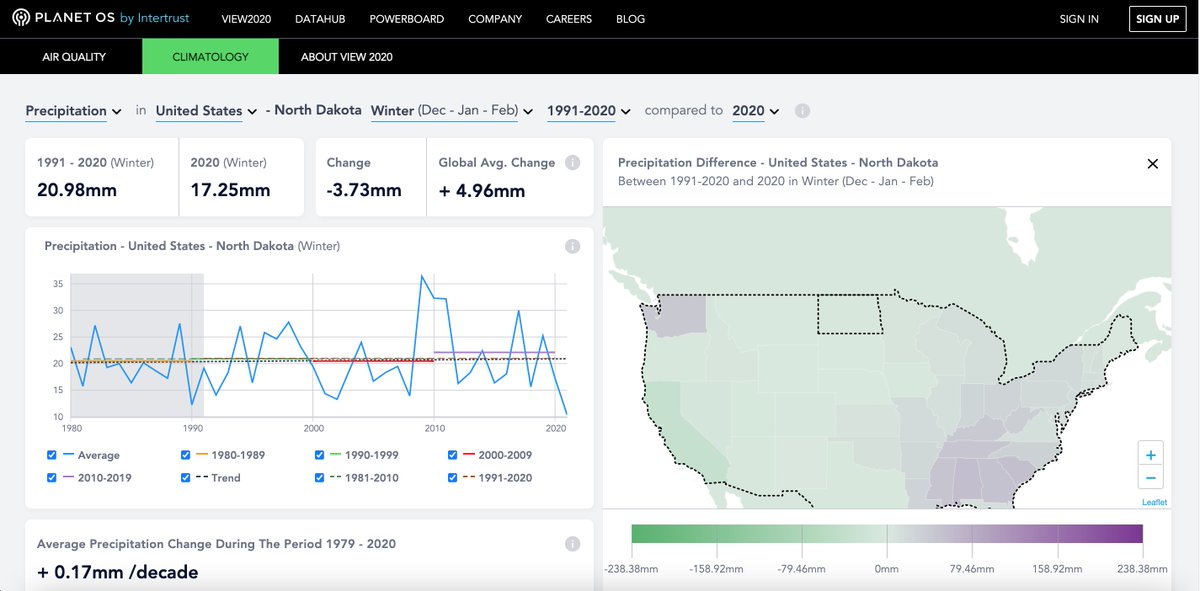
Large parts of the US are suffering from drought - California, Arizona & North Dakota. In this graphi, we use the ERA5 dataset to show how precipitation has dropped sharply in North Dakota at the beginning of 2021. Head over to planetos.com/View2020 for more climate insights.
22 Apr 2021
Happy Earth Day from all of us at Intertrust & Planet OS!
Today and as we emerge from lockdowns, it is vital that we ask: "What have we learned? How can we reduce our impact on the environment in a sustained way?"
These questions pose a challenge that we all must rise to.
22 Mar 2021
Happy #WorldWaterDay!
Clean water is essential for maintaining healthy ecosystems and this vital resource must be protected. Using our View2020 Climatology page, you can see how global precipitation levels have changed over the last 40 years.
planetos.com/view2020/climat…
11 Mar 2021
Planet OS dove into the 2021 Texas Freeze & analyzed previous cold weather events in the Lone Star State.
On the Intertrust Blog this week, you can read about its impact on Texas's energy supply & how data management can prevent further power outages.
medium.com/planet-os/digging…
1
3
23 Feb 2021
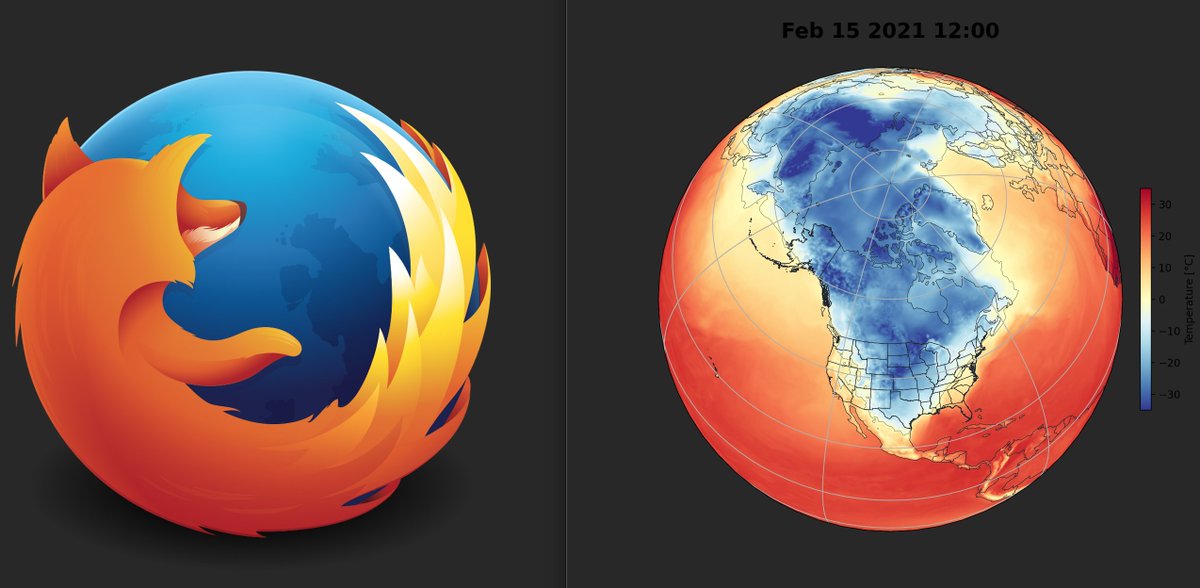
February's Arctic chill in North America bares a striking resemblance 🦊
Always be friends with the warm and fuzzy fox to keep the cold away! #firefox
1
3
9 Feb 2021
View2020 update! We have added a new climatological normal 1991-2020 to our Climatology dashboard. This is a 30 year climatological average & it's used as a baseline to evaluate climate events and variability. View2020 - data driven climate insight.
planetos.com/view2020/climat…
2
22 Dec 2020
View2020 Wrap! Looking back on the year, we can use View2020 to see how our climate has changed... Notice that this Autumn (Sep-Nov) Global temperature saw an increase of 1.13°C comparing 1980 to 2020 🔥
We are looking towards 2021 to #buildbackbetter.
planetos.com/view2020/climat…
12 Nov 2020
Great article by our Summer Intern - Arthur Kaspar - on climate change's impact on Alaska. The data analysis in this article was generated using our View2020 Climatology dashboard. For further info, please visit: planetos.com/view2020
medium.com/planet-os/how-cli…
11 Nov 2020
planetos.com/view2020
Check out our View2020 Climatology dashboard to see how the average temperature in your country has changed over the last few decades...
28 Oct 2020
We launched the new View2020 Climatology dashboard today! This dashboard tracks how our climate has changed since the 1970s.
Check out our Medium blog that explains how the dashboard works.
medium.com/planet-os/introdu…