
Joined February 2012
- Tweets 355
- Following 283
- Followers 529
- Likes 618
79 Photos and videos


Pinned Tweet

7 Jul 2022
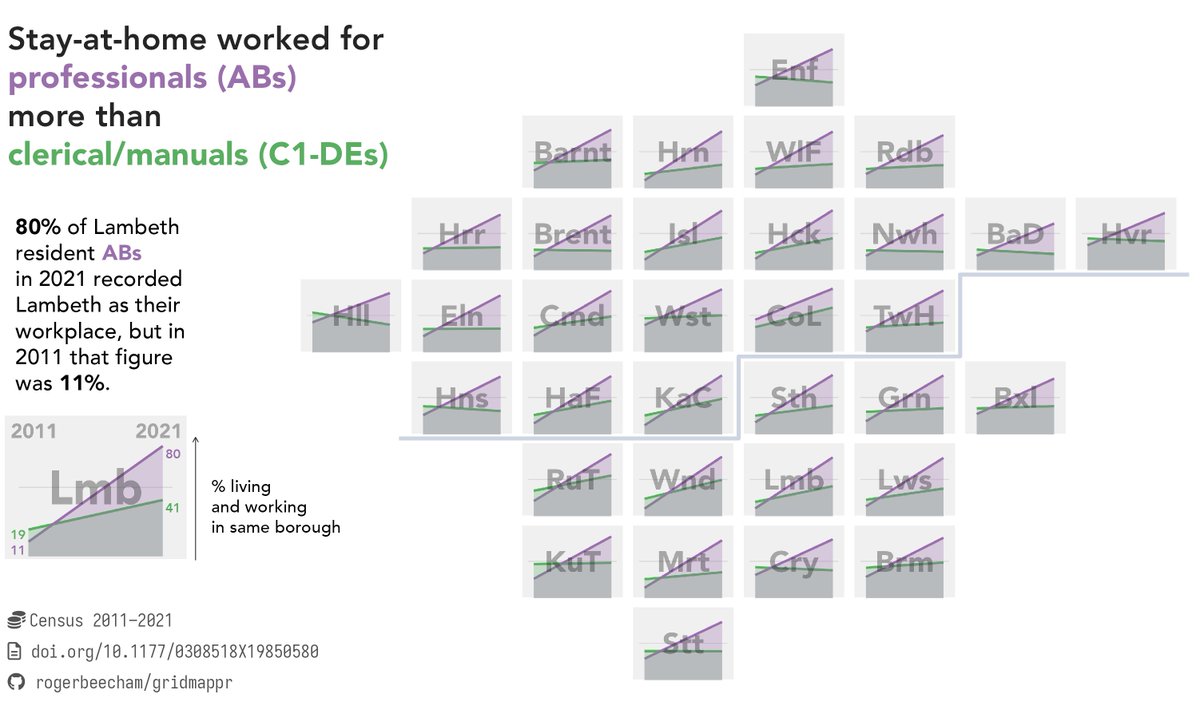
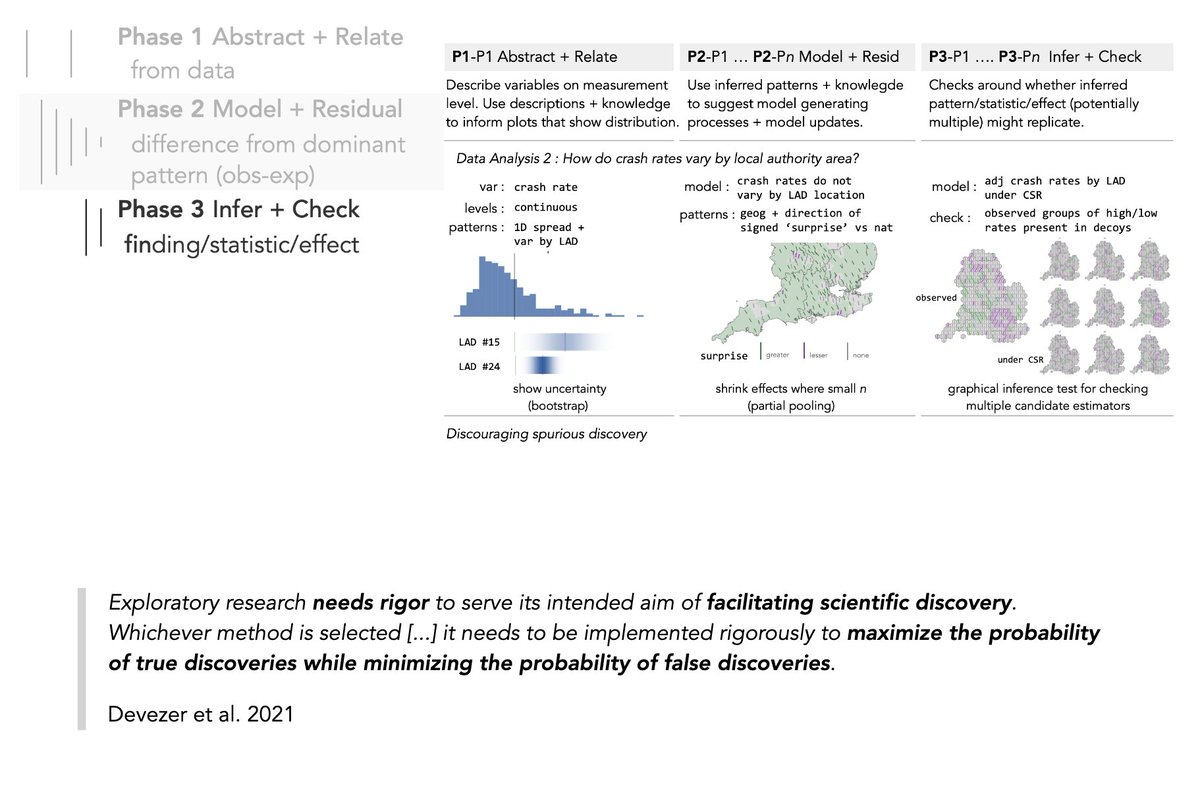
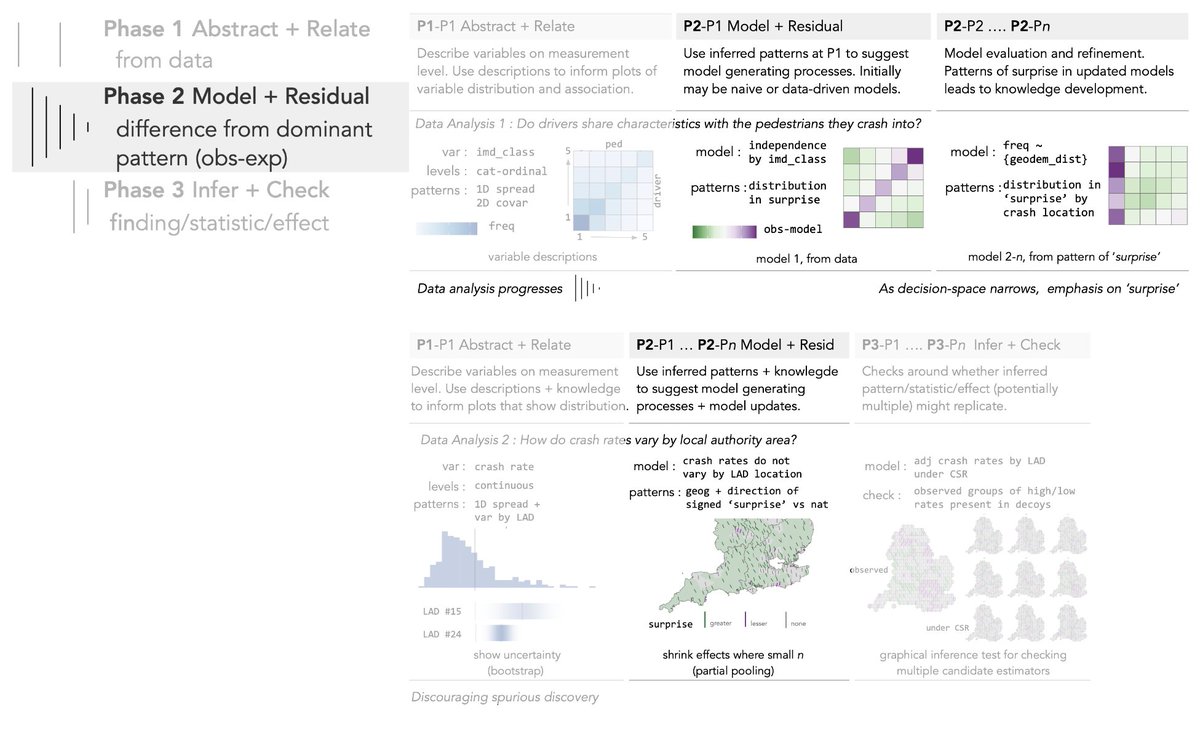
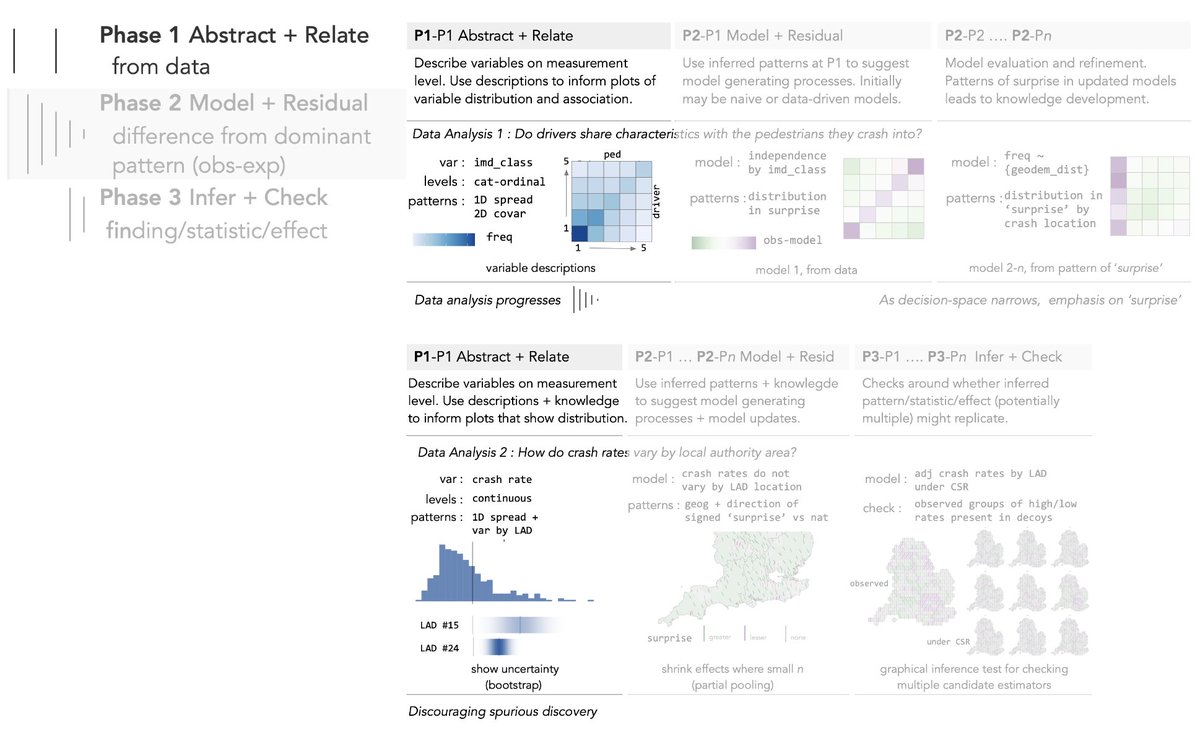
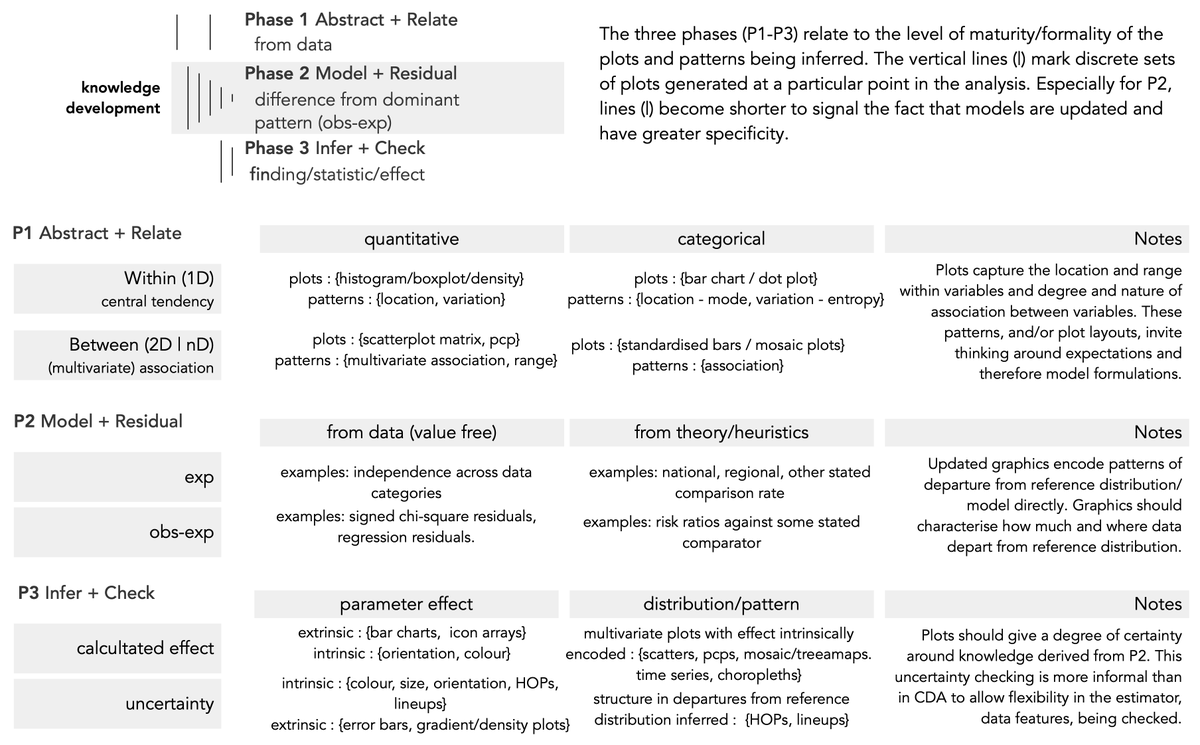
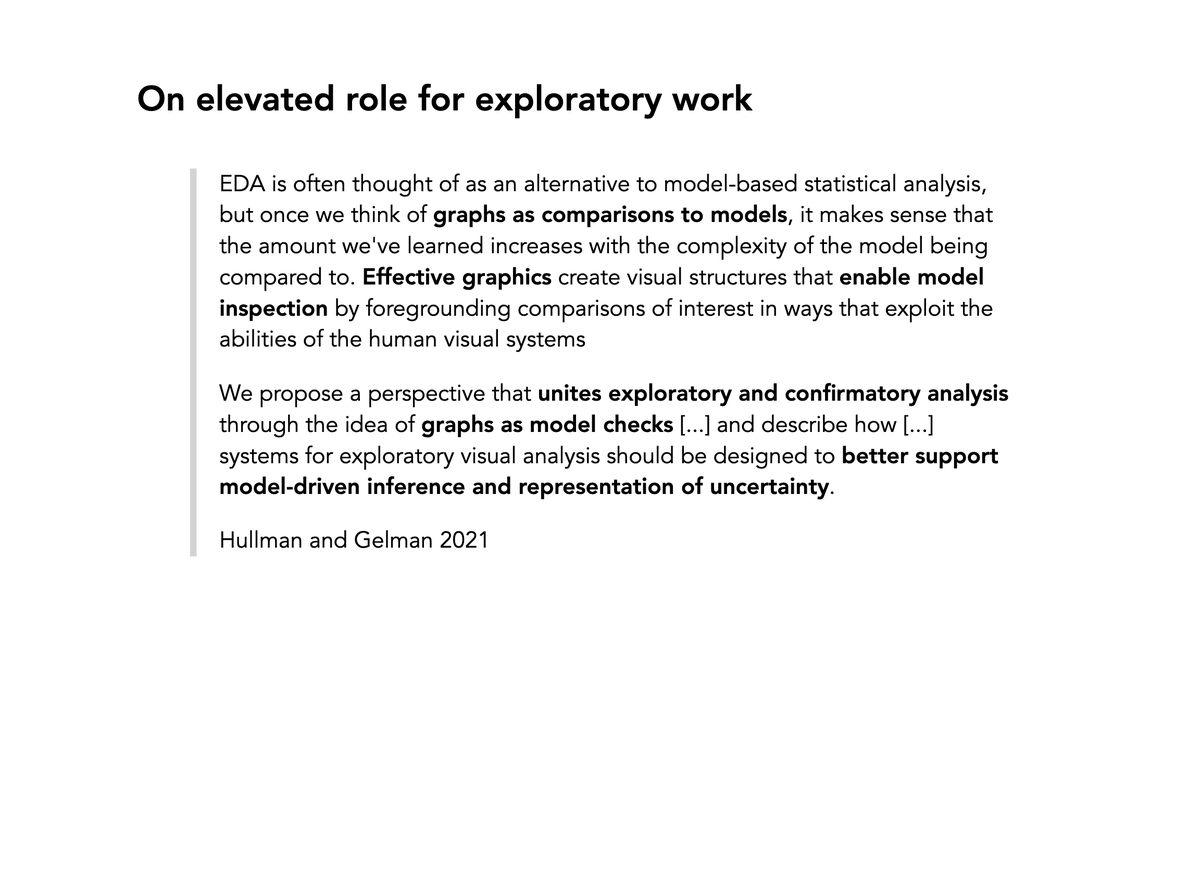
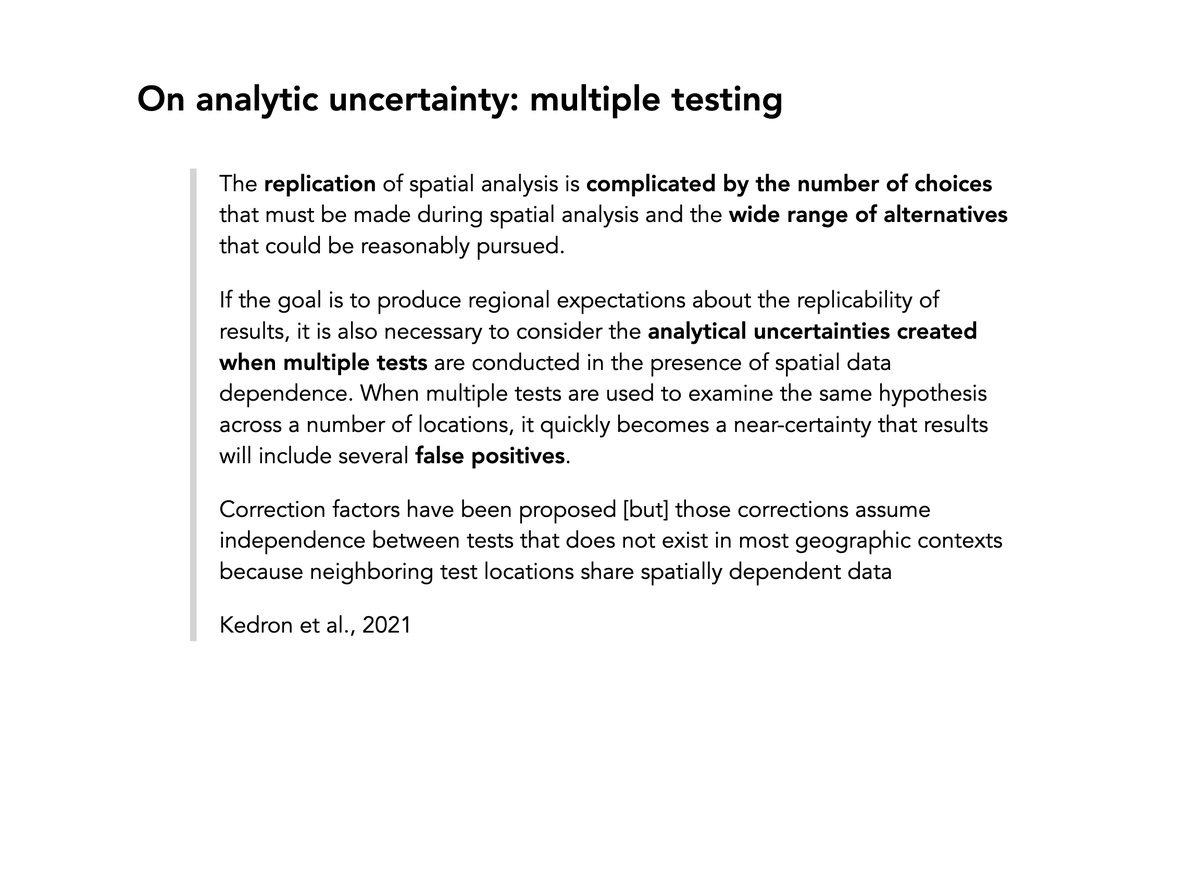
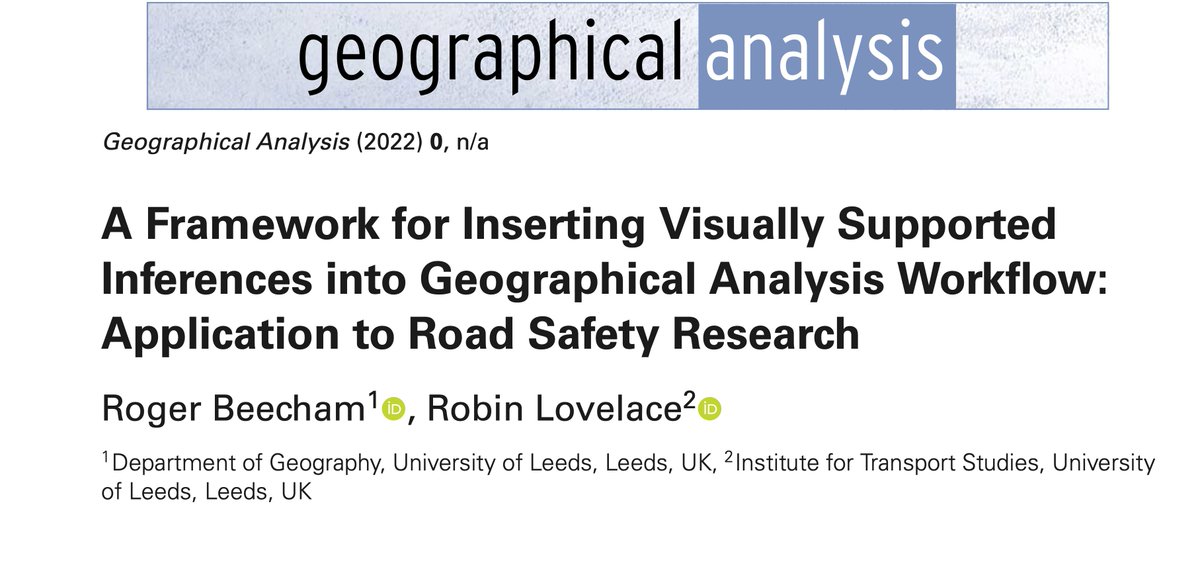
Pleased to see this paper w/ @robinlovelace out in @GeogAnalysis. Ideas in it have been germinating for a while (since PhD) -- and difficult to precis -- but here's an attempt. (doi.org/10.1111/gean.12338) (1/n)
1
7
32
21 Oct 2024
👋 UPDATE: Deadline for this one has been shifted to Dec 31st: journals.sagepub.com/pb-asse…
Be great to see some excellent GISRUK outputs showcased here!
5 Feb 2024

📢 Calling @gisruk-ers, recent past 2024 (2024.gisruk.org/). We've an @envplanb SI for showcasing the community's excellent Data/Code outputs.
Submissions due: Sep 24. 👇
journals.sagepub.com/page/ep…
6
5
1,092
Roger Beecham retweeted

Our course with @rJBeecham teaches you how to explore structure in social science data using R statistical programming.
It'll equip you with the critical analysis, design and technical skills to analyse and communicate with data.
Find out more: bit.ly/4bPrPDg
#ESS2024
1
2
403
Roger Beecham retweeted

21 Jun 2024
It was such a pleasure and privilege to chair this session for @rJBeecham and I. Three excellent talks from three brilliant minds and a stimulating panel thanks to an engaged audience. One of the highlights of our #tmcf workshop — theory4ida.github.io/tmcf/
21 Jun 2024

As part of Theory and Method Challenge Fortnight, the Turing hosted a public lecture at @KingsCollegeLon: Rigour, imagination & production in data-driven science, with world-leading speakers @HadleyWickham, @JessicaHullman & Andrew Gelman.
➡️bit.ly/4bSKm1D
@AiAtKings

2
13
1,074
Roger Beecham retweeted

21 Jun 2024
As part of Theory and Method Challenge Fortnight, the Turing hosted a public lecture at @KingsCollegeLon: Rigour, imagination & production in data-driven science, with world-leading speakers @HadleyWickham, @JessicaHullman & Andrew Gelman.
➡️bit.ly/4bSKm1D
@AiAtKings
4
18
3,914
Roger Beecham retweeted
17 Jun 2024
🌐Navigating the Garden of Forking Paths: The Turing's 2024 Theory & Method Challenge Fortnight starts today!
Highlighting theoretical foundations & methodological advancements in #AI research, learn about the research collaboration & instigation event: bit.ly/3VjR6PC

1
10
2,141
Roger Beecham retweeted
12 Jun 2024
Really excited for this lecture by our excellent #TMCF workshop participants at @turinginst next week. Thanks to @aiatkings and @binocularity for hosting. Also see details of the workshop that we are co-organising with @rJBeecham here - theory4ida.github.io/tmcf/
12 Jun 2024
🗪 #PublicLecture: Rigour, imagination & production in data-driven science
📅 20 Jun🕰️5.30–8.30pm📍 @KingsCollegeLon 🆓🎫bit.ly/4bWthUy
Mark Theory & Method Challenge Fortnight w/ Andrew Gelman (@StatModeling), @JessicaHullman & @HadleyWickham.
#AI #DataScience
2
6
795
10 May 2024
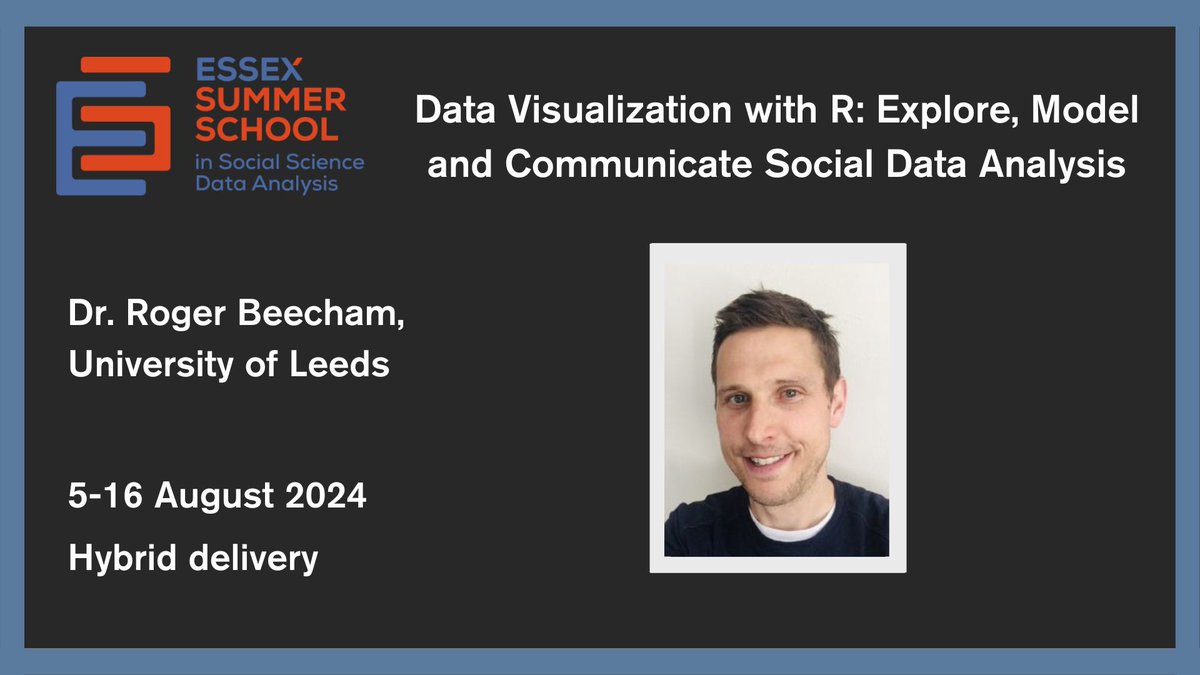
👋 Probably my favourite activity is teaching this course at @EssexSumSchool (essexsummerschool.com/summer…), 5th -- 16th Aug w/ applications closing 22nd Jul.
Try to vary content each year, but 🧵 below gives a nice overview.
Please DM / e-mail if interested want to learn more!
22 Apr 2022
Very excited to be returning to @EssexSumSchool to run this two-week course (bit.ly/3jXS6H0) in hybrid -- campus and online .
#rstats #dataviz #uncertaintyvis #datastorytelling #computationalsocialscience.
[1/n]
8
41
6,047
Roger Beecham retweeted

12 Apr 2024
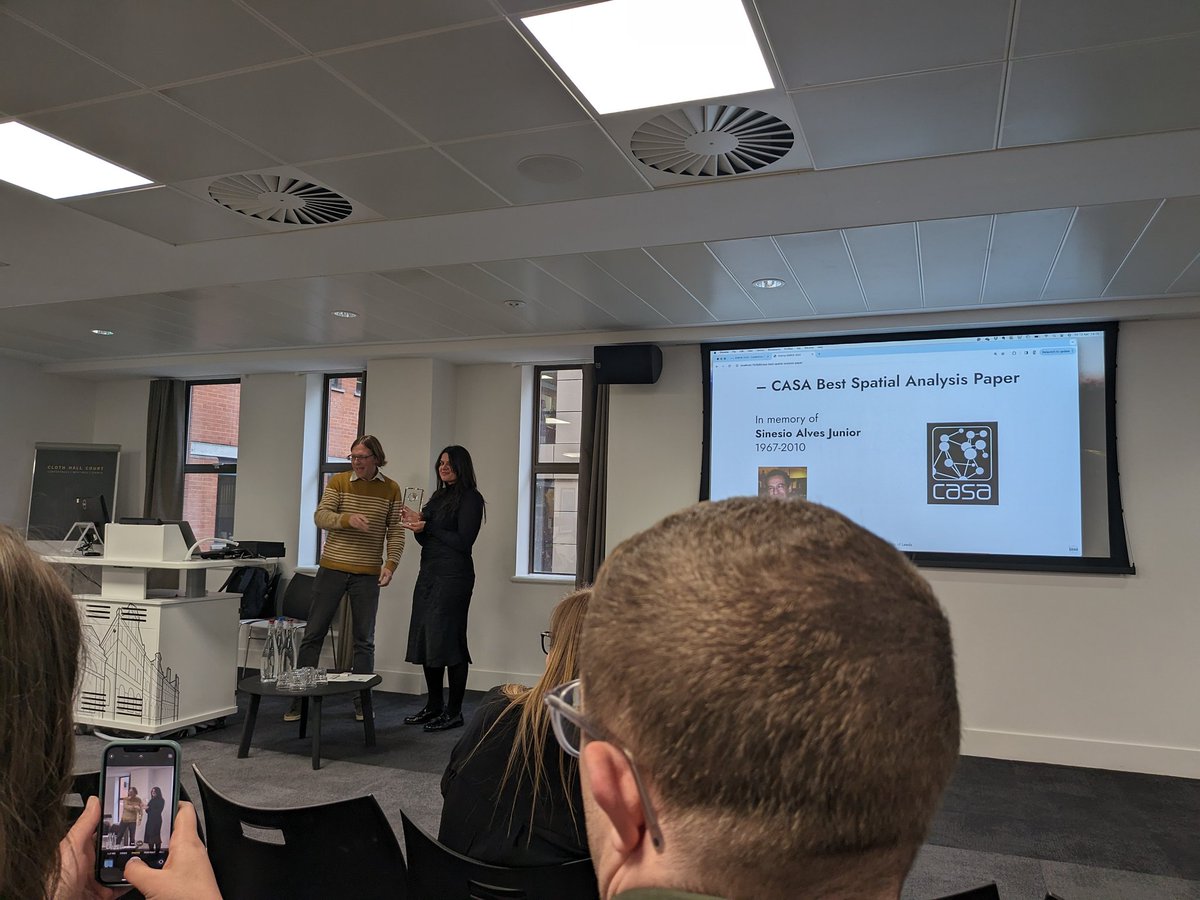
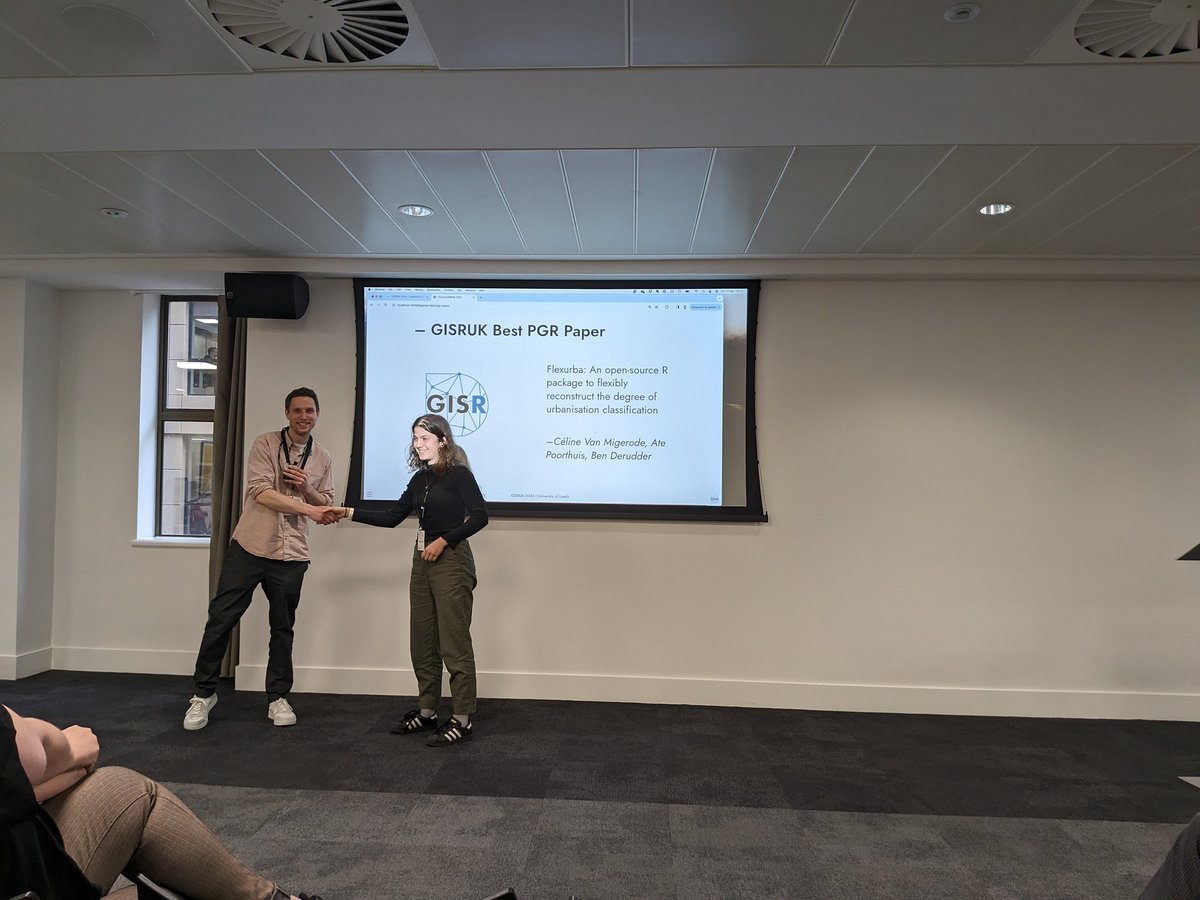
Congratulations on all best paper awardees... Can't find them to tag them so I hope they follow #GISRUK

4
7
1,027
Roger Beecham retweeted
12 Apr 2024
Yet another fantastic @GISRUK. Thanks to @rJBeecham and colleagues at @UniversityLeeds for such a great conference #GISRUK2024
Looking forward to next year in Bristol chaired by @levijohnwolf

2
7
32
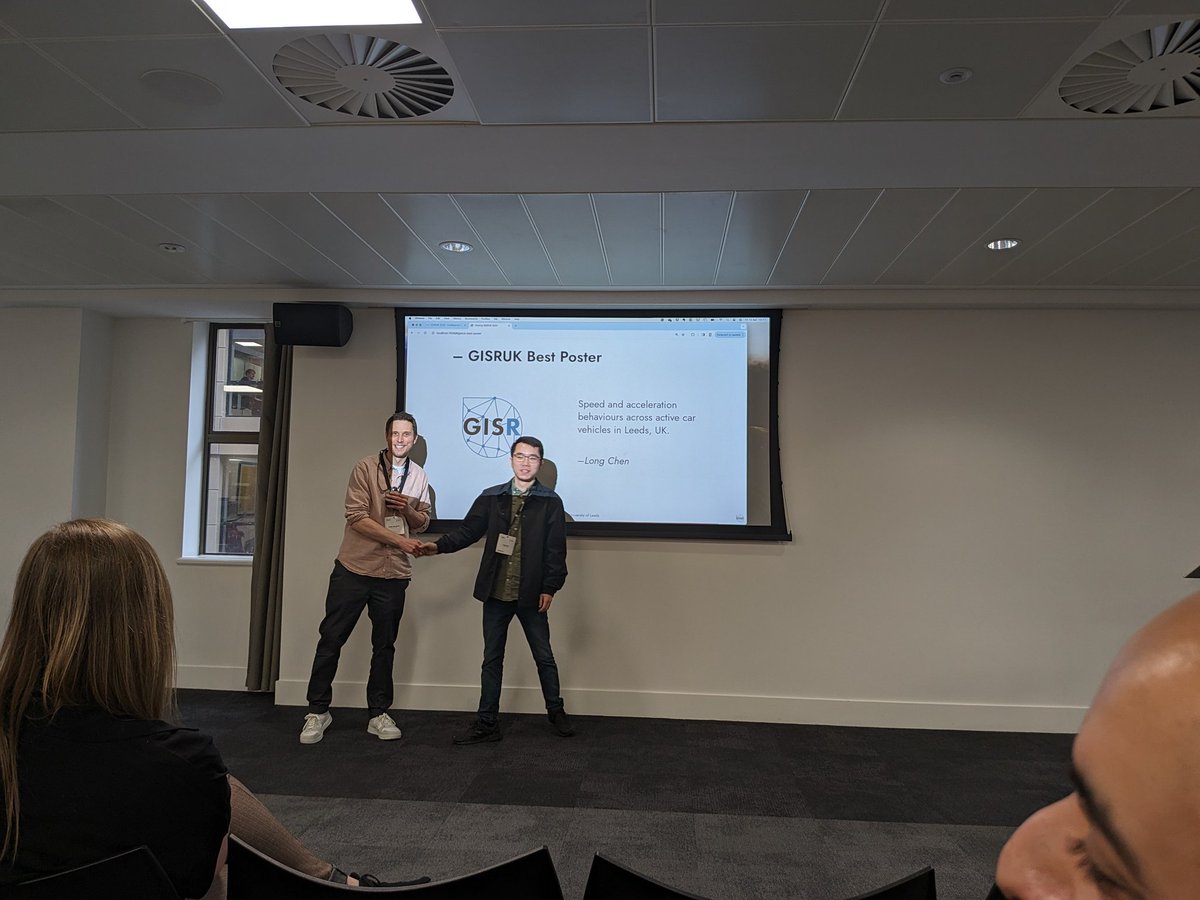
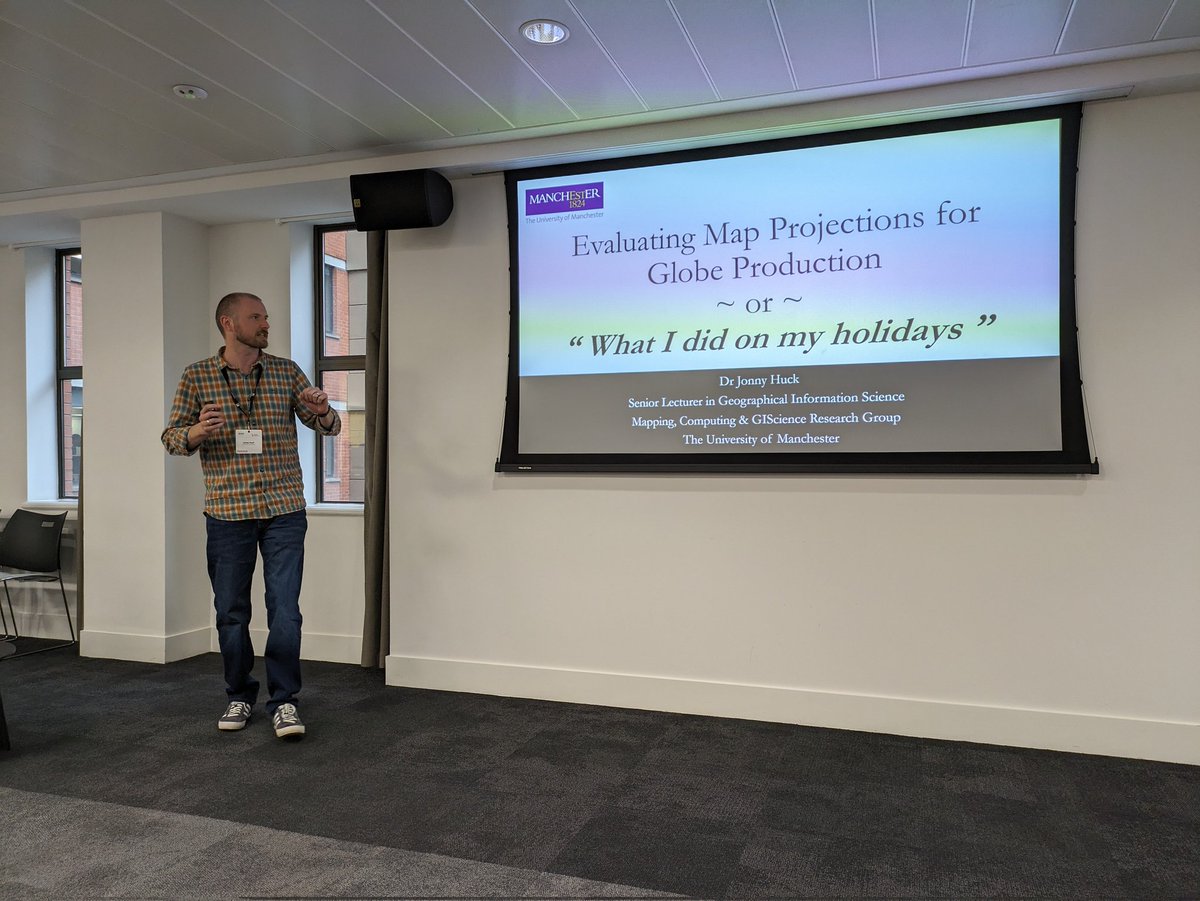
1,903

Ending the day with some great presentations on visualisations from @rJBeecham, @jonnyhuck and @rwesterh87!

2
14
847
6 Apr 2024
Excited to see this @rwesterh87 — see you in Leeds!
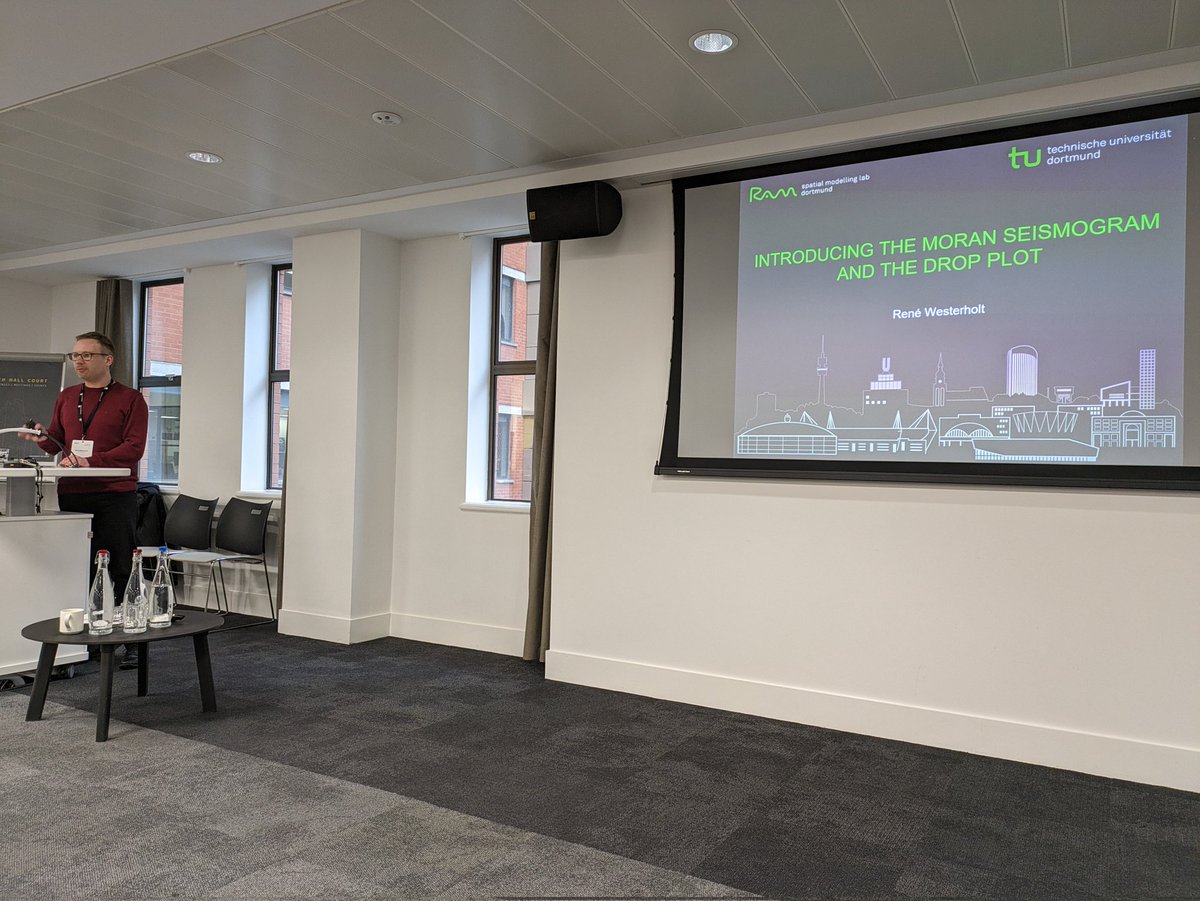
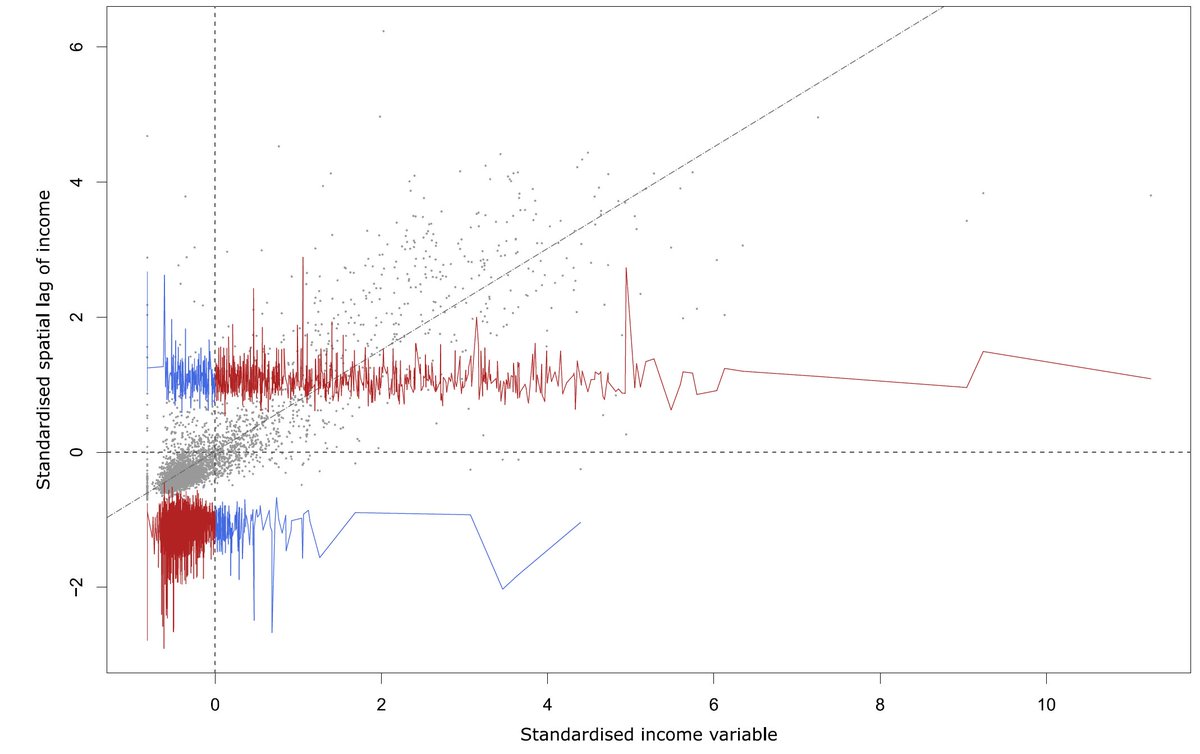
6 Apr 2024

Looking forward to attending @GISRUK next week! I'll present two ideas of fun plots for spatial data analysis at the visualisation session (Wed, 4pm): Moran drop plot and seismogram, both adding critical and p-values to the Moran scatterplot.
Short paper: doi.org/10.5281/zenodo.10897…

1
1
363
👋 A reminder that #gisruk2024 registration closes 1st April! 👋
As ever, check website for details and updates on programme, events, socials, prizes, etc.
2024.gisruk.org/
4
5
637
👋 A reminder that early bird registration for #gisruk2024 closes Monday 18th March! 👋
Latest updates at 2024.gisruk.org/

📢 Registration for #gisruk2024 is now open!
* Early bird deadline: *18th March*
* Fee waiver bursary deadline: *4th March*
Details on website... 👇
2024.gisruk.org/
3
1
803
Roger Beecham retweeted
12 Mar 2024
Super happy to be part of this initiative and look forward to welcoming our future PhD candidates for lots of exciting research on #Datavisualization
12 Mar 2024

CIM is thrilled to announce our upcoming Centre for Doctoral Training in Diversity in Data Visualization (DIVERSE-CDT) with colleagues from @CityUniLondon The #CDT will be recruiting over 60 PhDs starting October 2025. #dataviz #EPSRC_CDTs
warwick.ac.uk/newsandevents/…

ALT Abstract decorative image
5
4
21
1,863
Roger Beecham retweeted
We’re excited to announce that applications for ESS 2024 are NOW OPEN! Whether you’re interested in studying online or in-person this summer, we are offering a programme of nearly 50 courses in a range of social science research methods. bit.ly/3SS5FJ3
2
12
22
17,407
👋 A reminder that registration is very much open! 👋
We've a great line-up of papers, workshops and socials...
More to follow in coming weeks, but here's the *draft* programme: 2024.gisruk.org//program/
📢 Registration for #gisruk2024 is now open!
* Early bird deadline: *18th March*
* Fee waiver bursary deadline: *4th March*
Details on website... 👇
2024.gisruk.org/
1
1
722
Roger Beecham retweeted

21 Feb 2024
Only a few more days until applications for the 2024 Essex Summer School open. We're looking forward to another great summer school! @EssexSumSchool
#ESS2024 #BestNerdySummerCamp #WeAreEssex
18
31
4,782
📢 Registration for #gisruk2024 is now open!
* Early bird deadline: *18th March*
* Fee waiver bursary deadline: *4th March*
Details on website... 👇
2024.gisruk.org/
4
1
2,436
5 Feb 2024
📢 Calling @gisruk-ers, recent past 2024 (2024.gisruk.org/). We've an @envplanb SI for showcasing the community's excellent Data/Code outputs.
Submissions due: Sep 24. 👇
journals.sagepub.com/page/ep…
11
16
3,164
Roger Beecham retweeted

Join the Data Science Mini Series: Travel & Transport to find out about current research projects at @LIDA_UK.
Hear three lightning talks from data scientists about their transport research.
📆 Thursday 8th Feb, 10-11am
📍 Room 11.87, Worsley
🔗 lida.leeds.ac.uk/events/data…

ALT A close up of railway tracks leading into the distance.
5
10
848