
Joined April 2013
- Tweets 5,749
- Following 1,805
- Followers 625
- Likes 15,983
862 Photos and videos


Pinned Tweet

20 Aug 2024
Should $DBRG Digitalbridge be taken private? CEO Ganzi has mentioned how private multiples are at least 2x public comps. Maybe a full take private by IFM?
100%
Yes
0%
No
11 votes • Final results
2
2
4
4,048
Saam retweeted

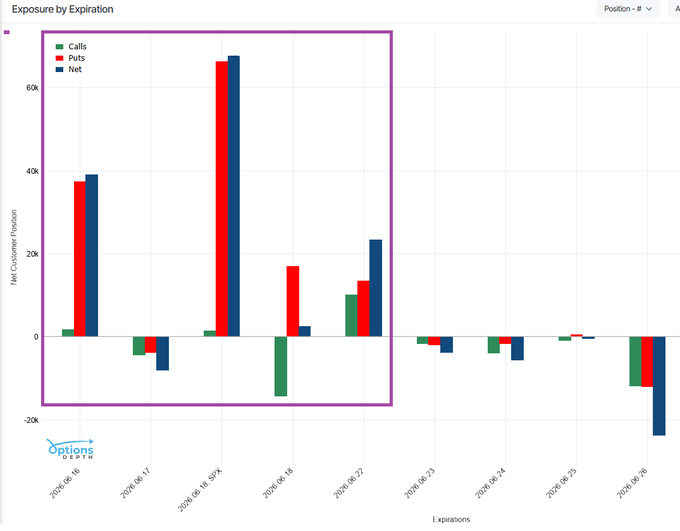
Net institutional positioning is defensive until Monday, next week -- the hedge unwind comes thereafter.
Put Buy and Call Sell hedging has been providing a systemic market bid to option market makers' hedge imperatives since the Iran special military operations. That looks to end after Monday next week.
5
30
2,874
Jun 15
🚩 $FISV
Jun 15

Fiserv’s turnaround must be going swell.
$FISV named Mike Lyons CEO just over a year ago and tasked him with digging into its issues and driving a turnaround. He held his coming out party Investor Day a month ago.
Today he leaves for Truist.
Nothing to see here; move along…


2
6
3,961
Saam retweeted

21 Jul 2023
We help ensure the safety of underground storage facilities, including salt caverns! The National Strategic Petroleum Reserve uses salt caverns thousands of feet underground to store oil. Salt is impermeable to oil and gas, making it ideal for storage. #PHMSAFactFriday
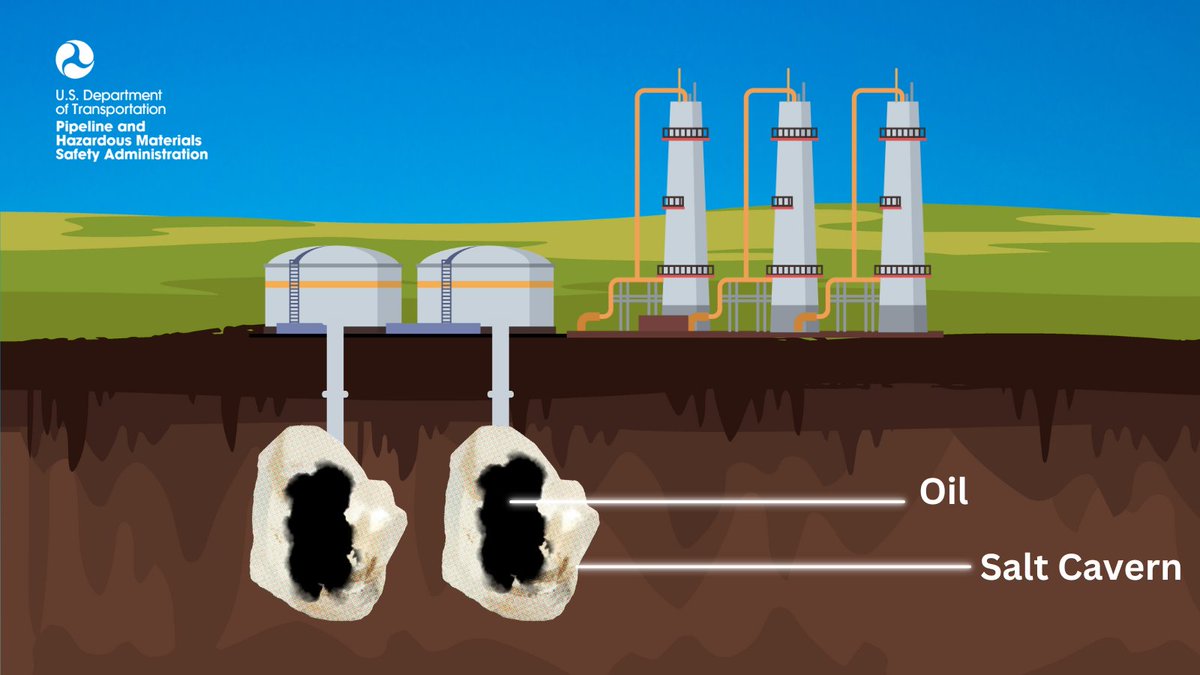
ALT A graphic example of an underground oil storage salt cavern.
8
16
1,202
Saam retweeted

Your reminder that the standing bid from Irth capital for @PapaJohns is now 47% above the current share price. $PZZA

2
1
6
1,370

Saam retweeted

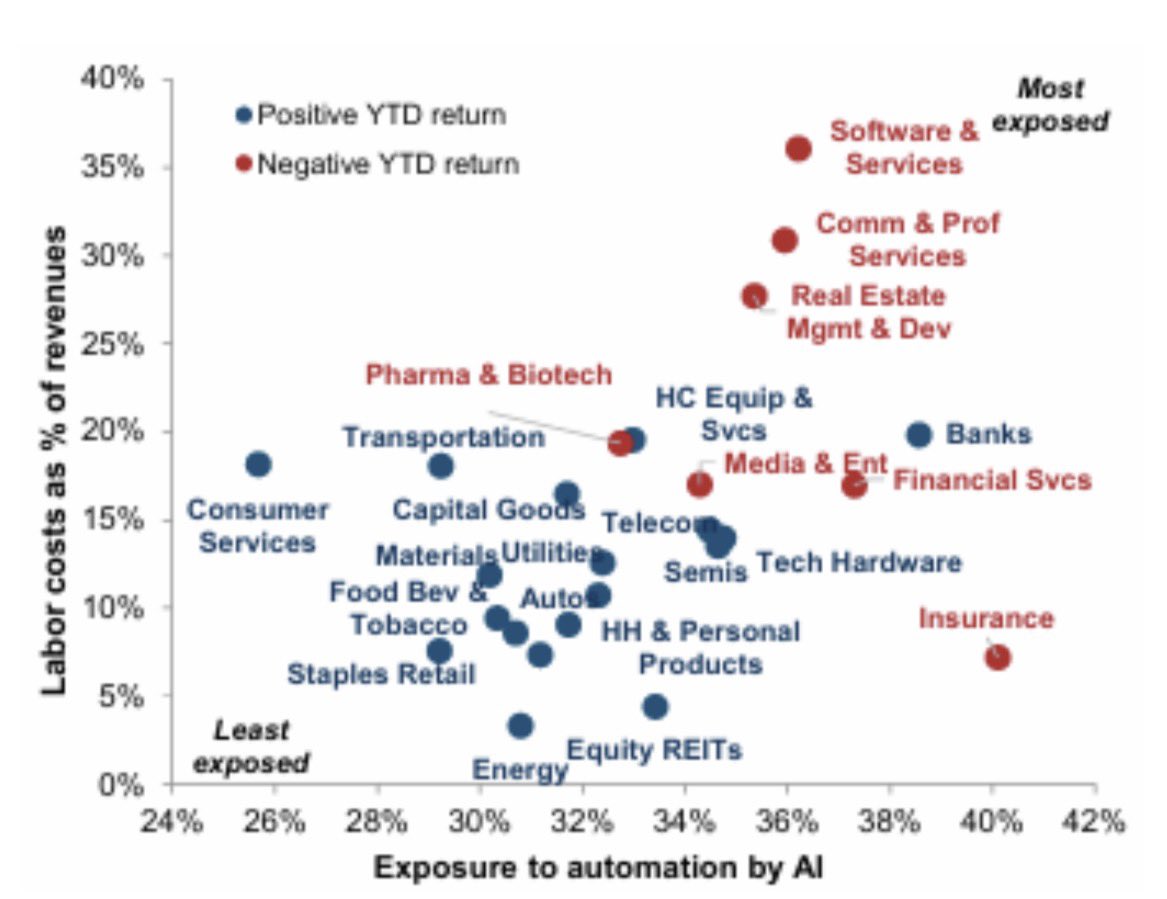
With AI taking over industries now
It seems insurance will have the most leverage in terms of adoption
Software and comms probably can deliver the most impact on margins and P/L given their cost of labor
$IGV could become interesting
1
1
5
432
Saam retweeted

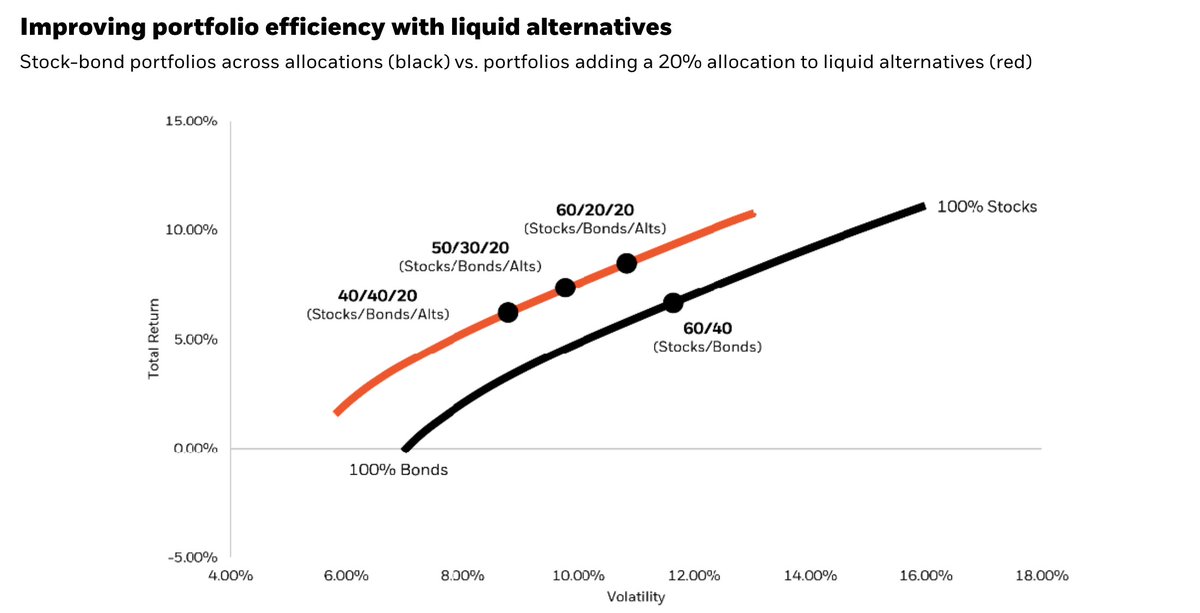
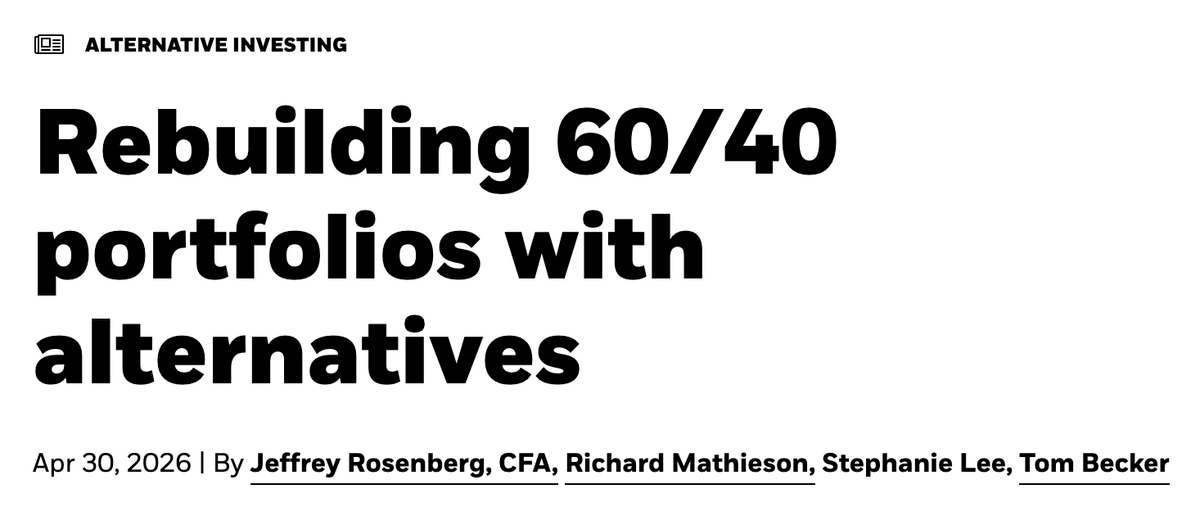
May 23
It means that the tail that used to wag the dog might not have the same sort of wagging affect that it did for decades prior. This is not good news for Bonds. Just last month, Blackrock came out and said the same..
1
1
1
105
Saam retweeted

May 23
I am going to be noisy about this - the Fed is concerned about inflation - rate of change - not price level. If higher energy price level doesn't feed higher rate of change (or only moderately impacts) in wages, services, etc. the Fed is fine with that.
1
1
5
415
Saam retweeted
Mar 10
$HPQ hovering around $19 despite 5 downgrades from the Street... yet Board is off to a strong start on repurchases. Investor Day in April CEO announcement... tick tock

The sell-side (& short-term oriented buyside) has driven $HPQ down to 6x earnings (with a 7% dividend) on the basis that "the price of memory has reached a permanently high plateau" (to quote Irving Fisher).
I'm taking the other side of that. I wonder if an acquirer might too.
1
1
2
340


May 14
May 13

$Lesl just printed a 6.6% SSS increase YoY with GM expanding like 400 bps YoY and back to ‘24 levels…
Yes it’s a low rev quarter but holy moly what a chance from last Q. If they’ve got this figured out and can drive some growth with a consumer tailwind….
1
1
198
Saam retweeted

May 4
$BWIN Q1 2026 earnings: Acquisition Fuels Top-Line Boom, But Dilution Crushes Earnings Growth
Baldwin delivered a massive 29% surge in Q1 revenue to $532.2 million, entirely fueled by the January closing of the CAC Group partnership. However, the cost of this growth is staggering. Beneath the optical top-line acceleration, core profitability is decelerating. Adjusted EPS actually fell 3% YoY to $0.63 as a 40% jump in share count and a 31% spike in interest expense erased all $137.2 million of Adjusted EBITDA. Furthermore, reported organic growth collapsed to just 2%. While management points to a 'normalized' 9% organic growth figure, the massive gap suggests underlying friction in the legacy business. The integration is moving fast, but investors are paying a steep price in near-term dilution and negative cash flow.
Full article with charts - link in bio
🐂 𝐁𝐮𝐥𝐥 𝐂𝐚𝐬𝐞
• 𝐌&𝐀 𝐄𝐱𝐞𝐜𝐮𝐭𝐢𝐨𝐧 𝐚𝐧𝐝 𝐒𝐲𝐧𝐞𝐫𝐠𝐲 𝐂𝐚𝐩𝐭𝐮𝐫𝐞 — The CAC Group integration is materially ahead of schedule. Management claims 80% of targeted 3-year expense synergies are already actioned, with revenue cross-sell wins materializing faster than anticipated.
• 𝐍𝐨𝐫𝐦𝐚𝐥𝐢𝐳𝐞𝐝 𝐆𝐫𝐨𝐰𝐭𝐡 𝐓𝐫𝐚𝐣𝐞𝐜𝐭𝐨𝐫𝐲 — Management states that 'normalized' organic growth, inclusive of the new January partnerships, is running at 9%. They are guiding to exit 2026 at a double-digit organic growth run rate.
🐻 𝐁𝐞𝐚𝐫 𝐂𝐚𝐬𝐞
• 𝐄𝐚𝐫𝐧𝐢𝐧𝐠𝐬 𝐃𝐢𝐥𝐮𝐭𝐢𝐨𝐧 𝐢𝐬 𝐒𝐞𝐯𝐞𝐫𝐞 — Despite a 21% jump in Adjusted EBITDA, Adjusted EPS dropped 3%. The share count skyrocketed from 69.3M to 96.8M, proving the CAC deal was highly dilutive in the near term.
• 𝐅𝐫𝐞𝐞 𝐂𝐚𝐬𝐡 𝐅𝐥𝐨𝐰 𝐄𝐯𝐚𝐩𝐨𝐫𝐚𝐭𝐞𝐬 — Adjusted free cash flow reversed from positive $25.8M in 25Q1 to negative $0.2M this quarter, heavily pressuring the company's ability to organically deleverage or execute its previously touted $250M share buyback.
⚖️ 𝐕𝐞𝐫𝐝𝐢𝐜𝐭: ⚪
Neutral. The CAC Group deal successfully transformed Baldwin into a larger platform, but the aggressive debt and equity issuance means the business must execute flawlessly. Shrinking EPS and evaporating cash flow limit their margin of error.
𝐊𝐞𝐲 𝐓𝐡𝐞𝐦𝐞𝐬
🟢 𝐂𝐀𝐂 𝐆𝐫𝐨𝐮𝐩 𝐈𝐧𝐭𝐞𝐠𝐫𝐚𝐭𝐢𝐨𝐧 𝐘𝐢𝐞𝐥𝐝𝐢𝐧𝐠 𝐄𝐚𝐫𝐥𝐲 𝐑𝐞𝐬𝐮𝐥𝐭𝐬 [NEW]
The massive 29% revenue jump was heavily concentrated in the January partnerships, led by CAC Group. Management confirmed that integration is meaningfully ahead of plan with 80% of expense synergies actioned. This is a critical driver for reversing the margin compression seen this quarter.
🔴 𝐑𝐞𝐩𝐨𝐫𝐭𝐞𝐝 𝐎𝐫𝐠𝐚𝐧𝐢𝐜 𝐆𝐫𝐨𝐰𝐭𝐡 𝐂𝐨𝐥𝐥𝐚𝐩𝐬𝐞𝐬 [NEW]
Management claims 'accelerating earnings power,' yet the reported data contradicts this: official organic growth decelerated sharply to just 2% from 10% a year ago. Even though management provides a 'normalized' 9% figure, the massive 700 bps gap indicates that either legacy business lines are dragging significantly, or the methodology for excluding divestitures and first-12-month M&A revenue is masking underlying churn.
🔴 𝐌&𝐀 𝐃𝐢𝐥𝐮𝐭𝐢𝐨𝐧 𝐎𝐮𝐭𝐩𝐚𝐜𝐞𝐬 𝐄𝐁𝐈𝐓𝐃𝐀 𝐆𝐫𝐨𝐰𝐭𝐡 [NEW]
Decelerating/Reversing. Baldwin delivered an impressive 21% growth in Adjusted EBITDA ($137.2M). However, this failed to reach the bottom line. Weighted average diluted shares surged 40% (to 96.8M) and interest expense climbed 31% to $38.9M. This capital structure burden caused Adjusted EPS to shrink 3% YoY, completely neutralizing the operational gains of the acquisition.
🟢 𝐀𝐈 & 𝐓𝐡𝐞 $𝟑𝐁/𝟑𝟎 𝐂𝐚𝐭𝐚𝐥𝐲𝐬𝐭 𝐏𝐫𝐨𝐠𝐫𝐚𝐦
Management continues to advance its '$3B/30 Catalyst' transformation program. In response to macro concerns regarding AI disintermediation, Baldwin is explicitly infusing artificial intelligence and business process optimization into its workforce to elevate the platform. Transformation costs associated with this program hit $3.0M in the quarter (up from $0.5M a year ago), representing near-term pain for long-term margin defense.
🔴 𝐅𝐫𝐞𝐞 𝐂𝐚𝐬𝐡 𝐅𝐥𝐨𝐰 𝐓𝐮𝐫𝐧𝐬 𝐍𝐞𝐠𝐚𝐭𝐢𝐯𝐞 [NEW]
Reversing. Adjusted free cash flow dropped from positive $25.8 million in 25Q1 to negative $0.2 million in 26Q1. Combined with an operating cash flow drain of $6.1 million (driven by higher assumed premiums and receivables), working capital needs are starving the company of cash. This severely complicates the aggressive $250M share repurchase narrative established in the Q4 call.
𝐎𝐭𝐡𝐞𝐫 𝐊𝐏𝐈𝐬
𝐀𝐝𝐣𝐮𝐬𝐭𝐞𝐝 𝐄𝐁𝐈𝐓𝐃𝐀 𝐌𝐚𝐫𝐠𝐢𝐧: 25.8%
Decelerating. Down 170 basis points from 27.5% in the prior-year period. This indicates near-term negative operating leverage as the company absorbs the cost structure of the CAC Group before full revenue and back-office synergies can be realized.
𝐈𝐧𝐭𝐞𝐫𝐞𝐬𝐭 𝐄𝐱𝐩𝐞𝐧𝐬𝐞: $38.9 million
Accelerating. Up 30% from $30.0M a year ago. The expanded debt load to fund aggressive M&A is putting a hard ceiling on net income generation, turning a $101.3M operating loss into a pre-tax hole.
𝐂𝐨𝐧𝐭𝐢𝐧𝐠𝐞𝐧𝐭 𝐄𝐚𝐫𝐧𝐨𝐮𝐭 𝐋𝐢𝐚𝐛𝐢𝐥𝐢𝐭𝐢𝐞𝐬: $335.4 million
Exploding upward. Total earnout liabilities (current long-term) spiked from $23.3M at the end of 2025 to over $335.4M in 26Q1. This massive future cash obligation limits balance sheet flexibility over the coming years.
𝐆𝐮𝐢𝐝𝐚𝐧𝐜𝐞
𝐅𝐘𝟐𝟔 𝐎𝐫𝐠𝐚𝐧𝐢𝐜 𝐆𝐫𝐨𝐰𝐭𝐡 𝐄𝐱𝐢𝐭 𝐑𝐚𝐭𝐞: Double-digit run rate
Accelerating. Management maintained their qualitative guidance to exit 2026 on a double-digit organic growth run rate. Given the Q1 reported organic growth of just 2%, this implies a massive sequential ramp must occur over the next three quarters.
𝐅𝐘𝟐𝟔 𝐑𝐞𝐯𝐞𝐧𝐮𝐞 (𝐁𝐚𝐬𝐞𝐝 𝐨𝐧 𝐐𝟒 𝐂𝐚𝐥𝐥): $2.01 - $2.05 billion
Accelerating. While not explicitly updated in the Q1 print, the previously guided midpoint of $2.03B implies roughly 35% full-year growth over FY25's $1.5B. Q1's $532M print puts them well on track (accounting for roughly 26% of the annual target in Q1 alone).
𝐊𝐞𝐲 𝐐𝐮𝐞𝐬𝐭𝐢𝐨𝐧𝐬
𝐓𝐡𝐞 𝐎𝐫𝐠𝐚𝐧𝐢𝐜 𝐆𝐫𝐨𝐰𝐭𝐡 𝐆𝐚𝐩
There is a massive 700 basis point spread between your reported 2% organic growth and your 9% 'normalized' figure. Specifically, which legacy segments are dragging down the reported metric, and why?
𝐒𝐡𝐚𝐫𝐞 𝐑𝐞𝐩𝐮𝐫𝐜𝐡𝐚𝐬𝐞 𝐕𝐢𝐚𝐛𝐢𝐥𝐢𝐭𝐲
In the Q4 call, management stated 'at 8x EBITDA, there is not a better use of capital than buying our own shares.' With Q1 adjusted free cash flow turning negative, what is the realistic timeline and funding mechanism for executing the $250M repurchase authorization?
𝐌𝐚𝐫𝐠𝐢𝐧 𝐄𝐱𝐩𝐚𝐧𝐬𝐢𝐨𝐧 𝐓𝐢𝐦𝐞𝐥𝐢𝐧𝐞
Adjusted EBITDA margins compressed by 170 bps YoY to 25.8%. If 80% of CAC expense synergies are already actioned, when will we see margins inflect positively toward your 30% long-term target?
𝐄𝐚𝐫𝐧𝐨𝐮𝐭 𝐎𝐛𝐥𝐢𝐠𝐚𝐭𝐢𝐨𝐧𝐬
Contingent earnout liabilities surged to over $335M this quarter. Can you outline the cash outflow schedule for these obligations over the next 12-24 months and how it impacts your deleveraging targets?

1
2
449
May 5
looks decent $ADUS @taobanker

BREAKING: $ADUS reports strong Q1 2026 results with 7.7% revenue growth to $363.6M and $25.1M net income.
- Adjusted EBITDA up 9.7% YoY to $44.5M
- Operating cash flow of $52.4M
- Expanded in Indiana with new acquisitions
- Personal Care services lead at 77.3% of revenue
- 263 locations across 24 states serving 62,750 patients
1
1
1,078
May 2
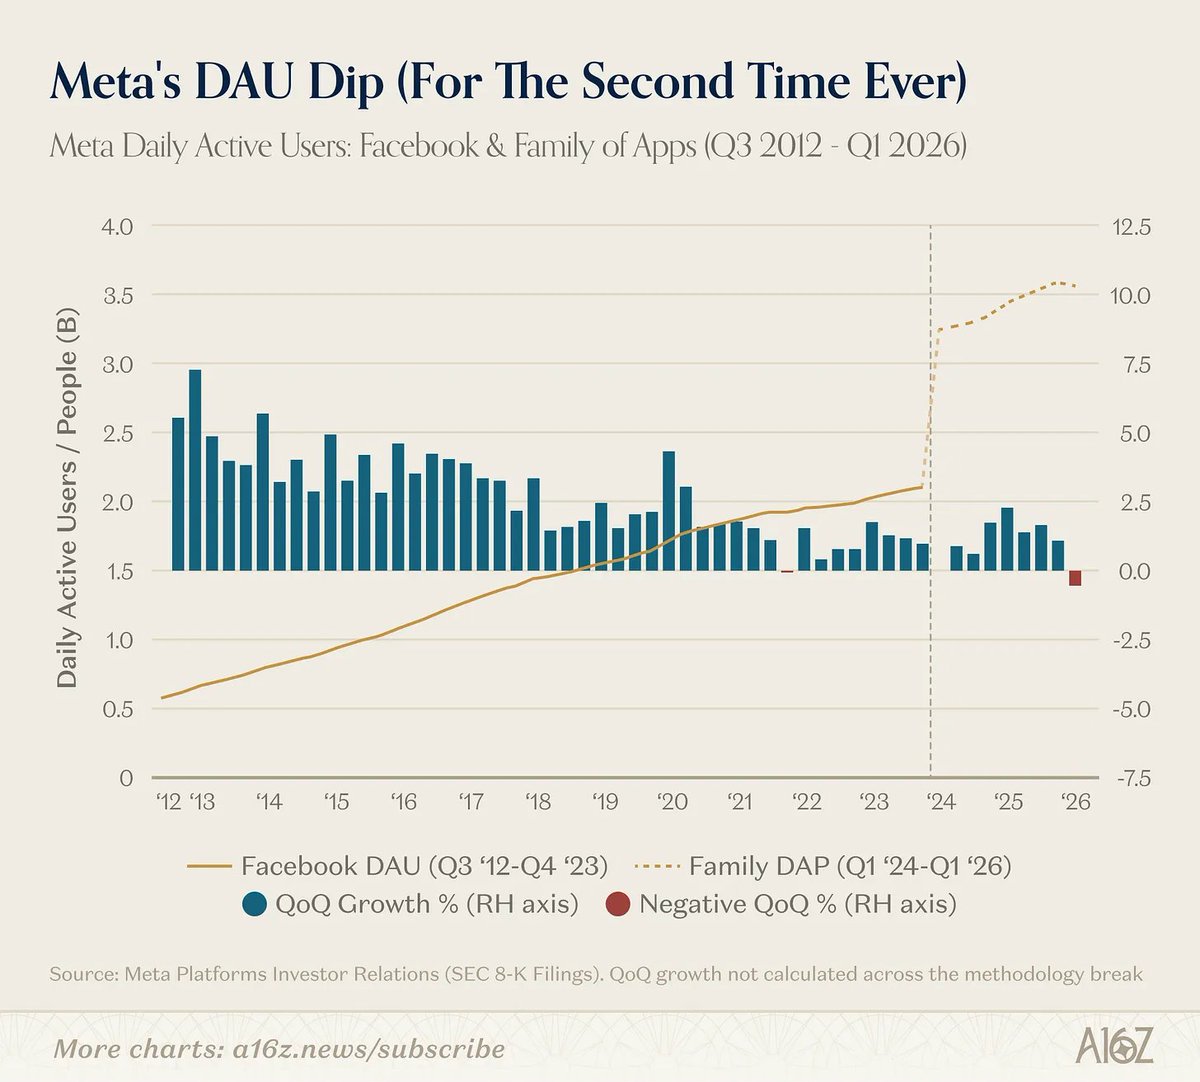
Reject $meta embrace tradition

Meta's DAUs just dipped for the first time since 2021
More charts: a16z.news/p/charts-of-the-we…
135
Saam retweeted

Free cash flow race to the bottom.

115
541
2,435
407,821
Saam retweeted
Apr 17
“Bull markets are born on pessimism, grow on skepticism, mature on optimism, and die on euphoria.” – Sir John Templeton
1
1
234
Apr 28
344