
Meteorology Climate 🇺🇸 | Look Up 🚀 | Florida State PhD | Go Blue Michigan | Cat 6 🐈 | 🌎 A.I. Weather Maps @weathertrader
Joined September 2008
- Tweets 27,907
- Following 5,624
- Followers 143,891
- Likes 67,987
14,098 Photos and videos


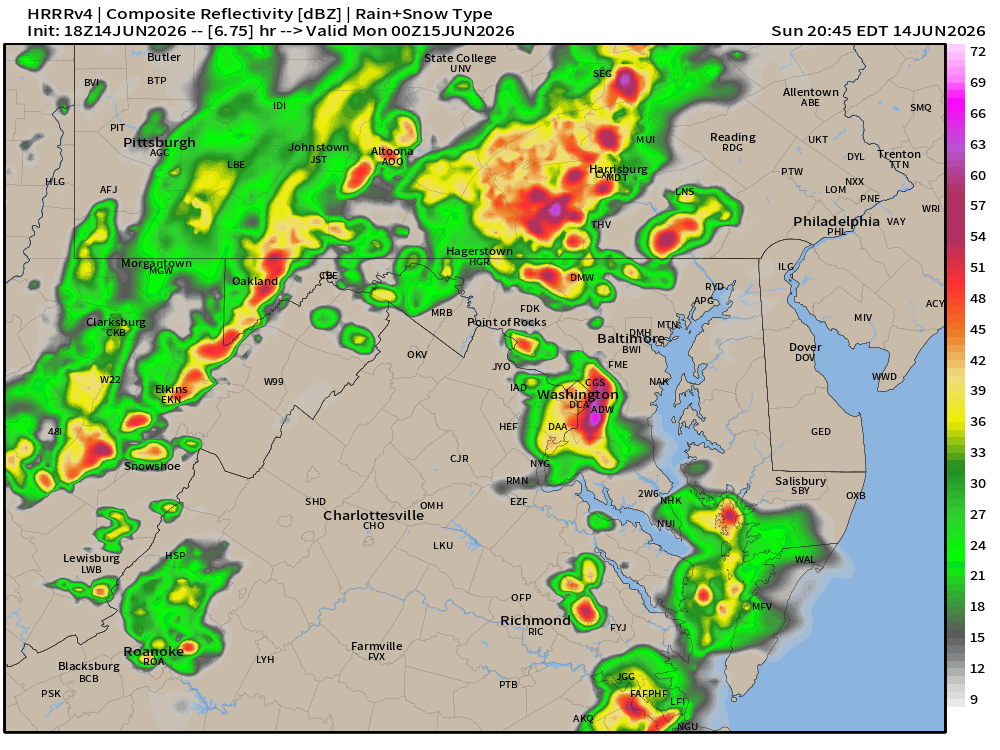


Like a force field was erected😉the showers and storms diverted through northern Washington D.C. to avoid the White House -- the delay was the correct move with lightning in the area.
Anyways, this wasn't a "chaotic weather setup" as some apparently hoped/hyped.
12
11
70
6,950
Ryan Maue retweeted

11h
2026 WxProbe NATL Hurricane Season Forecast: June Update
This update incorporates the latest atmospheric and oceanic conditions as of mid-June 2026, with a refined focus on sea surface temperature (SST) patterns, historical analog performance, and expected evolution into the peak August–September–October (ASO) period. The forecast maintains a well-below-normal outlook, consistent with a strengthening El Niño, while also accounting for the localized benefits of current western Atlantic warmth.
Current Conditions (as of early/mid-June 2026):
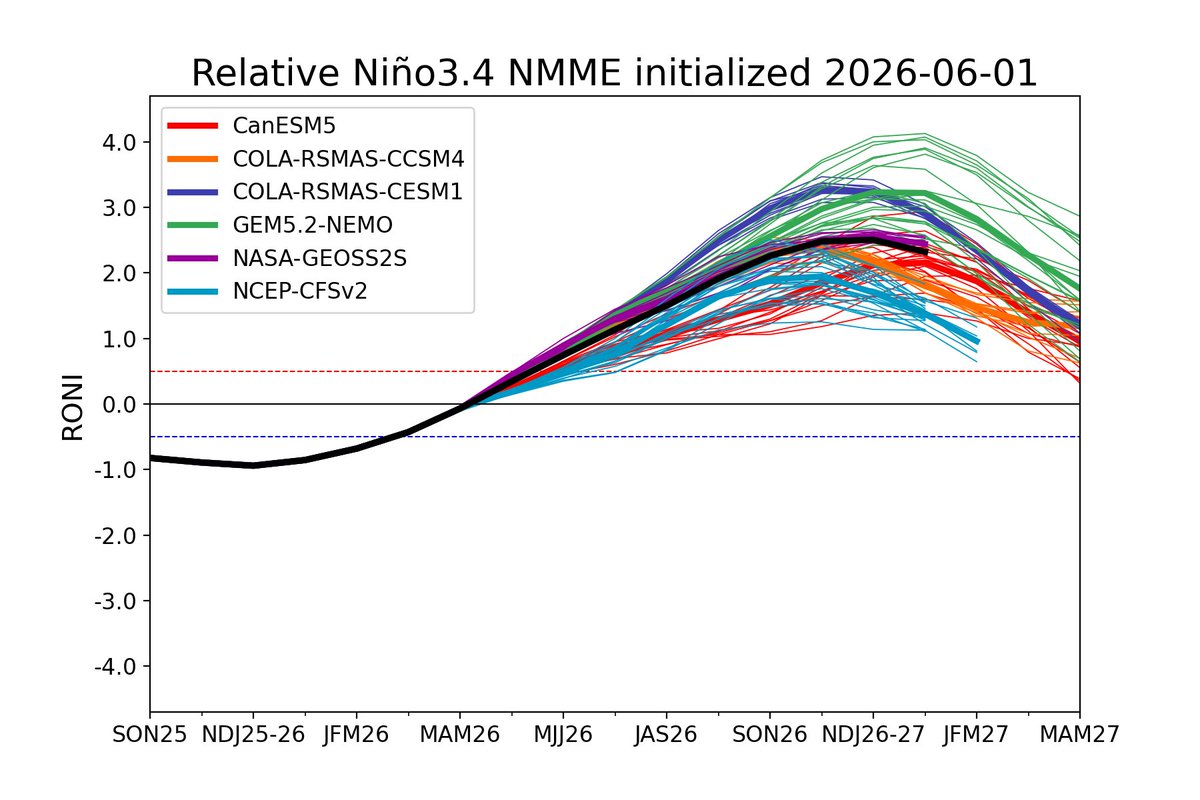
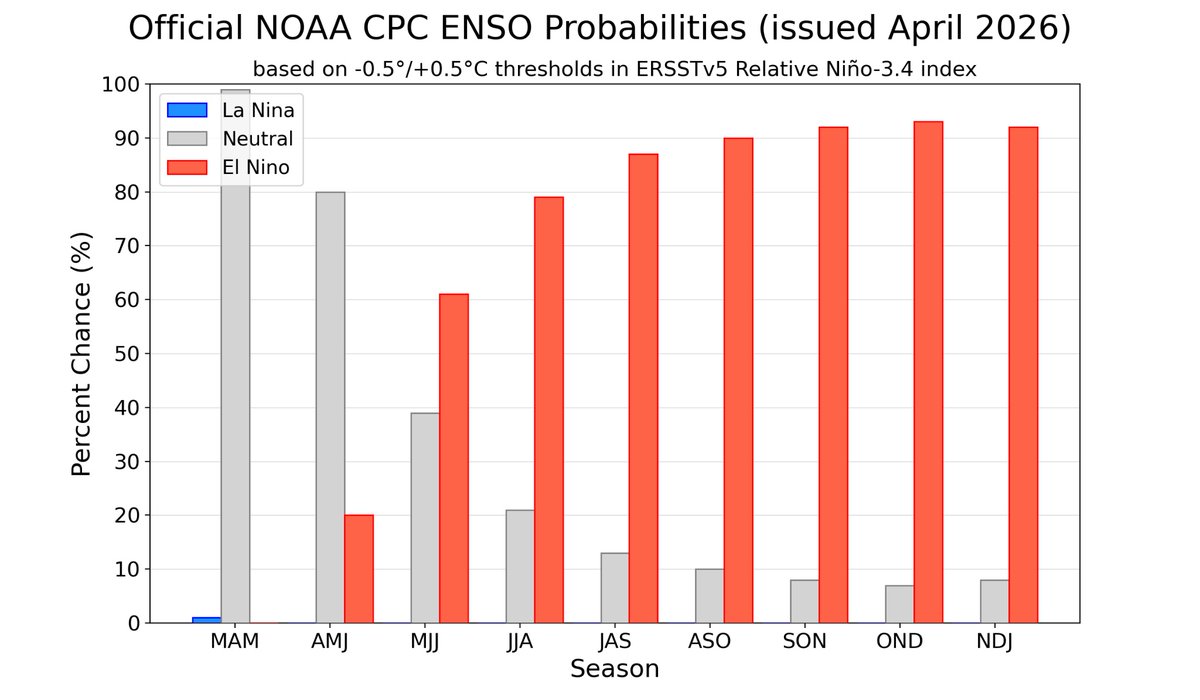
ENSO: El Niño conditions are now present and expected to strengthen through the Northern Hemisphere winter of 2026–27. Reliable models favor a moderate-to-strong (likely very strong) event by late summer/fall.
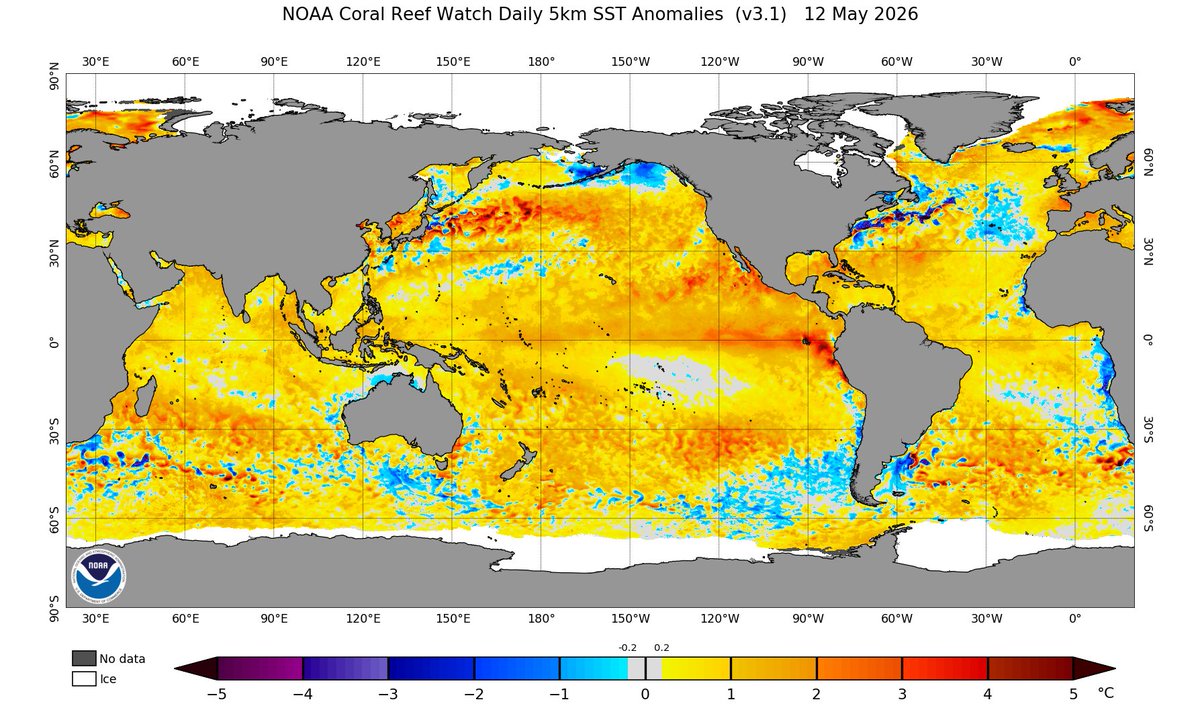
Atlantic SST Pattern: The overall pattern remains “polarized.” The Gulf of Mexico and western subtropics continue to run near-record warm for this time of year. In contrast, the central and eastern Main Development Region (MDR) has cooled somewhat since mid-May and is now running near average to even slightly below normal. Overall, the MDR is near average.
Mixed Signals: This configuration produces mixed signals for tropical cyclone (TC) activity. The western warmth offers localized fuel for homegrown systems and potential rapid intensification, while the lack of broad central/eastern MDR support (combined with expected El Niño-driven wind shear) limits overall development. The warmer eastern subtropics could also support an additional system or two.
Since the previous update, the central and eastern MDR has cooled from modestly above average (in May) due to stronger trade winds increasing evaporation and mixing — a trend expected to continue as El Niño matures.
Historical Analog Evaluation:
The four primary core analogs used in this forecast remain 2015, 1997, 2002, and 2009.
These were selected because they represent moderate (2002) or strong non-Modoki El Niño events that occurred during the current warm AMO era (since 1995), providing the most relevant comparison to the expected 2026 atmospheric and oceanic setup.
That said, 2015 stands out as the single best match among the core analogs. It featured a strong El Niño with modest overall MDR warmth that had a noticeable western bias — conditions that most closely resemble the current polarized pattern (strong warmth focused in the Gulf and western subtropics, with more neutral conditions in the central and eastern MDR). While 2015 ultimately produced 11 named storms, 4 hurricanes, and 2 majors, a large portion of its ACE came from one exceptional storm (Joaquin). This makes it a realistic benchmark for what a strong El Niño year can produce when some western warmth is present.
The other three core analogs (1997, 2002, and 2009) were included to provide a balanced view across different strengths and timings of El Niño events within the modern warm AMO period. 1997 represents a very strong El Niño with noticeably cooler Atlantic conditions and strong suppression. 2002 and 2009 were more moderate El Niños that still produced significantly below-normal seasons.
Together, the four core analogs give a more robust statistical foundation than relying on any single year.
Average activity metrics of the four core analogs (2015, 1997, 2002, and 2009):
* Named Storms: 10
* Hurricanes: 3.5
* Major Hurricanes: 1.8
* ACE: 56
These averages, combined with the current polarized SST pattern (which offers modestly more western/Gulf support than most of these years), support the forecast ranges below.
Expanded historical context:
Several other strong El Niño seasons (1957, 1965, 1972, 1982, and 1987) demonstrate the even wider range of possible outcomes. 1957 and 1965 show that strong El Niños in a positive AMO state can still produce intense major hurricanes and significant U.S. landfall threats (e.g., Audrey in 1957 and Betsy in 1965). Both delivered TC activity significantly above the typical strong El Niño influenced mean with a realistic adjusted ACE value (accounting for missed TC activity in the pre-satellite era) at or slightly above 100 units — even without the uniform record basin-wide warmth of 2023. In contrast, 1972, 1982, and 1987 represent strongly suppressed seasons, which occurred during a negative AMO phase.
However, none of these years are being added to — or replacing — the four primary analogs. They featured different SST configurations (often more uniform) and lower absolute sea surface temperatures than today’s modern baseline. Because of these differences, the aforementioned four core analogs remain by far the best representation of likely 2026 activity.
Expected Evolution into ASO:
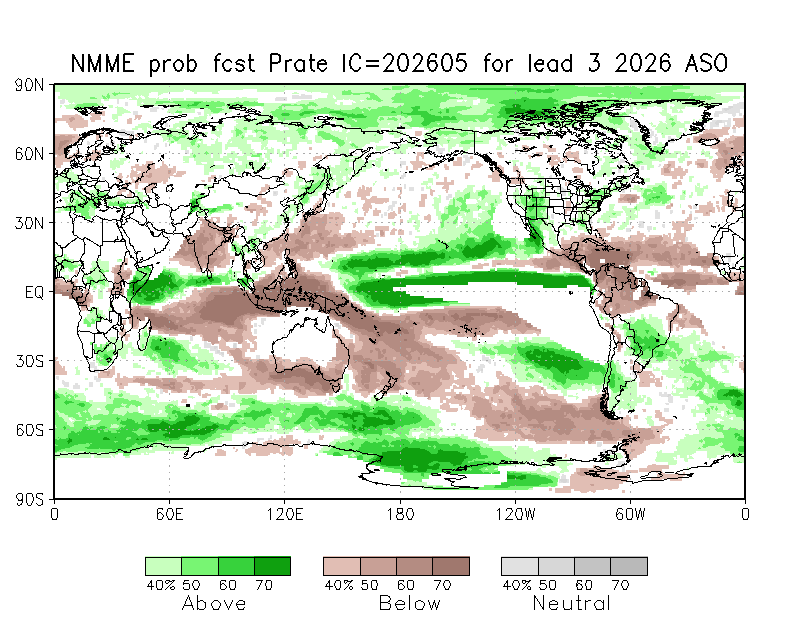
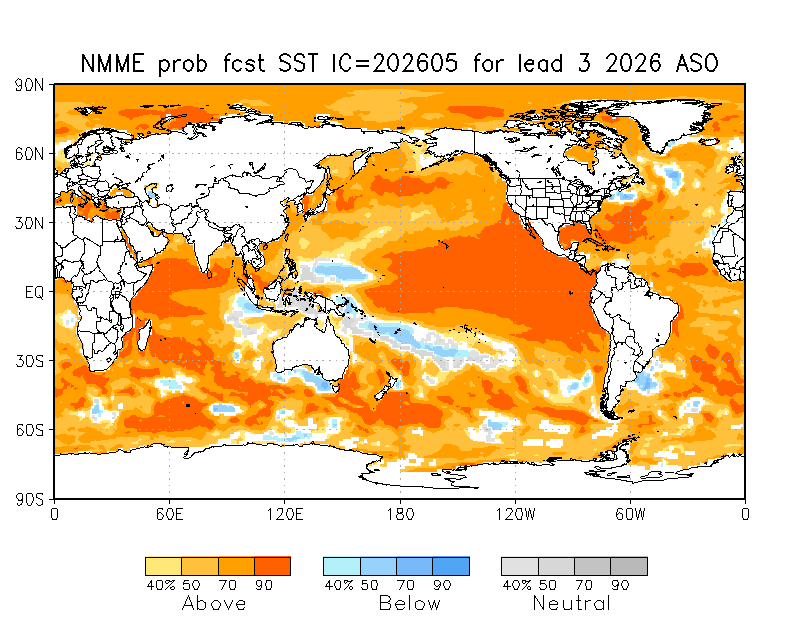
Model guidance (NMME, CFSv2, and statistical models) suggests the current polarized SST pattern is likely to persist or intensify into ASO:
* Western Atlantic/Gulf warmth should remain above average.
* Central and eastern MDR is expected to stay near average to slightly below normal as El Niño enhances subsidence and trade winds.
* Overall MDR SSTs are projected to be slightly above average to near average, but the east-west split will likely remain.
In short, this specific pattern should be modestly more favorable overall than 2015 due to the stronger concentrated warmth in the western basin and Gulf, which increases potential for homegrown systems and rapid intensification near land. However, a strengthening strong El Niño (which I’m expecting to reach an ONI of 2.0 for ASO) will continue to impose significant/destructive vertical wind shear, keeping the season well below normal.
Seasonal Activity Projections:
Named Storms: 9–13 (11)
Hurricanes: 3–5 (4)
Major Hurricanes: 1–3 (2)
ACE: 40–90 (65)
Note: Single figures in parentheses represent the official seasonal totals forecast by WxProbe. The surrounding ranges represent standard WxProbe verification windows.
Key Uncertainties:
* Exact strength and timing of El Niño intensification (stronger events tend to produce more suppression).
* How much the western warmth can offset shear (the main upside factor this year).
* Any late-season shifts in the MDR as the El Niño matures.
* Influence of intraseasonal variability (such as the Madden-Julian Oscillation and other sub-seasonal signals). These factors can dramatically enhance or suppress activity when they align with the climatological peak of the season, as seen in several recent years (including 2025).
Next Update:
The forecast will be updated again in mid-July once more data on El Niño evolution and Atlantic conditions become available. That said, these particular projections represent the definitive seasonal forecast used for post-season verification purposes.
#Hurricane


May 14

2026 WxProbe NATL Hurricane Season Forecast: May Update
This update presents a significant downward revision from my April "First Look" outlook. The adjustments better reflect historical analog constraints, intensifying El Niño trends, and projected sea surface temperature (SST) configurations during the August–October (ASO) peak.
Seasonal Activity Projections:
Named Storms: 9–13 (11)
Hurricanes: 3–5 (4)
Major Hurricanes: 1–3 (2)
ACE: 40–90 (65)
Note: Single figures in parentheses represent the official seasonal totals forecast by WxProbe. The surrounding ranges represent standard WxProbe verification windows (allowable margins of error: /- 2 named storms, /- 1 hurricane, /- 1 major hurricane, and /- 25 ACE).
Historical Analog Evaluation:
The baseline composite includes six key analogs optimized for the unique 2026 atmospheric and thermodynamic setup: 2015, 1997, 2009, 2002, 2018, and 2023.
* Six-Year Composite Average: 12.5 Named Storms/4.8 Hurricanes/2.0 Major Hurricanes/82.5 ACE.
* Composite Oceanic Niño Index (ONI): 1.5°C during the ASO peak.
* Forecast Adjustment Justification: Present expectations favor a significantly stronger, more mature El Niño event than the 1.5°C analog mean, resembling a “super” El Niño scenario. Consequently, my final forecast targets lean lower than the raw six-year composite averages…though modern (1995-2025) baseline warmth prevents a total collapse.
Primary Seasonal Drivers:
1. Dominant Moderate-to-Strong El Niño Signal:
The Climate Prediction Center (CPC) May 2026 ENSO Diagnostic Discussion notes current neutral conditions, but assigns a 61% probability of El Niño development during the May–July window. Relevant models continue to project a robust, mature event by peak season. The expected atmospheric responses via the altered Walker Circulation include the following:
* Walker Circulation Disruption: Deep convective thunderstorms venting over the eastern Pacific force a massive eastward shift in the upper-level loop. This drives large-scale subsidence (sinking dry air) directly over northern South America and the Caribbean, capping the atmosphere and suppressing upward thunderstorm convection.
* Increased Wind Shear: Accelerated high-altitude westerly winds clash with low-level easterly trade winds. This severe vertical wind shear tilts and physically rips apart developing tropical depressions before they can organize.
* Altered Steering: A weakened, fractured Bermuda High limits favorable long-track westward migration, deflecting weak systems northward into hostile mid-latitude environments.
2. Non-Record, Polarized Atlantic SST Profile:
Atmospheric suppression should *not* face the historic thermal resistance seen in 2023. Specifically, current basin conditions exhibit a highly stark, split configuration:
* Gulf of Mexico Marine Heatwave: Sea surface temperatures and deep-ocean heat content are at near-record heights, tracking 1.0°C above the climatological 30-year average. This localized heat engine poses an increased risk for rapid intensification for any storm entering this part of the basin.
* Central and Eastern MDR: The tropical Atlantic corridor has cooled dramatically from the 2023–2024 marine heatwaves, tracking near or even slightly below normal. This introduces a minor Atlantic Niña-like signature.
* Thermodynamic Insufficiency: Without widespread, basin-wide record warmth, the tropical Atlantic lacks the thermal insulation/depth needed to counteract El Niño's hostile wind fields.
3. Verification Against Pure El Niño Analogs:
To properly isolate the true atmospheric mechanics, we need to classify the historical analogs into three distinct structural eras based on their spatial SST profiles:
Era 1: Total Suppression Era (1997 & 2015) = Widespread Cold Basin
Era 2: Standard Suppression Era (2002 & 2009) = Neutral/Quiet MDR Baseline
Era 3: Thermal Discrepancy Era (2018 & 2023) = Warm Basins/Variable El Niños
* The Four Primary Core Analogs (1997, 2002, 2009, 2015): These seasons act as our primary atmospheric baseline. By isolating just these four core years, we get an average of 10.0 Named Storms, 3.5 Hurricanes, and 1.8 major hurricanes, respectively. They represent the standard-to-strong Pacific (El Nino) suppression acting on a non-hyperactive Atlantic basin.
* The Relevancy of the Secondary Analogs (2018 & 2023): While not the main drivers, 2018 and 2023 are critical additions to the broad composite. The 2018 season featured a weak/borderline El Niño, but serves as a vital thermodynamic match for today’s extreme warm Gulf of Mexico. 2023 represents a strong Pacific El Niño, but remains a record-shattering warm-basin outlier…whose extreme MDR heat significantly neutralized the Pacific shear.
* Analog Exclusion (2006): 2006 is entirely excluded from the composite of all non-Modoki-El Niño events during the most recent active/warm AMO phase. Because 2006 featured a weak El Niño that developed unusually late in the summer, its atmospheric footprint fails to capture the rapid, early-season onset and strong-to-super intensity expected from this forthcoming 2026 Pacific event.
Climatological Implications for Late-Season Activity:
The suppressing effects of a strong El Niño characteristically maximize during post-peak and late-season windows (late September through November) as the Pacific event reaches maturity. While the North Atlantic basin produced well-above-normal late-season activity over the past few climate cycles, 2026 will likely display the opposite trend.
For historical context, the selected pure El Niño analogs generated a 52.8% reduction in late-season activity compared to the active-era (1995–2025) average. Consequently, a highly abrupt, suppressed finish to the 2026 season is expected after September.
Rationale for the specific Point Targets:
WxProbe has set the official point targets at 11 Named Storms, 4 Hurricanes, 2 Major Hurricanes, and 65 ACE to best balance large-scale global atmospheric suppression against localized modern basin warmth.
* Named Storm Range 9–13 (Target: 11): This range was chosen over the lower 8–12 bracket under strong consideration. While El Niño should effectively shut down the eastern MDR to long-track African easterly waves, extreme marine heatwaves lingering in the GOMEX and subtropical Atlantic will act as a secondary breeding ground. As a result, stalling cold fronts and non-tropical lows over these ultra-warm waters can easily spin up short-lived, homegrown systems. This localized environment will likely pad the final named storm count to 11.
* Hurricane Range 3–5 (Target: 4): This particular window is reduced from the 4–6 range projected in April to maximize WxProbe verification metrics. Because a strong-to-super El Niño exerts a powerful cap on the atmosphere, hostile vertical wind shear will prevent many homegrown named storms from achieving full hurricane intensity. A point target of 4 hurricanes anchors tightly to the core four analog mean (3.5)…while accounting for the modern climate baseline.
* Major Hurricane Range 1–3 (Target: 2): This window is selected over a lower 0–2 range to account for the high-end intensity risks in a suppressed year. While the overall environment is hostile, the enhanced heat content in the Gulf of Mexico provides a volatile energy source. This leaves statistical room for 1 or 2 systems to undergo rapid intensification into major hurricanes in the western portion of the basin or GOMEX (e.g., Isidore/Lili 2002), and another potentially in the MDR…matching the core analog mean (1.75) while respecting modern thermal environments.
* ACE Range 40–90 (Target: 65): This range centers precisely on a target of 65 to reflect a heavily truncated season. Hostile wind shear, mid-level dry air, and a weakened Bermuda High will severely limit storm longevity and track lengths by negating long-track westward progression. This keeps seasonal energy output well below the active-era (1995-2025) norm. However, a target of 65 sits slightly above the aforementioned core four analog mean (56) to allow for high energy generation from any short-track, intense systems over the ultra-warm subtropical waters.
Next Update:
I will issue the definitive seasonal forecast around the middle of June. In the meantime, it’ll be most interesting to see if the MDR can warm above the most recent climatological levels and how the overall SST profile may change over the succeeding 30 days.
2
5
26
9,008
Ryan Maue retweeted

Euro Model continues to show a favorable setup for potentially significant severe weather in the Midwest on Wednesday.
At 500mb, an intensifying and unusually strong jet streak for June (80-100 knots) will be overlapping with a warm and moist airmass.
Some uncertainties remain such as the evolution of trough ejection and storm mode, but all severe hazards (damaging winds, large hail, and tornadoes) appear likely.
1
11
58
7,527
8:30 PM ET
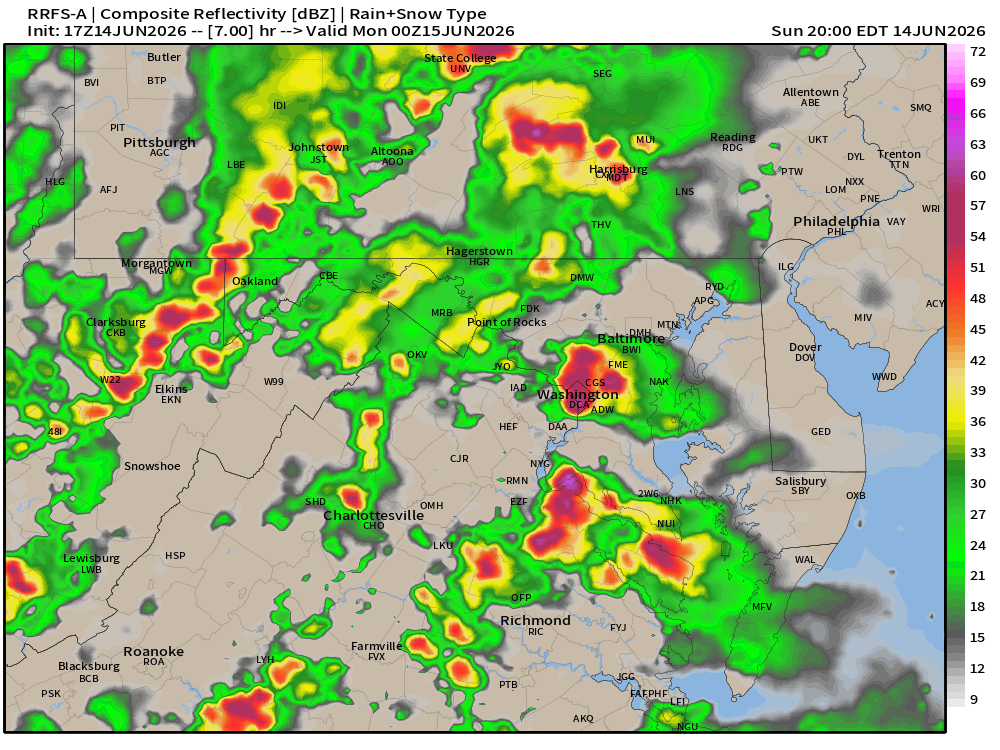
A tiny, rogue storm cell is making a bee-line for the White House. Currently not severe, but would have a brief heavy downpour.

7:45 PM ET: There's a line of storms 2-3 hours to the west of Washington D.C.
Current severe threat has passed to the South ✅
Now: 90°F humidity and swarms of bugs in the lights 🪲🦟
4
5
25
8,547
7:45 PM ET: There's a line of storms 2-3 hours to the west of Washington D.C.
Current severe threat has passed to the South ✅
Now: 90°F humidity and swarms of bugs in the lights 🪲🦟
1
6
33
13,990
Severe storms just to the south of Washington D.C.
Watching any outflow boundaries for new development but fingers crossed, the worst weather will miss the White House😇
2
3
40
5,842
The White House 🇺🇸 venue is 100% being watched by NWS private meteorologists contracted by UFC to maintain the safety of spectators, combatants, and most importantly, the President.
Take weather situation seriously --> potential for heavy, wind drive rain & thunderstorms 🌩
10
6
86
14,077
Weather Channel has maintained its top of the media trustworthiness because they strictly "stick to weather" and sell an amazing product sans politics. Their brand is gold standard, by far.
No one expects the same from CNN, ABC News, or the Washington Post.
6
2
53
7,811
Ryan Maue retweeted
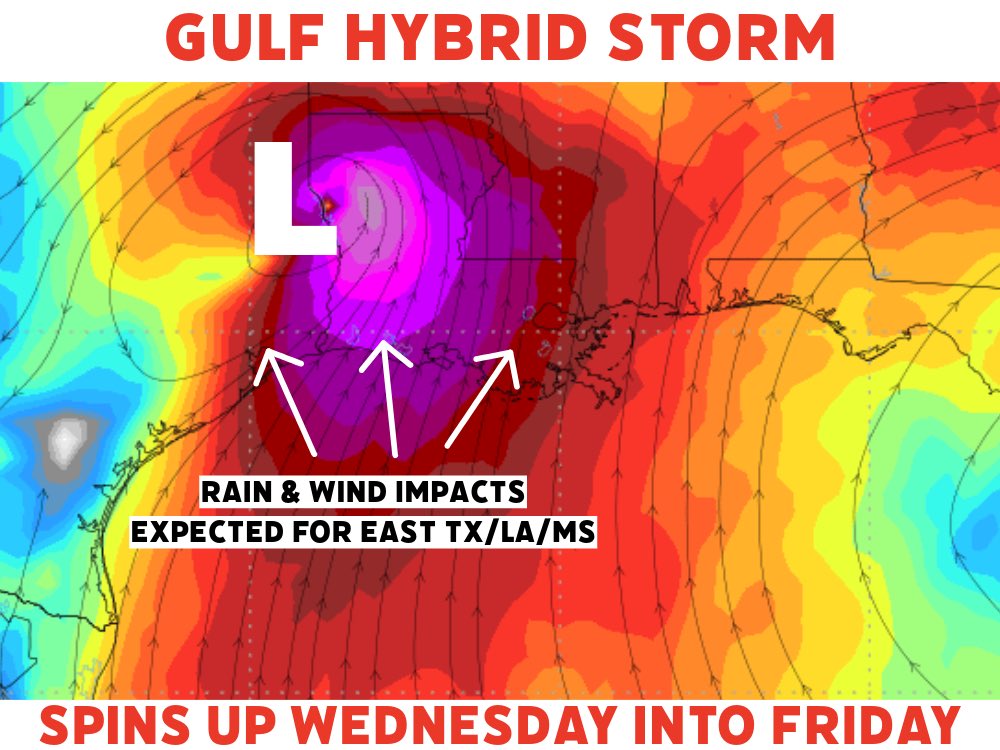
Multiple days of heavy rainfall will drive a flash flood threat along the western and central Gulf Coast.
The remnants of what used to be Tropical Storm Cristina in the East Pacific is being given a low 30% chance of development off the Texas Coast by midweek.
Regardless of formation chances, this system will interact with a front across the South, leading to rounds heavy rain. NOAA’s Blend Of Models shows a corridor of 3-6 inches of rain through next weekend, with isolated higher amounts. #TXwx #LAwx #MSwx
2
24
110
11,516
Except for one person at Weather Channel, the entire operation from top to bottom has always been left leaning, and it's now rearing its ugly head with unhinged political troll posting. Please leave that to the experts!
16
7
140
15,651
A bit hyperbolic in tone -- but this is a legitimate forecast -- at least based upon recent high-resolution model output.
Brief heavy thunderstorm possible between 8 PM and 9 PM ET for UFC Freedom 250 at the White House.

UFC Freedom 250 is facing a chaotic weather setup on the White House South Lawn, with a 60% chance of thunderstorms, heavy downpours, and wind gusts up to 34 mph threatening to delay the outdoor fights. On top of the storm risk, brutal D.C. humidity is driving a triple-digit heat index alongside massive swarms of mosquitos and gnats that fighters will have to battle inside the cage. While the venue’s massive 92-foot overhang will keep the octagon dry, a single lightning strike within eight miles will trigger an automatic 30-minute freeze on the entire event.

2
6
49
18,013
A tropical system will form along/near the coast of South Texas by Tuesday (30% chance) and then combine with a frontal boundary while heading through the Southeast. This hybrid structure --> TD/TS intensity while over land into next weekend.
--> boatloads of rain 🚣
2
16
76
8,624
Highly unusual storm system ... but taking enormous tropical moisture w/weak low pressure frontal boundary = plenty of convergence, upper-level energy to provide a "baroclinic" energy pathway even over land.
30% chance of TD 01L (then Arthur) but technically a name doesn't matter as the IMPACTS will be substantial regardless
1
5
19
4,579
Ryan Maue retweeted

Concern growing for an impactful rain system coming for East TX/LA/MS later this week. The wet pattern shift starts Monday but late week a spin up low may develop. Impacts could yield a concentrated area of significant rain and maybe even some wind. Watch the forecast! #lawx
8
25
150
11,454
Wet and wild week ahead across the Eastern 🇺🇸 with a deep layer tropical moisture plume flowing out of the Caribbean and Gulf.
An area of low pressure will develop -- and could become a TD/TS if remains off coast of Texas.
This storm may even intensify over land. Next 6-d
4
21
124
15,069
Ryan Maue retweeted

Jun 13
THE VIDEO: Union Pacific Big Boy 4014 passes over the Tunkhannock Viaduct.
A 1.2-million-pound steam legend crossing one of the largest concrete railroad viaducts ever built. Nicholson, Pennsylvania delivered an unforgettable scene today.
98
1,374
11,724
420,578

Jun 13
Argentina vs. Algeria in Kansas City at Arrowhead Stadium
Fears about climate change dominated the global news media for the World Cup here in the United States 🇺🇸
Forecast High: 82°F (28°C)
Perfect weather for⚽️
6
6
50
7,718
Jun 13
But wait! There's more.
Monday and Tuesday will be around 80°F with sunny skies and dry air a breeze
For late Spring in New York City, these days may be the nicest ever experienced by World Cup visitors and residents alike in their lifetimes.
Jun 13
This might be the one of the nicest late Spring days in the history of New York City🍎if you like a little heat
89°F high temperature (still sub-90°F)
dry air / low humidity / sunny skies
2
5
40
8,229
Jun 13
This might be the one of the nicest late Spring days in the history of New York City🍎if you like a little heat
89°F high temperature (still sub-90°F)
dry air / low humidity / sunny skies
3
5
49
12,952
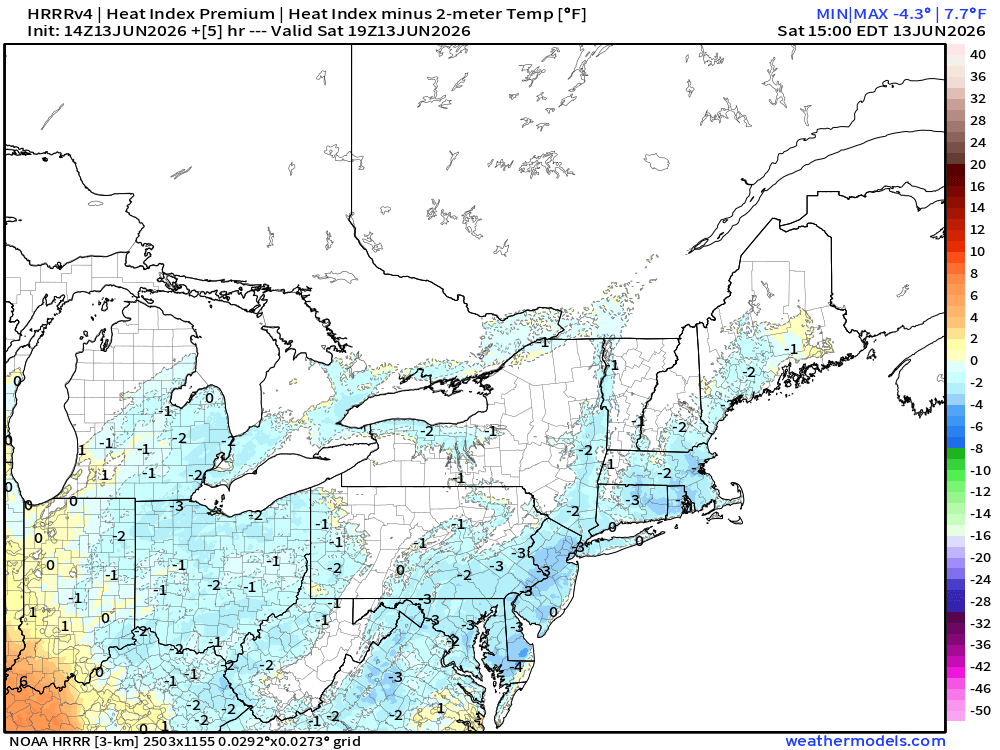
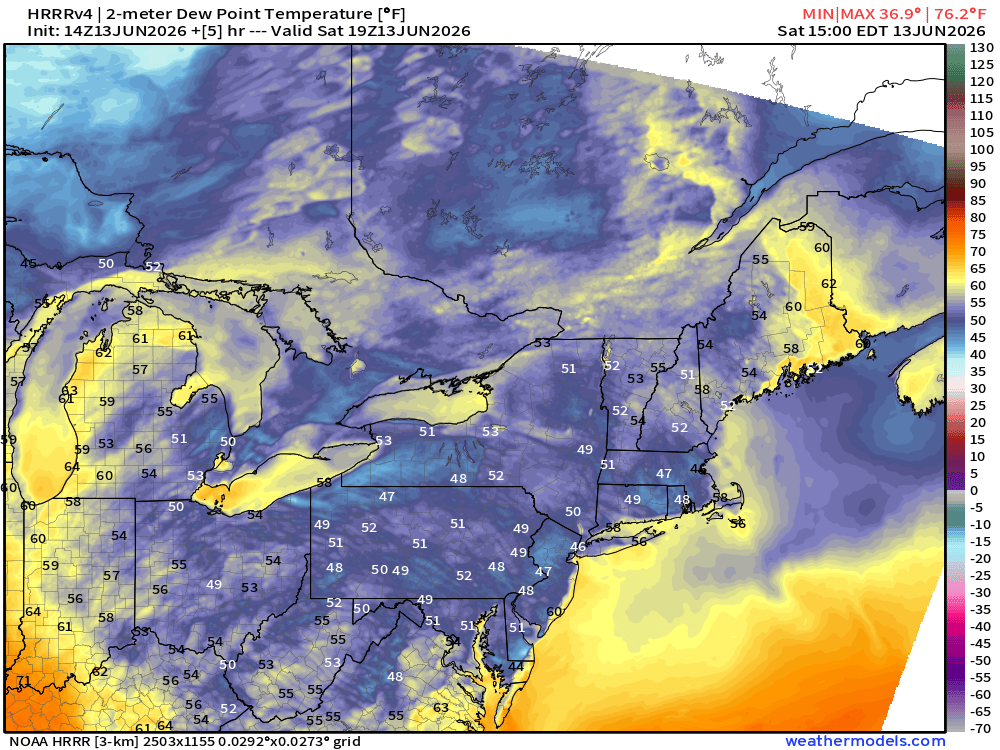
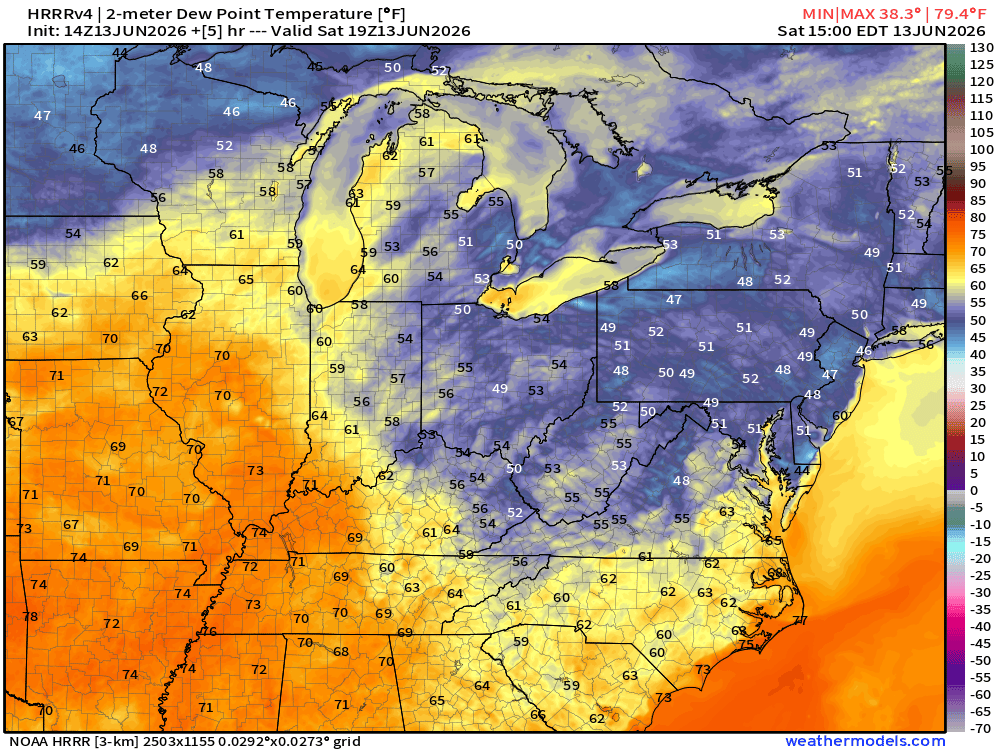
Jun 13
Dry --> low dew points across the Mid-Atlantic and Northeast behind the front
Not exactly a cold front, temperatures still in 80s and 90s, but the "heat index" is actually lower than actual temperature by a few degrees this afternoon!
3
5
32
6,890