
DataViz stuff
Joined May 2010
- Tweets 2,519
- Following 1,366
- Followers 1,431
- Likes 7,797
239 Photos and videos


Pinned Tweet

Mar 10
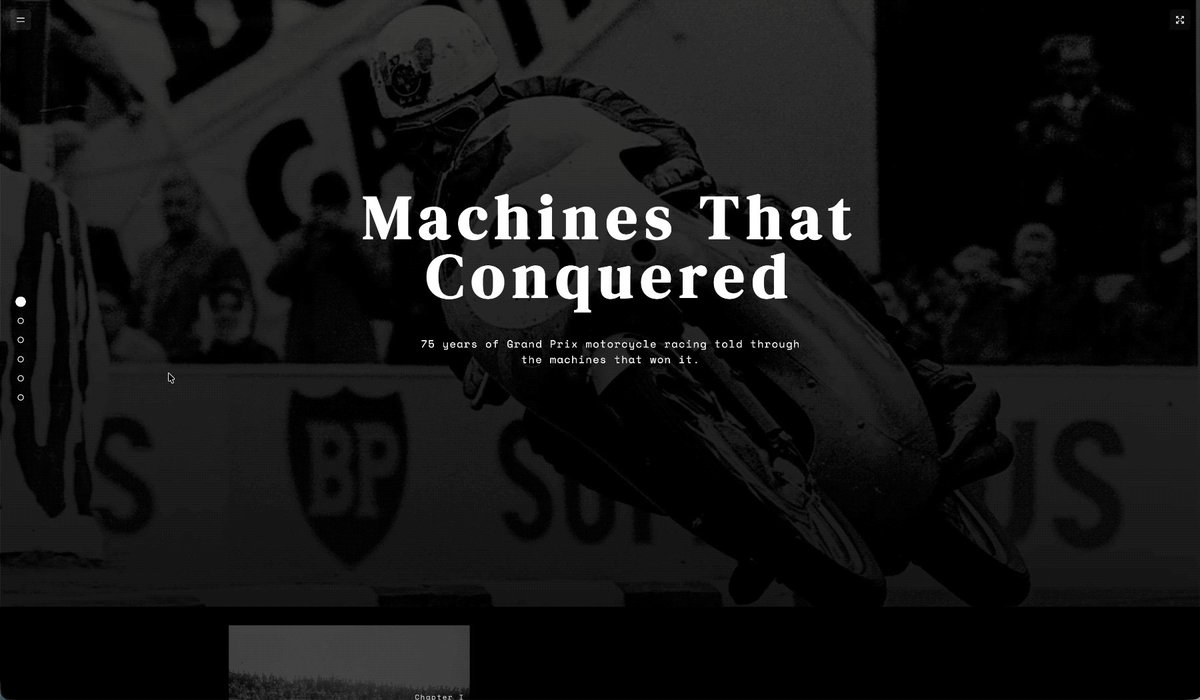
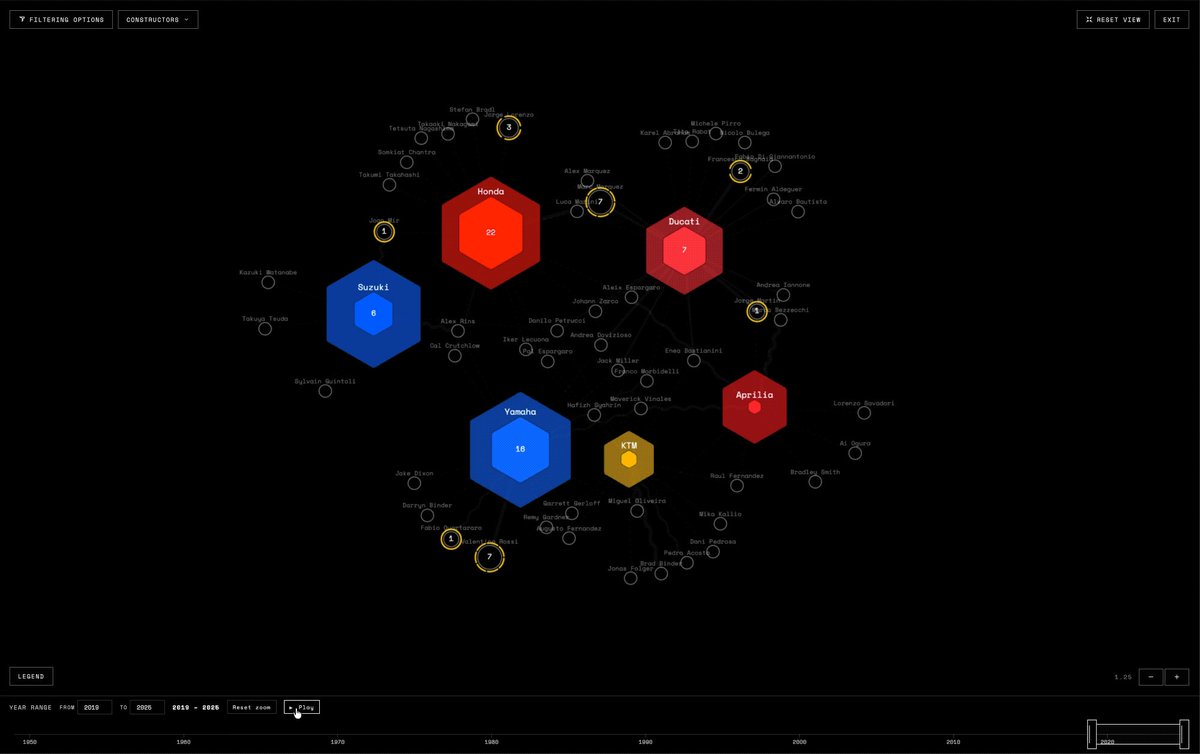
75 years of MotoGP constructor history — mapped as a living network. Every constructor. Every rider. Every era.
samodrole.com/projects/machi…
#dataviz #datavisualization #motogp #motorcycleracing #d3js #svelte #informationdesign #motorsport #interactivedesign #grandprix
1
1
310
Samo Drole retweeted

May 3
I've made a super-simple website, where you can check which cities lay on the same parallel (and also the mirrored parallel on other hemisphere).
You can expect the same sunlight hours (longer nights, shorter days, etc) and similar sun power there.
vicnaum.github.io/parallel-c…
127
523
5,893
1,133,822
Apr 18
1
48
Apr 18
Play with how it works, before you commit to code.
#designtools #design #ux
moioapp.com/the-missing-desi…
33
Samo Drole retweeted

Apr 6
font pairing is hard. it is one of those problems that sounds simple until you're 45 minutes deep into Google Fonts with 12 tabs open & still stuck with the classic 'inter'. I built typevibe to give you a head start.
tell it what you're building & it recommends unique font pairings along with 32 design templates that instantly show you how those fonts actually look. editorials. posters. menu cards. data dashboards. all updating live as you explore different pairings.
typevibe.vercel.app/
36
160
2,386
140,568
Samo Drole retweeted
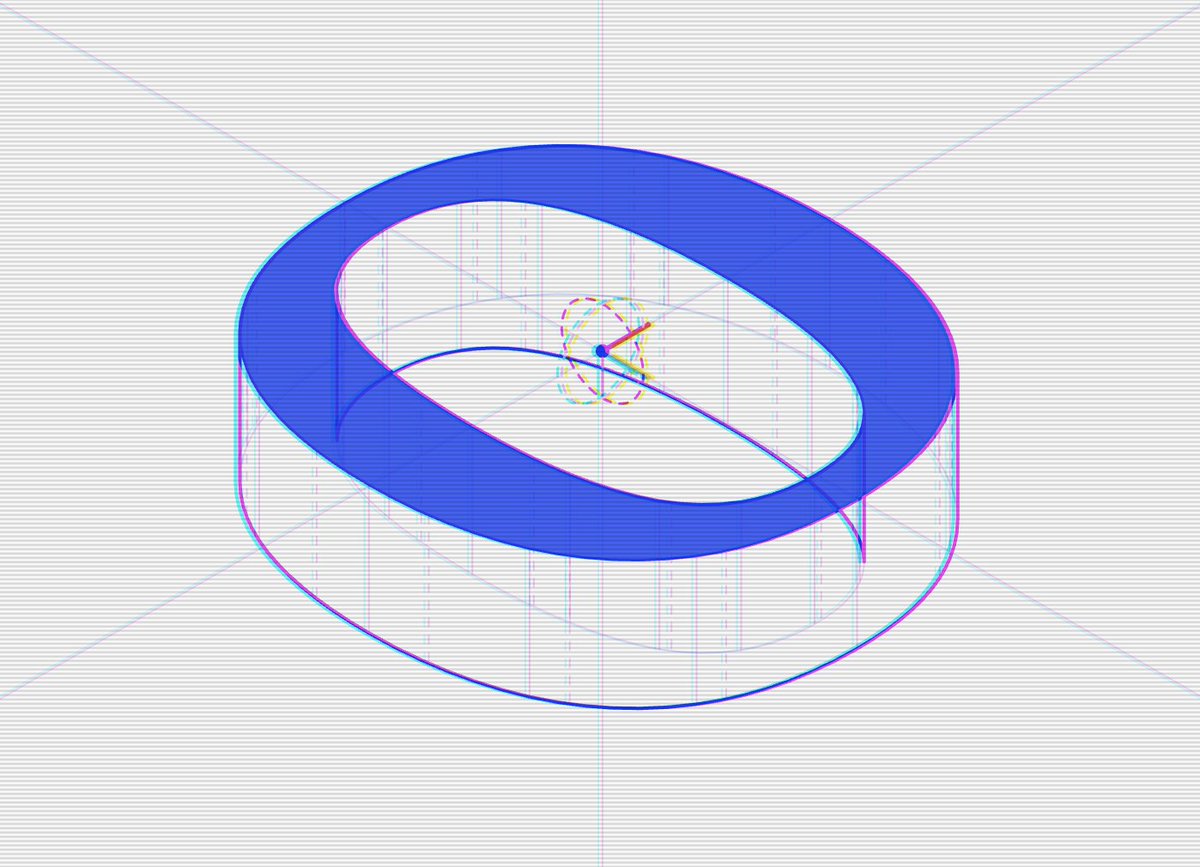
Just wanted wanted to see what a mega satellite constellation really looks like - and why SpaceX uses completely different orbital angles (53°, 70°, 97° polar, 43° etc.)
Switch shells on/off and finally helped to understand why each inclination exists- Data visualized using over 10,000 @Starlink satellites orbiting Earth with data from CelesTrak.
#Starlink #SpaceTech @threejs @reactthreefiber #DataVisualization #WebGL #CreativeCoding #SatelliteTracking
3
17
169
13,339
Samo Drole retweeted

Mar 27
Flowbite-Svelte v1.33.0 is out! We've shipped several bug fixes and new features to make your experience smoother. Check it out 👇
flowbite-svelte.com
6
19
744

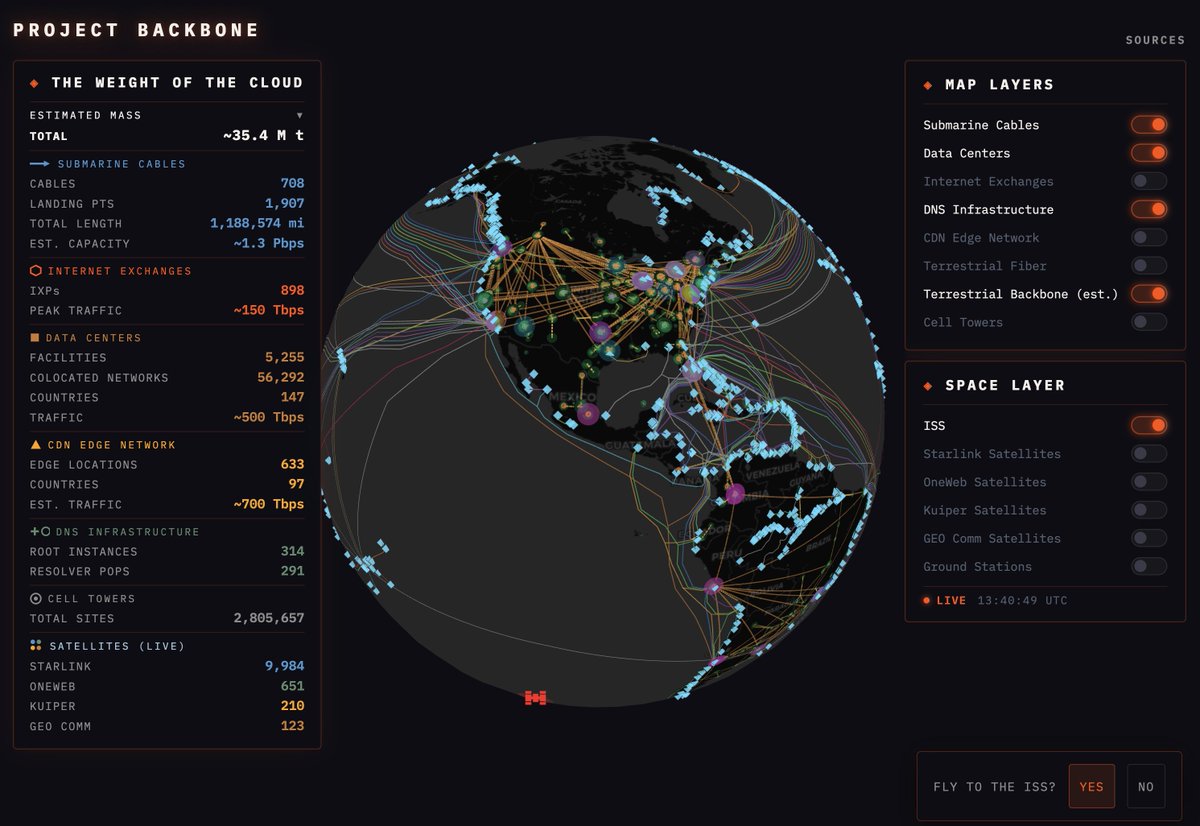
Every time you load a page, your data travels through physical infrastructure - cables under oceans, satellites overhead, fiber under cities.
Most people never think about. That's why I decided to map it.
This is Project Backbone. It's free, interactive, and live.
97
749
4,250
181,851
Mar 25
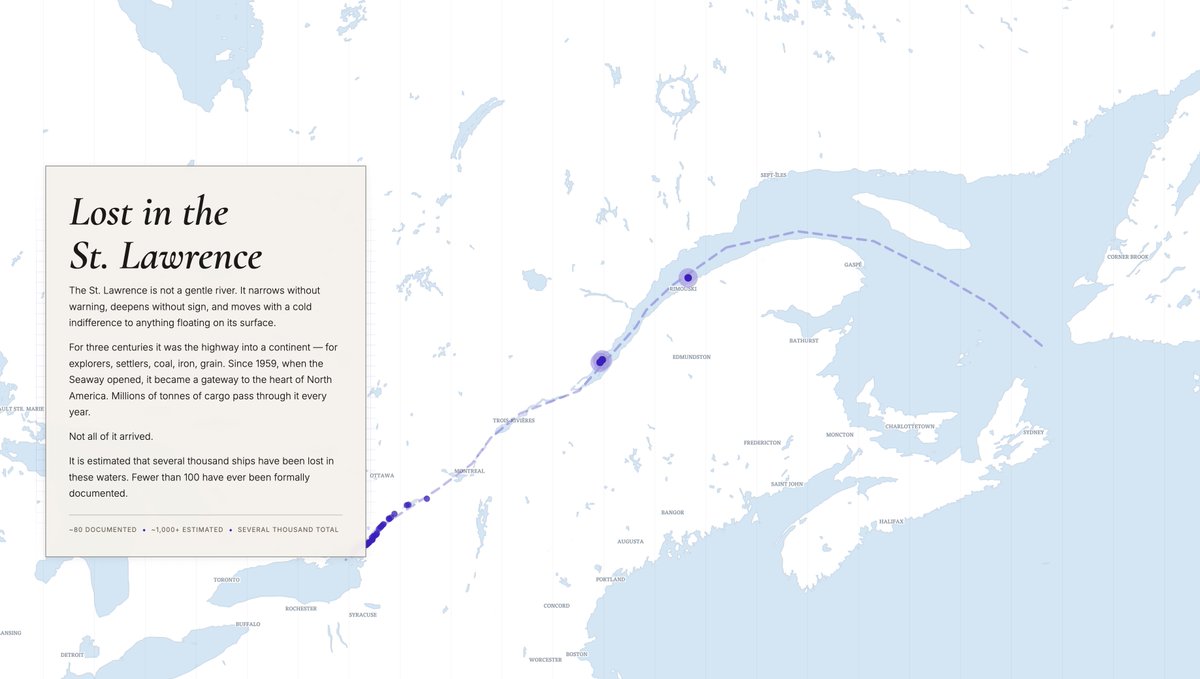
St. Lawrence River Shipwrecks - A scrollytelling map of the largest shipwrecks in the St. Lawrence River — three ships, one fog, and a thousand unnamed graves.
#dataviz #StLawrence #scrollytelling
samodrole.com/projects/st-la…
1
37
Mar 19
I’ve created this project exclusively using Cursor AI. A lot of a learning curve on building design skill guidance.
x.com/samodrole/status/20314…
Mar 10

75 years of MotoGP constructor history — mapped as a living network. Every constructor. Every rider. Every era.
samodrole.com/projects/machi…
#dataviz #datavisualization #motogp #motorcycleracing #d3js #svelte #informationdesign #motorsport #interactivedesign #grandprix
121
Samo Drole retweeted

Mar 17
I've never built something so insane before (and this is only a taste)
Claude Agent SDK Demo with an AI Virtual Pool Trainer.
17
8
177
47,378
Samo Drole retweeted

Mar 12
A Three.js particle engine morphing 24k nodes between three cosmic states. Features a sleek glassmorphism HUD, UnrealBloom, and interactive flow toggles for a high-performance, immersive WebGL experience. Demo and code in comment below 👇
8
23
210
7,317
Mar 11
This is really cool idea!
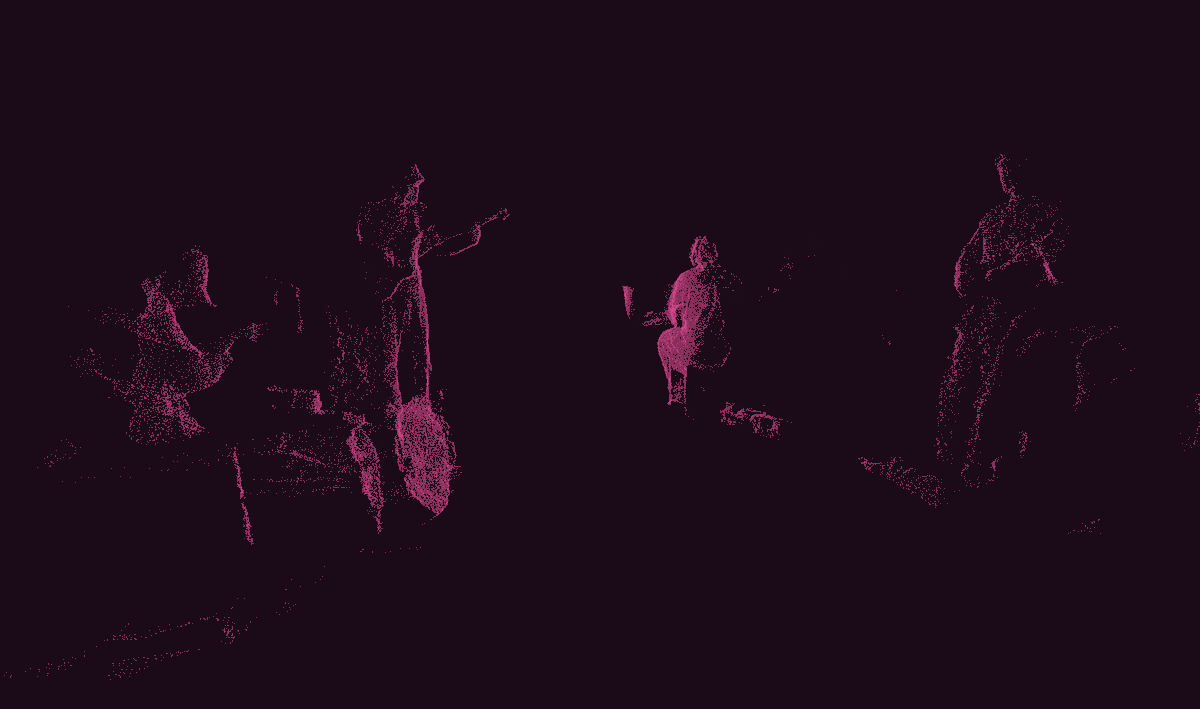
Mar 11

Animated 3D point cloud sequence, shot with Microsoft Kinect, recorded in Touchdesigner, interactive on @threejs
It seems like you can make anything you can think of now.
base-lidar.live/
1
2
87
Samo Drole retweeted

Merz has called for the systematic review of all EU legislation.
That's over 140,000 regulations.
Knowing the EU, that will take over 140,000 days.
So, I made bettereu.com where Grok 4.1 will review every document since 1958 -> 2025.
Feb 11

Germany's Merz:
We must deregulate every sector. I call for a “regulatory clean slate.”
Minor corrections to laws are not sufficient. We need to systematically review the whole set of existing EU legislation.
239
508
4,251
327,402
Mar 6
The 75 Years of Grand Prix Motorcycle Racing dataviz project is coming along nicely.
#motogp #dataviz #sport #Racing #datavisualization
2
72
Samo Drole retweeted

Feb 25
Beneath our feet, the Earth pulses with fiery veins- Magma rivers carving the planet's secrets.
3D interactive globe of global volcanoes like "Veins of the Earth"!
Built w/ React @typescript @threejs @reactthreefiber
Data Source: @smithsonian global volcanism program
Note- The volcano lines are not actual paths just a creative rendition Like/RT if you it's interesting.. #Volcano #DataViz #ThreeJS #Geospatial #CreativeCoding #GAI #VisualArt #climate
14
87
712
32,979
Feb 24
Which electricity plan in BC, Canada?
The tool simulates what you would have paid under every available rate plan using your real historical data.
#electricity #energysaving #savemoney #buildinpublic #sideproject #personalfinance #utilitybills #dataviz
samodrole.com/projects/ratec…
46
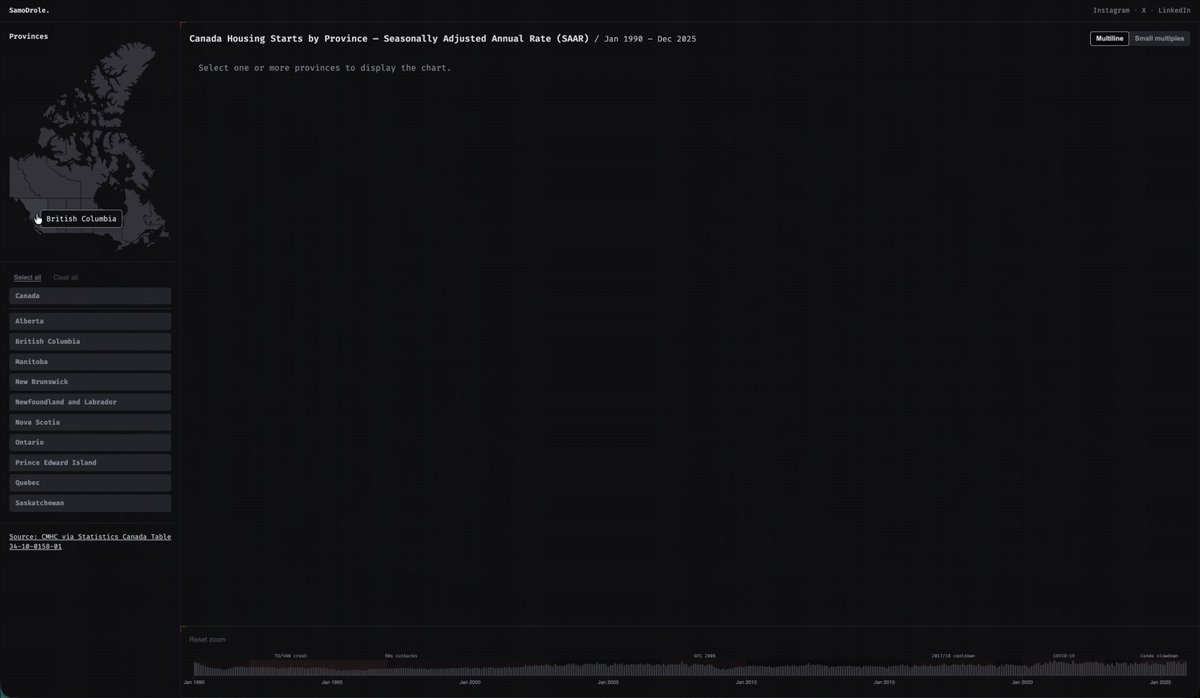
Feb 13
New project: I dove into @CMHC_ca housing starts data and built an interactive dashboard that visualizes provincial trends across major shocks — from 90s policy cutbacks to 2008, the 2017/18 slowdown, and the COVID surge. #dataviz #dashboard #Canada
samodrole.com/projects/canad…
1
1
71
Samo Drole retweeted

Feb 9
I've almost got volume fill down! Still some obvious bugs, but damn this looks insanely cool!
ortho.brdrck.me
10
16
287
14,578
Samo Drole retweeted

Jan 7
Find any ride by searching for it using Cmd K. A Citi Bike receipt has everything you need.
You can jump to any point in time from June 2013 to December 2025.
bikemap.nyc
3
2
131
17,492