Ice melting at Konkordiaplatz, Great Aletschgletscher, continues. No relief for #glaciers...
4 meters of ice loss over the thickest ice of the European Alps in the year 2024 😢
Stay posted for the publication of our results on 1 Oct
@glamos_ch@VAW_glaciology@scnatCH
26 July is #MangroveDay!
Mangroves contribute to the wellbeing, food security, & protection of coastal communities. Yet, they are being lost at a rate of 3-5 times higher than other forests.
Discover their benefits #ForNature & humanity.
📸: @MangroveProject
The protest at COP28 by Licypriya Kangujam, a 12-year-old climate-justice activist from India, leads the frontpage of the Financial Times
Neatly illustrates why these stunts can have so much impact
Will be one of the defining images of this COP
ANALYSIS: what impact will the #COP28 announcements make on closing the emissions gap?
Few of them will do so meaningfully.
Many either lack the ambition, clarity, coverage or accountability needed to make a difference /🧵
[from the *actual* CAT]
bit.ly/CAT_COP28_initiatives
Massachusetts is the first state in the US requiring gas companies to phase down fossil gas for heating.
The state set out a clear path toward electrification of heating and could lead regulators in other states to follow suit.
HT @brucenillesinsideclimatenews.org/news/0…
Revealed: Colonial rule nearly doubles UK’s historical contribution to climate change | @DrSimEvans @VernerViisas
Read here ➡️ bit.ly/3NjsdQP
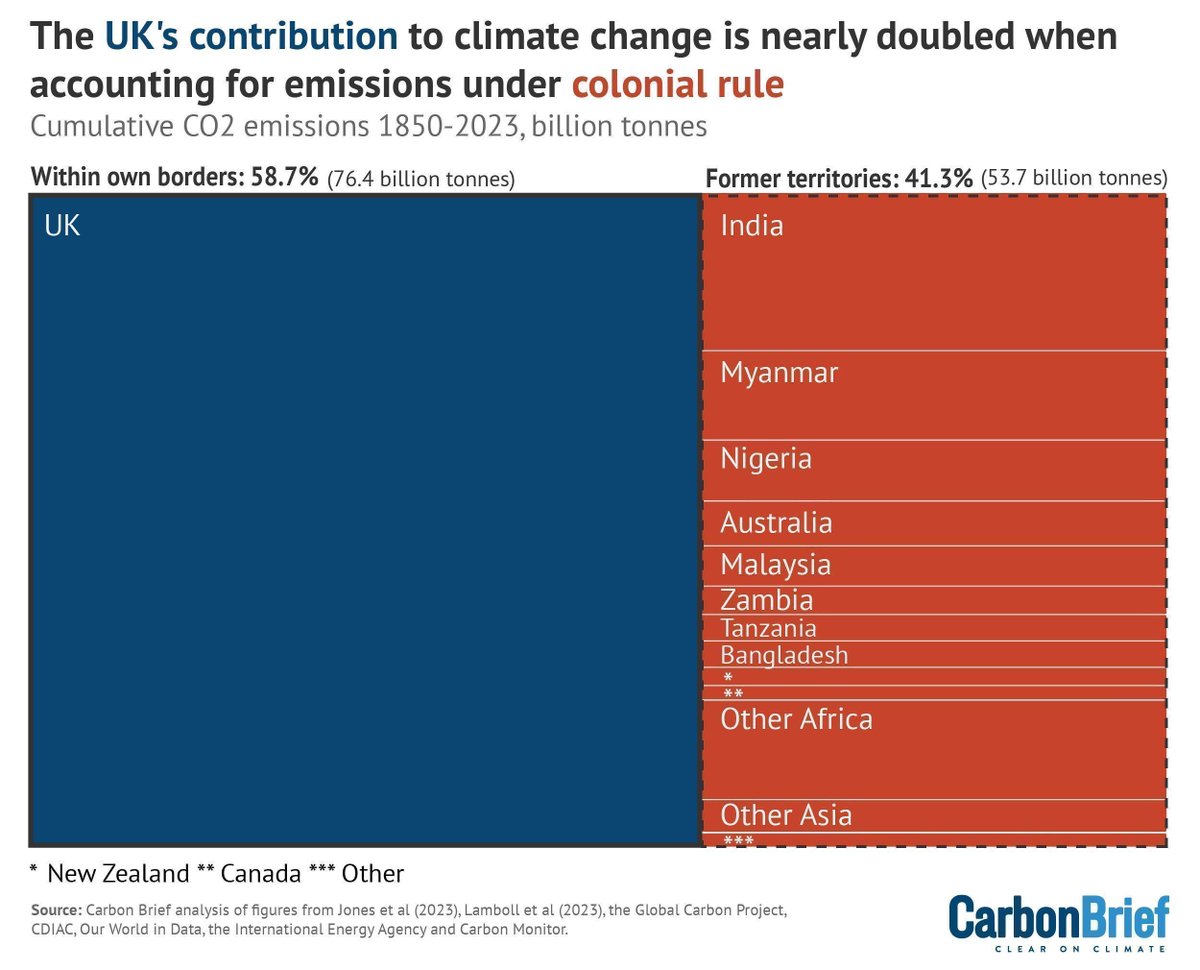
ALT Cumulative CO2 emissions from fossil fuels, cement, land use, land use change and forestry, 1850-2023, billion tonnes. Left: Emissions within the UK. Right: Emissions in other countries under British colonial rule. Source: Carbon Brief analysis of figures from Jones et al (2023), Lamboll et al (2023), the Global Carbon Project, CDIAC, Our World in Data, the International Energy Agency and Carbon Monitor. Chart by Carbon Brief.
Important new report: Just as in the IPCC, it shows that if we go beyond 1.5, we enter a high-risk zone of crossing tipping points. We need to move fast to avoid moving to a point where the Earth system takes over & pushed us in a direction with unmanageable conditions.
500 pages, 200 researchers: The most comprehensive review to date on #TippingPoints in the Earth System is out, with @UniofExeter. The Global Tipping Points report delivers a comprehensive assessment of tipping point risks & societal opportunities.
pik-potsdam.de/en/news/lates…
Beitrag & Interview in @10vor10: Anzahl von Öl-, Gas- & Kohle-Lobbyisten an der #COP28 ist ~4x höher als in 2022
Das ist extrem problematisch. Kann die🇨🇭mit anderen Ländern sicherstellen, dass es nicht wieder vorkommt?
@KlimaAllianzCH @WWF_Schweiz@bafuCHsrf.ch/play/tv/-/video/-?urn…
Published today:
The Broken Record of countries' climate pledges not delivering on the emissions reductions we need.
Read the latest @UNEP#EmissionsGap report
unep.org/resources/emissions…
(A longer 🧵to follow)
The path to reaching net zero emissions from the energy sector & limiting global warming to 1.5 °C has narrowed.
But achieving these goals remains possible due to record growth of key clean energy technologies like solar PV & EVs.
Learn more ➡️ iea.li/4788fjN
Wir könnten 2023 das 1.5°C Ziel erstmal überschreiten.
Wo wir 2050 oder 2100 enden, ist unsicher. Was wir jedoch heute tun können, um auf Kurs zu kommen, ist klar.
Es ist kein Problem von Technologie und Geld, sondern eine Frage der Umsetzung.
tagesanzeiger.ch/1-5-grad-te…
This morning, we released World Energy Outlook 2023 👉 iea.li/3tBGX6z
Don't miss this thread from our Executive Director @fbirol running through some of the key findings ⬇️
The energy world will look very different by 2030, even under today's policy settings
🚗 Nearly 10 times as many electric cars
☀️ Renewables = 80% of new power
⚡️ Electric heating outselling gas boilers
🏭 Fossil fuel demand has peaked
➡️ iea.li/46Ye8jd
Today @wwf_uk release a set of ‘forest stripes’ to highlight the 79% decline in population abundance of species that rely on forests.
Forests are not thriving.
Read the full report: wwf.org.uk/learn/landscapes/…
JUST PUBLISHED
Here's a truly *epic* factcheck by @DrSimEvans where, in turn, he calmly dismantles TWENTY-ONE of the most misleading media claims made against EVs.
Months in the making, this is the one-stop-shop debunking you've been waiting for...
NEW – Factcheck: 21 misleading myths about electric vehicles | @DrSimEvans
Read here: bit.ly/3QtuJG3
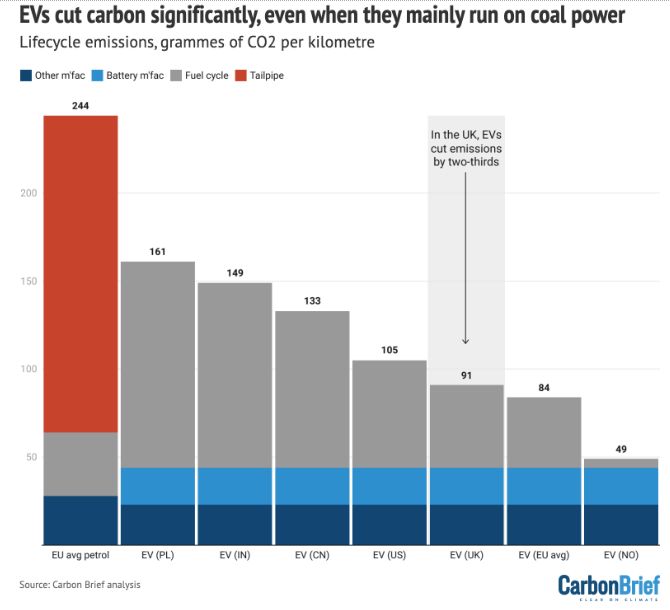
ALT Lifecycle emissions, grams of CO2 per km, for an average EU petrol car and a Tesla Model Y running on the average electricity mix in a range of countries. Source: Carbon Brief analysis. Chart by Carbon Brief using Datawrapper.