
Philly native, Penn State alum
Joined January 2009
- Tweets 67,436
- Following 420
- Followers 3,883
- Likes 113
19,177 Photos and videos


Pinned Tweet

24 Jun 2025
Just like the internet, the most ambitious forecasts will wildly underestimate the impact of AI
4
1
30
76,646
Stephen Eckhardt ☀️ retweeted

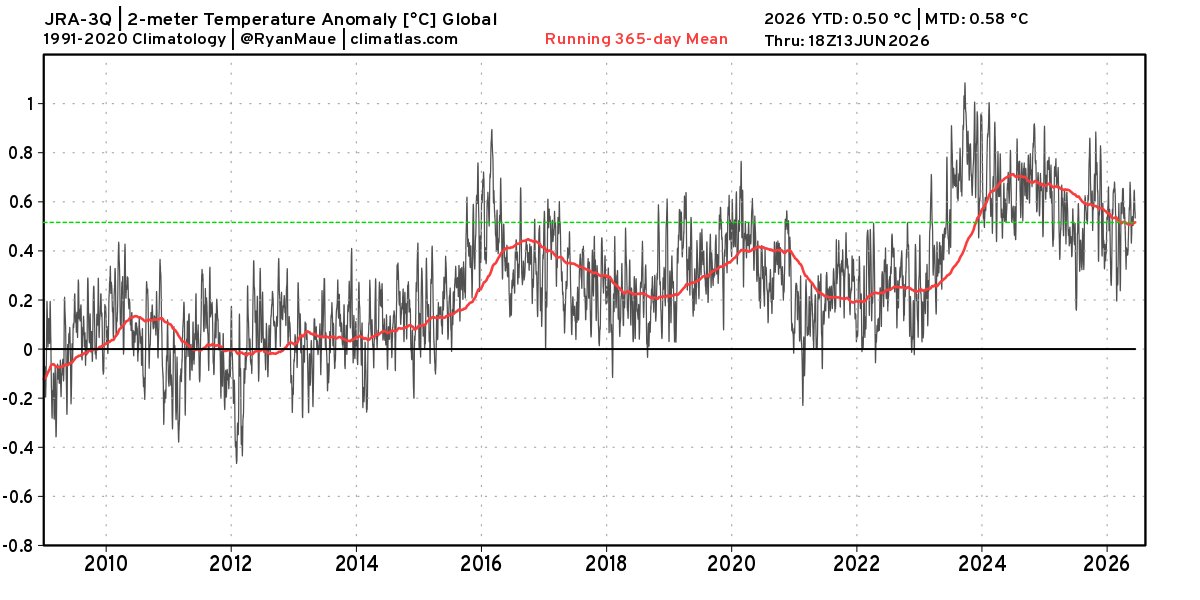
More than 20-years ago, I started calculating global temperature anomaly on daily (and 6-hourly) time scales with numerical weather prediction model data -- a pioneer in some regards -- but it eventually caught on! I just didn't trust the surface temperature record without the data assimilation constraints.
Some did not like the methodology, but it's now standard across globe -- at least for monthly averages.
I like the higher-frequency data in order to show the dependence of global temperature on weather time scale features (synoptic scale) especially since we're talking about 2-meters above ground, and not sea-surface temperatures.
ERA5 and JRA-3Q are the two 5th Generation NWP Reanalysis commonly used.
Here's 2009-2026 (as of 3-days ago)
Like a stock ticker 📈or heart EKG♥️we can take the daily pulse of the planet.
Global temperatures until the El Niño of Summer 2023 were not rising very much hovering around 0.2°C over 1991-2020 climatology (add 0.85°C for pre-industrial) so 1.05ºC. But the spike in summer 2023 was dramatic, and we've slowly planed off from the record high 365-day mean (red line) reached in mid-2024.
Is this evidence of "accelerated warming" ?
I don't think so BUT this ongoing El Niño is the true test the next 1-2 years.
Global warming happens in steps -- are we going to step up again?
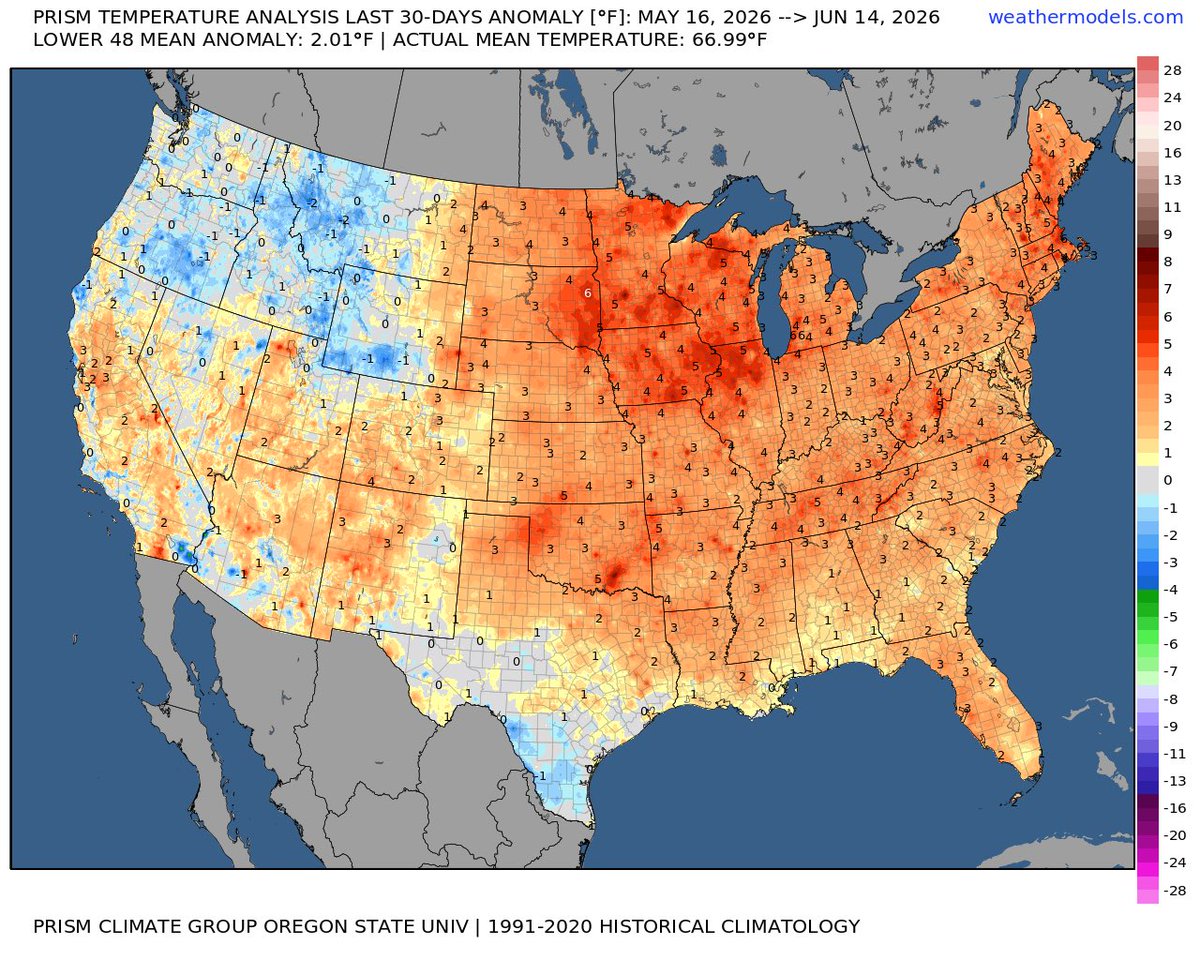
Daily temperature analysis shows this much better than monthly.
7
9
48
5,853
Stephen Eckhardt ☀️ retweeted

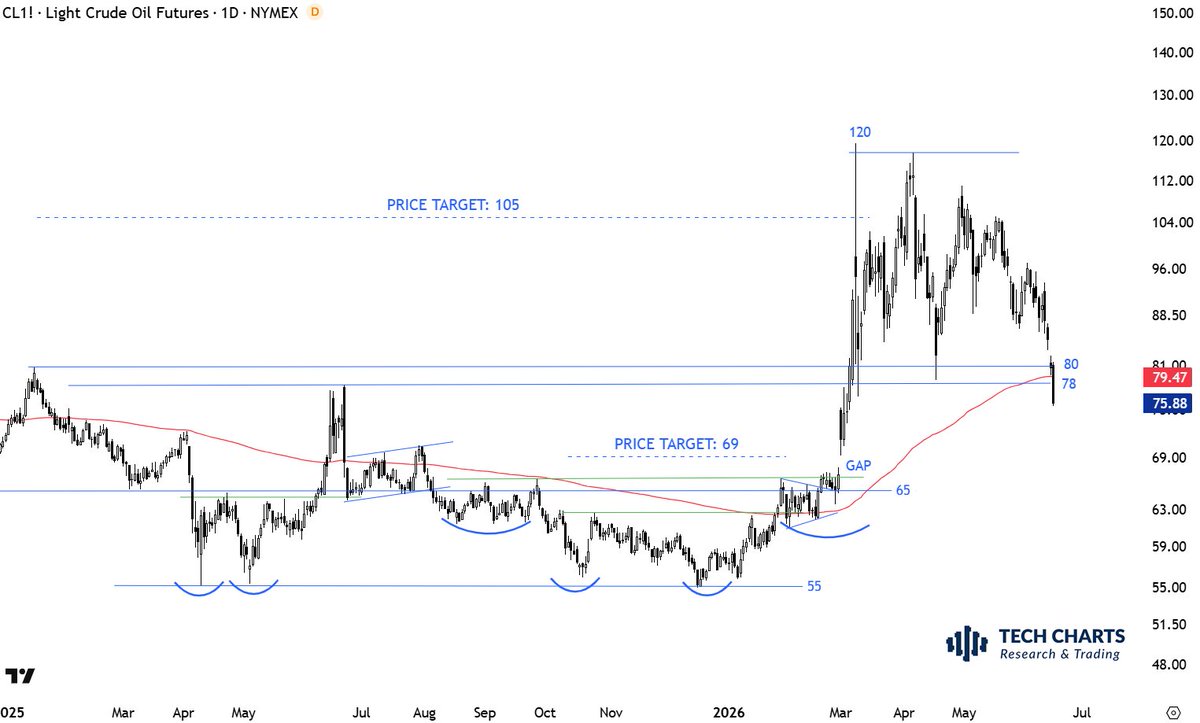
Breakdown of support and the moving average on #CRUDEOIL is shift in trend. Price settling below year-long average can open the range towards 65 levels.
11
10
195
14,125
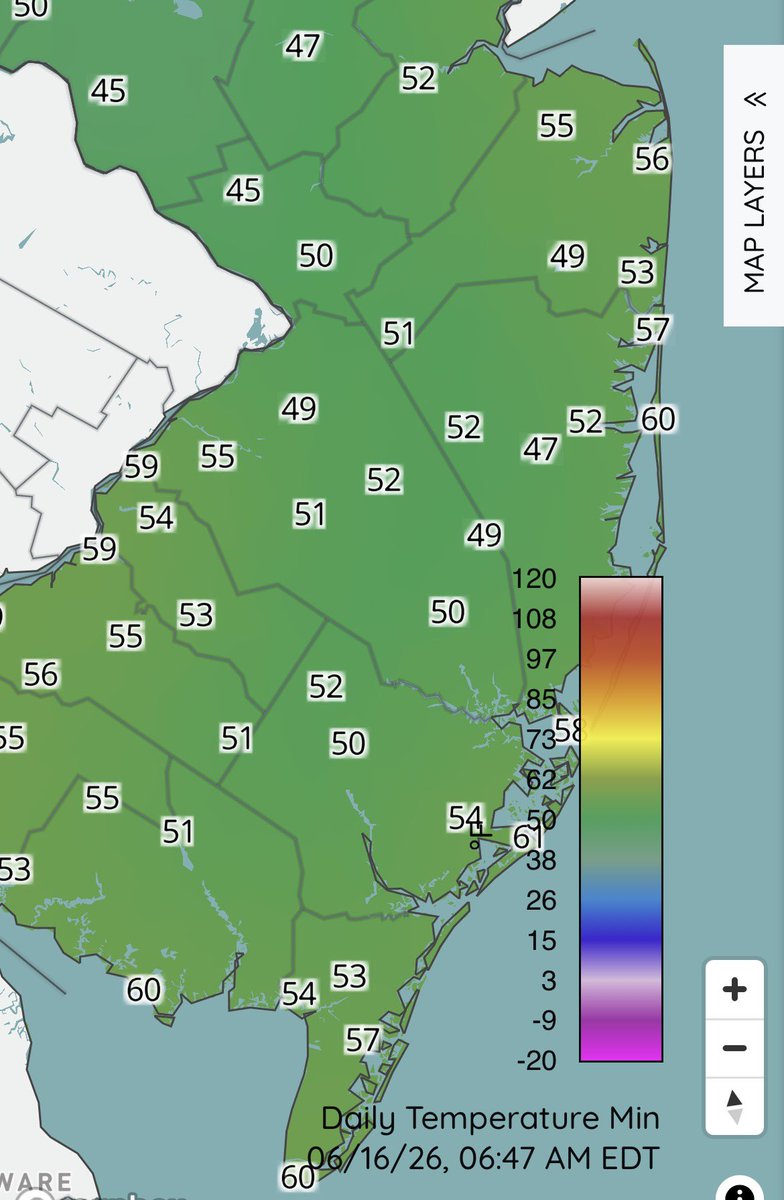
Limited spots in the 40s this time. Still great for mid June
9
665
Jun 15
Because it’s not necessary like it was decades ago. You’d think he would at least mention that.
Jun 15

🚨 BREAKING: The Strategic Petroleum Reserve has just fallen to its lowest level since August 1983- 340.3mb. That's a 42 yr low. No matter where you stand politically, it's a remarkable statistic: America's emergency oil stockpile hasn't been this depleted since the Reagan era.
2
1
1,287
Stephen Eckhardt ☀️ retweeted

Jun 15
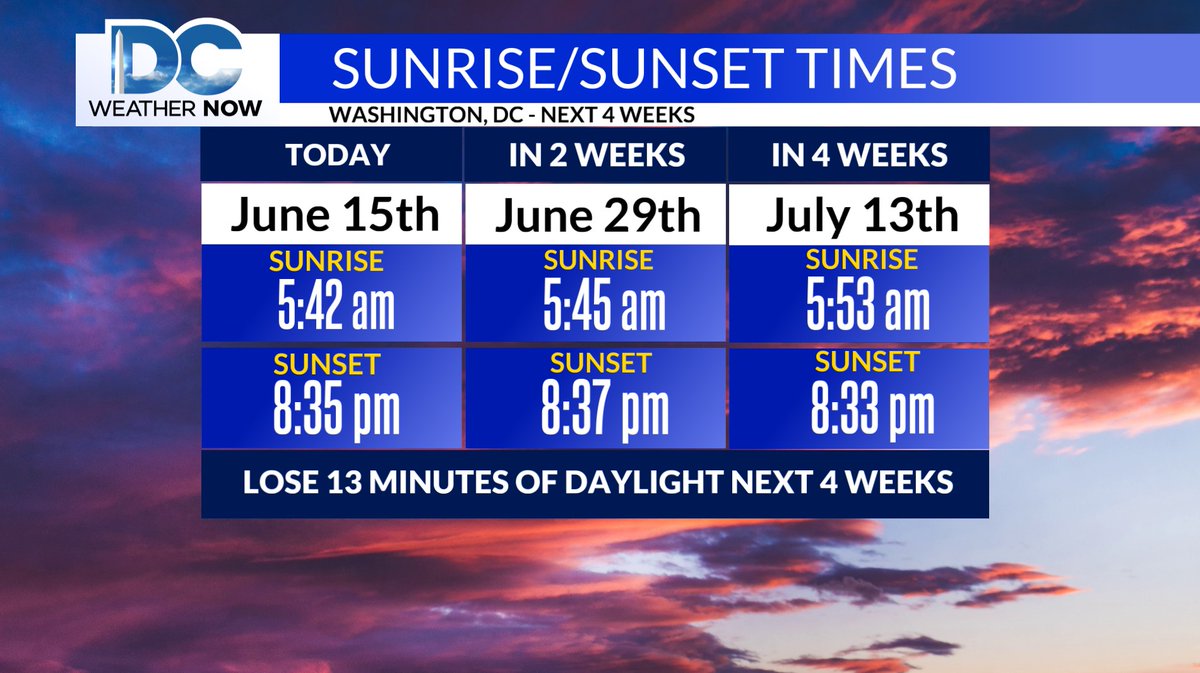
Sunset this evening is at 8:35pm. We continue to gain daylight up until the Summer Solstice, which is this Sunday (the same day as Father's Day).
So, that means over the next four weeks, we actually will lose daylight. We lose 13 minutes of daylight through July 13th. #sunset
1
5
12
1,676
Jun 15
Keep squeezing out nights in the 40s here n there yet temps have been well above for months now. Another one?
Jun 15

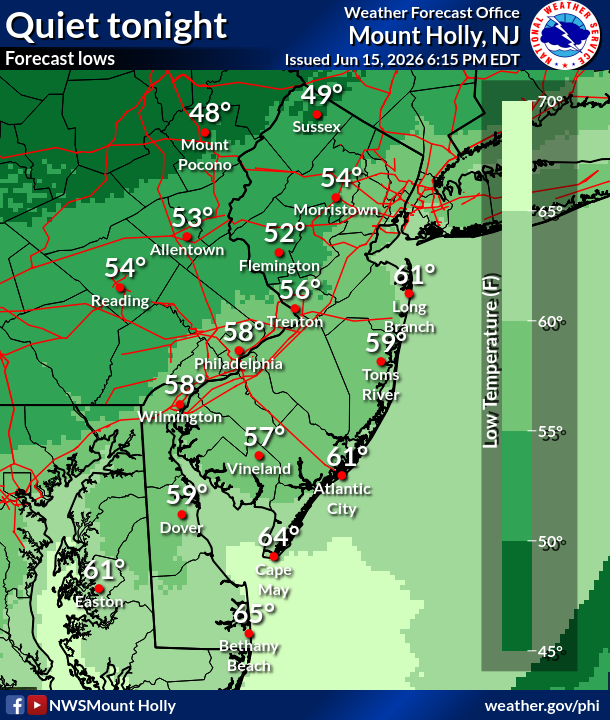
Lows displayed are for the more urban locales... more rural areas will be cooler. For example, both airports near Allentown PA and Toms River NJ could drop into the upper 40s tonight.
5
1,170

Stephen Eckhardt ☀️ retweeted

Jun 15
The year is 1825. Inequality is surging as industrial expansion begins to boom across the USA.
John Jacob Astor, a fur trader and real estate investor becomes the USA's first millionaire.
Socialist politicians explode in anger and tell the American public that this inequality is unfair and we need to ban millionaires so this never happens again.
Fast forward 200 years - the politicians were ignored. The USA has become the wealthiest country in human history by a huge margin. The median American is wealthier than 90% of the rest of the world. Capitalism won.
27
52
544
38,987
Stephen Eckhardt ☀️ retweeted

Jun 15
Philadelphia's 1.06" of rainfall on Sunday was the wettest single day (excluding frozen precip) since December 19, 2025 (1.48"). #PAwx
Wilmington's 2.17" of rainfall on Sunday was the wettest since June 30, 2025 (2.24"), & broke the daily precip record of 1.60" from 1939. #DEwx
5
13
86
10,496
Jun 14
Sunday evening futures. Not expecting it, but would be noteworthy if we somehow drifted lower all day tomorrow and closed near or even in the red.
1
2
890
Jun 15
Indices still gaining from the open. Very strong day. New highs in semis once again.
1
381
Jun 15
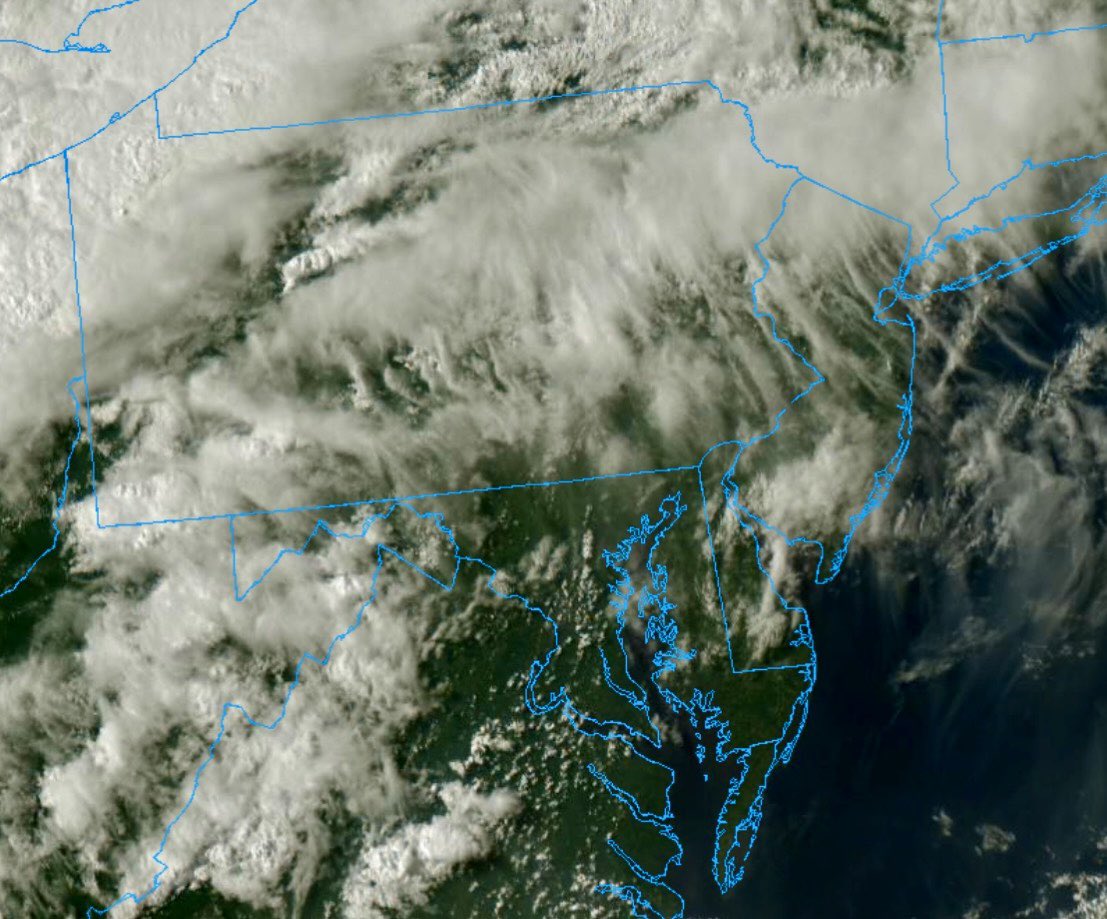
Yikes! No rain at all in the Extreme Drought areas. Soaking around Philly.
2
1
20
2,411
Jun 15
What the hell is with these olive green 🫒 dewpoint maps
1
1
582
Jun 14
Western PA with a severe outbreak just reinforces that we’ve been stuck in the same pattern for the last few years.
1
1
13
1,014