
Transportation Techies are programmers who love visualizing open data from transportation systems. Organized by @mvs202.
Joined December 2013
- Tweets 1,996
- Following 277
- Followers 1,687
- Likes 1,768
226 Photos and videos


Transportation Tech retweeted

I had a lot of Fable tokens to use up before my weekly reset, so I made this live 3D map of London with Three.js
Every train, bus, boat and plane is real and live right now!
- Tube, bus and riverboat data from TfL
- National Rail trains from Darwin live departure boards
- ADS-B for planes and helicopters
- AIS feed for boats and ships
- Map data from Overture and OpenStreetMap
Trains and buses have no GPS feed, so their positions are inferred from arrival countdowns and departure boards, then animated along the track/route geometry
67
132
2,064
177,147
☕️🚌 @rideRTD director @chrisFnicholson made "Find Coffee Near Transit" app for Denver: rtdcoffee.pages.dev/
32
Transportation Tech retweeted

May 29
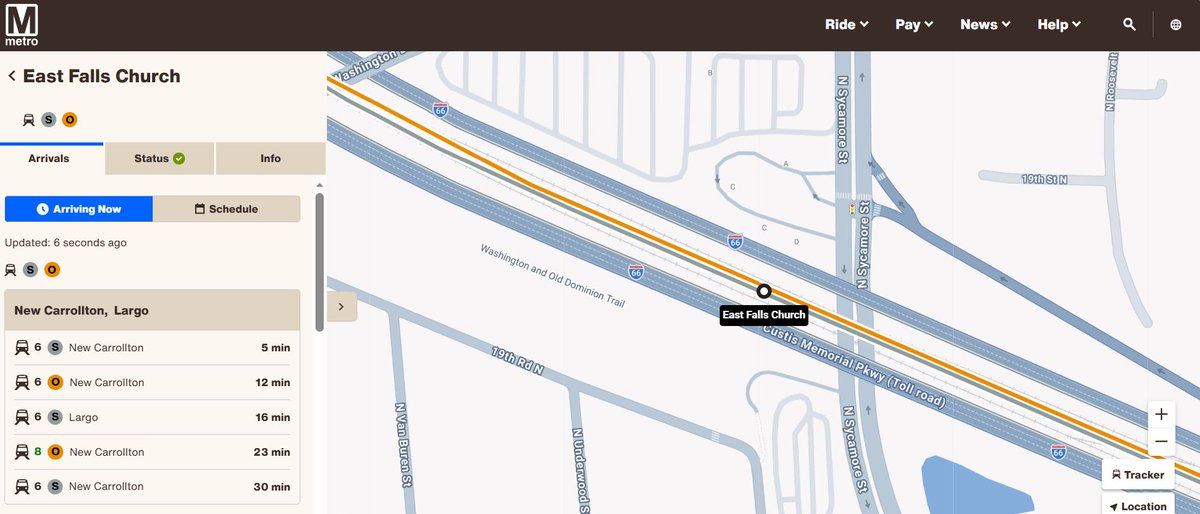
We heard your feedback & updated our website! 📲💻
✔️Train lengths displayed
✔️Real-time elevator/escalator tracking (single view of ALL elevator/escalator statuses)
✔️Navigation upgrades
✔️Improved arrival countdowns
✔️Enhanced station & stop search
wmata.com
1
11
111
6,571
Transportation Tech retweeted

Huge news. @wmata API now updates every 5 seconds! Adjust your apps, people!
May 7

👇 This is a big upgrade for Better Bus service. We have been working on this for a bit and the new tech is going to make tracking 🚌 more accurate & faster. This means better real time data so better OTP, Control Center can help reduce bunching/gapping & apps are more accurate.
1
2
18
4,709
Transportation Tech retweeted

I made a super simple website where you can see everywhere you can get to in under an hour on the NYC subway.
The generated map is both a heat-map (changes color) and a cartogram (warps space).
castrio.me/nyc
90
504
5,712
461,767
Transportation Tech retweeted

Apr 22
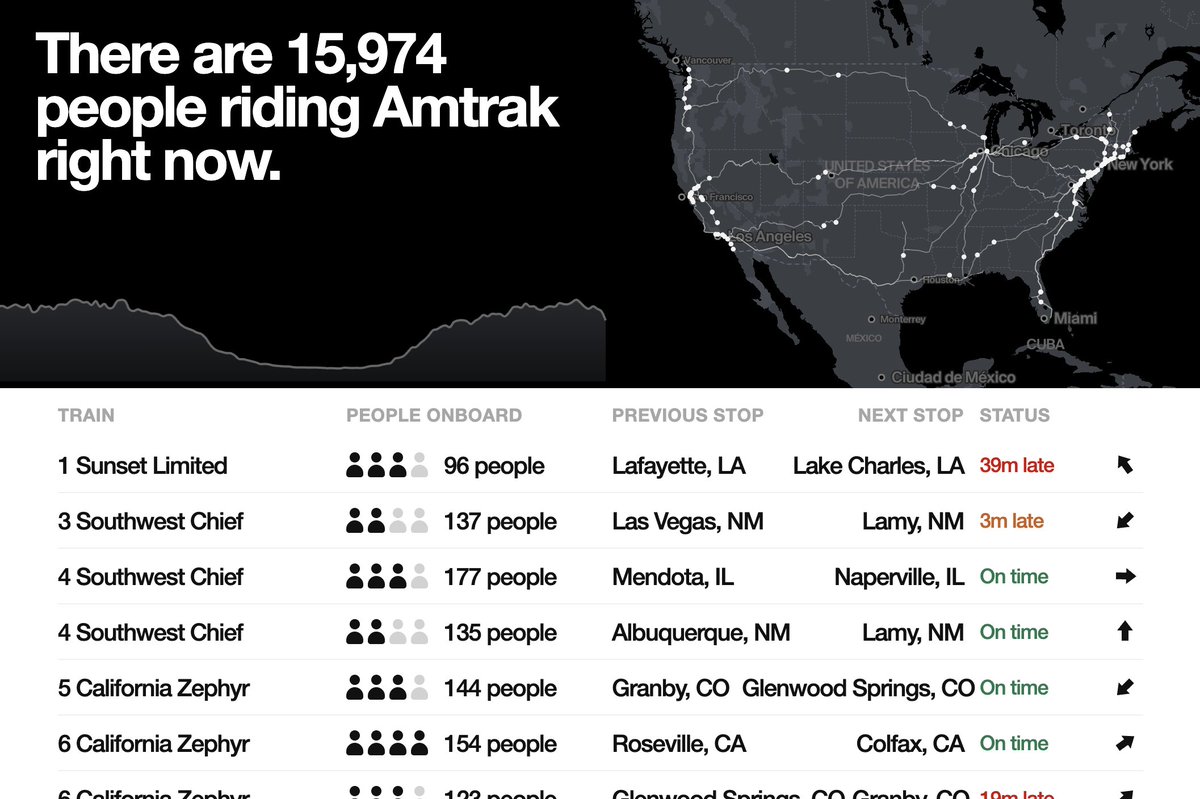
I'm scraping Amtrak, and made a website to see how busy each train is!
74
171
4,456
408,652

🚆Train data alert!
FRA published its quarterly report on intercity passenger train performance, covering October-December 2025. This report provides data on Amtrak passenger train operations, including the first full quarter of data from the new Mardi Gras service.
railroads.dot.gov/passenger-…
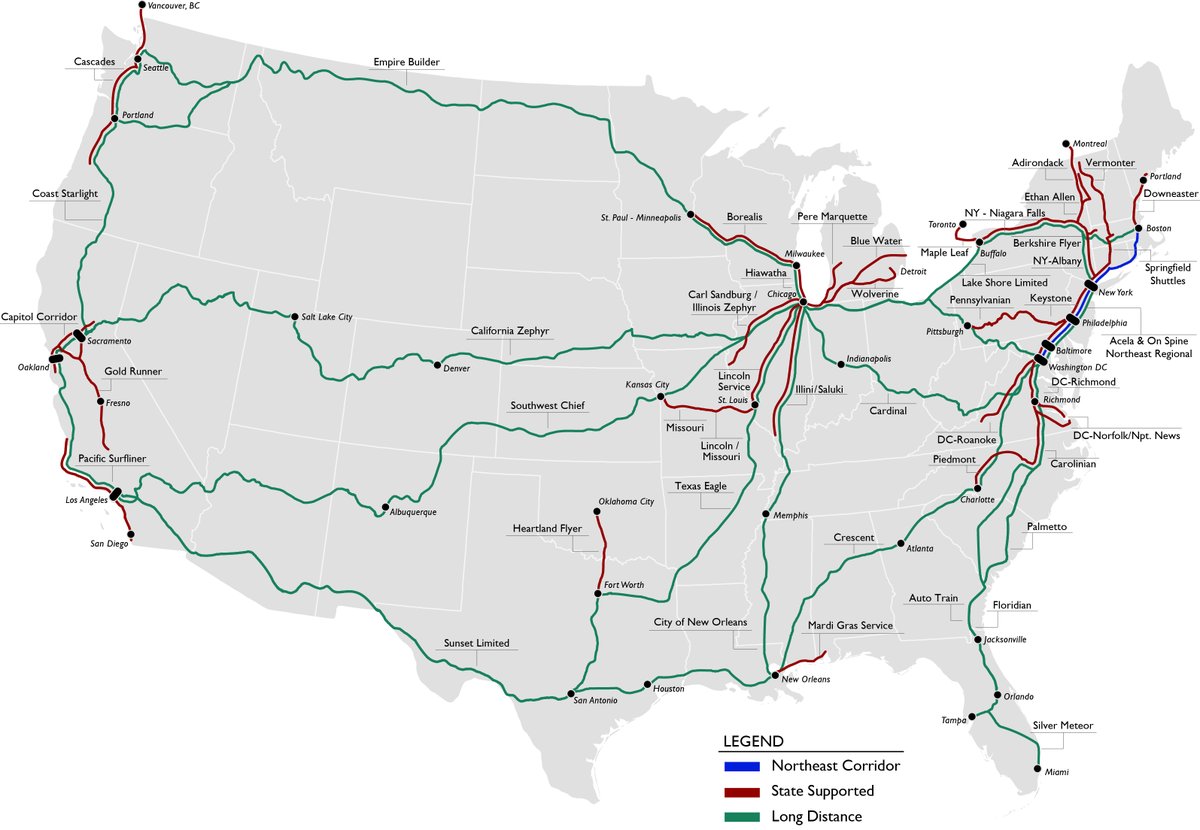
ALT USA passenger rail map
1
8
62
3,216
Transportation Tech retweeted

March Citi Bike trips just dropped if you're into that kinda stuff
7
29
359
14,305
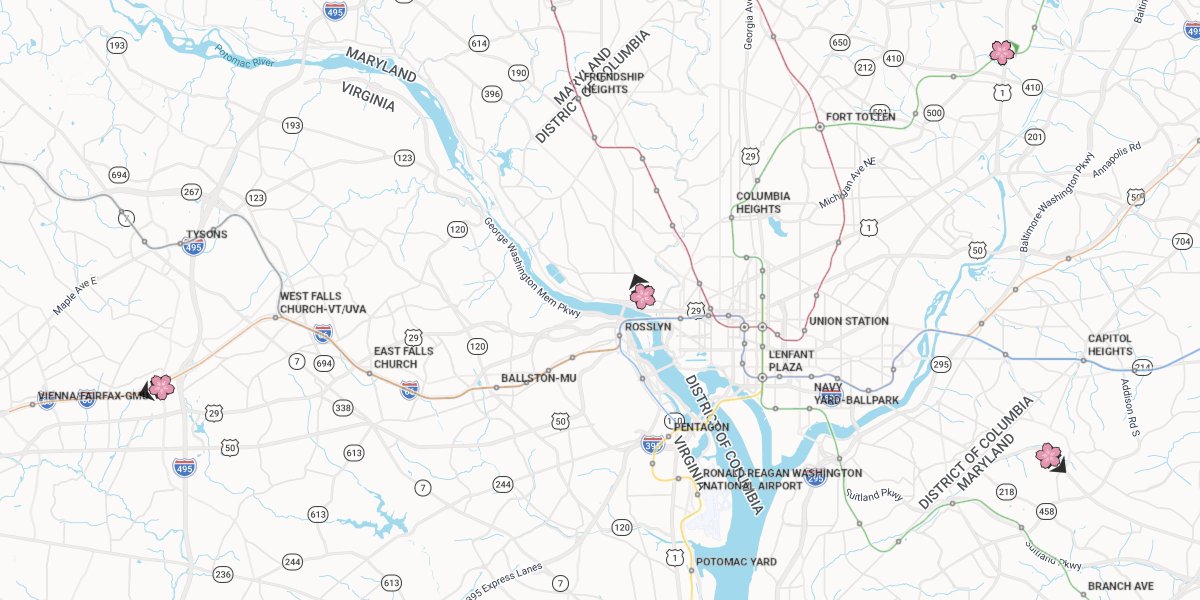
🌸 Track Metro's cherry blossom trains & buses: go to gis.wmata.com/live/ and hit “Special Edition.”
38

Every day, millions of people travel through New York’s subway system, spanning over 400 stations and 600 miles of track!🗽🚇 This animation illustrates how travel patterns change throughout the day.
🔹Explore the story map: ow.ly/FxgH50YvtB2
12
45
4,611
Transportation Tech retweeted

Mar 15
When I moved to new york, I found it hard to visualize what commute times actually looked like.
The same dilemma occurs every time you move, or even book a hotel: what's actually accessible in 20 minutes of public transit?
Deployment link below
97
133
5,179
1,452,618

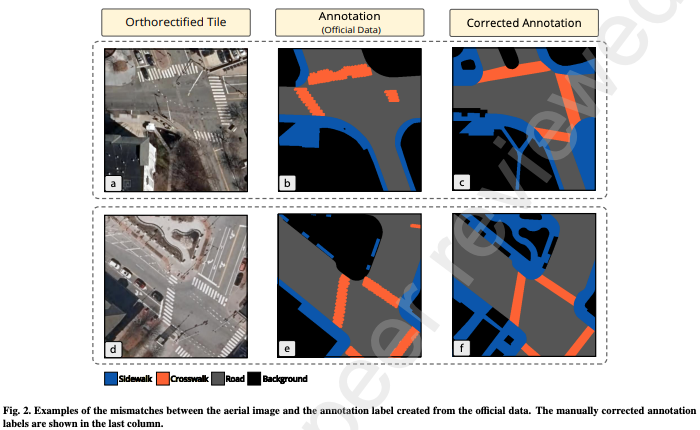
🗺️ DVRPC has released a new tool, the Sidewalk Priority Score, which identifies and prioritizes needed sidewalk connections in the Greater Philadelphia region: dvrpc.org/news/2026/new-tool…
@DVRPC | @511PAPhilly

3
6
327
Transportation Tech retweeted

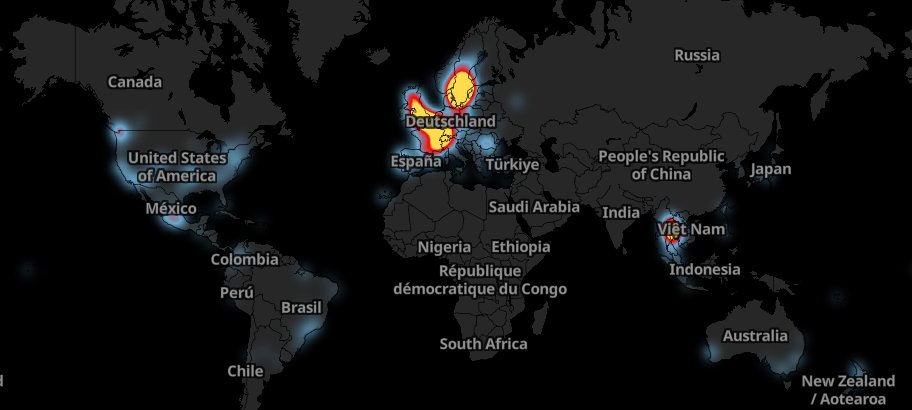
Continuing our @Kpler analysis of GNSS spoofing in the Strait, this animation uses raw unfiltered AIS data to compare Feb 27 vs 28.
The chaotic tracks on the 28th show intense GNSS spoofing with red lines showing AIS “jumps” caused by interference.
#dataviz #ais #StraitofHormuz
7
26
3,189

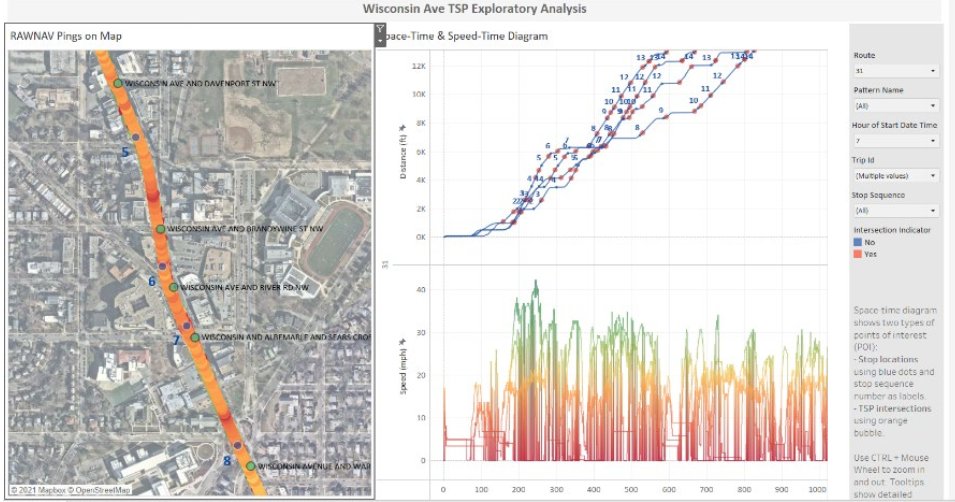
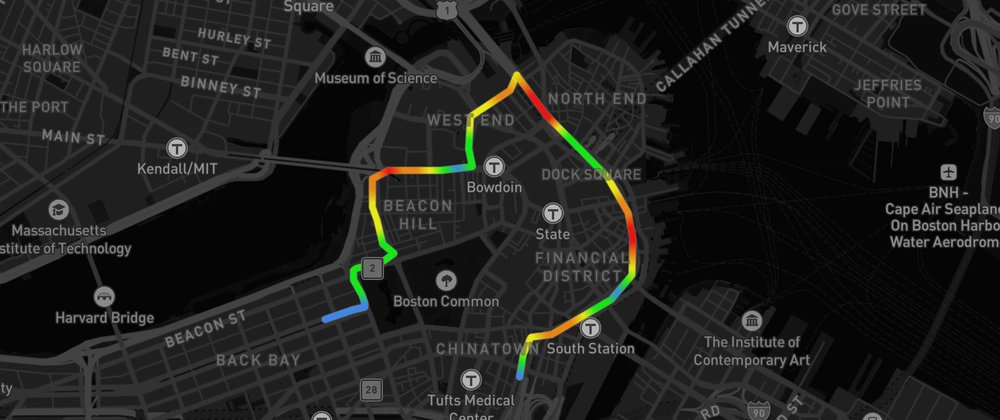
Building ride playback with speed visualization in Mapbox GL JS?
A developer on Reddit asked how to color-code speed along a bike route (green → yellow → red) and add interactive scrubbing to reveal speed time data at any point.
We built a working demo.
This post shows how to:
✅ Use line gradients to visualize speed variations
✅ Dynamically build gradient stops based on speed data
✅ Implement hover-based route “scrubbing” UX
Includes a live CodePen you can fork and adapt.
Read the walkthrough: dev.to/mapbox/mapbox-demo-bi…
#BuiltWithMapbox #DataViz #WebDevelopment #JavaScript #GeoJSON
6
34
3,075
Transportation Tech retweeted

Built an app for cyclists who record their rides. Telemetry Studio syncs your bike computer data to video and adds overlays - power zones, heart rate, speed, GPS map, elevation.
Works with FIT and GPX files. Strava segments too.
Download and try it free at telemetrystudio.com
3
4
302
Transportation Tech retweeted

Feb 5
Bike Data Project - Citizens collecting cycling data to make cities more bike-friendly. github: github.com/bikedataproject bikedataproject.org/
2
17
861
The Rail Crossing Locator is back and better than ever!
📱Apple (iOS) Users:
Your current app will continue to function and receive updates as usual. You can also download it anytime from the Apple App Store.
📱Android Users:
Please delete the older version of the app and reinstall the updated FRA Locator application from the Google Play Store.
💻Web Users:
To access the “Map To” feature, be sure that Google Maps is installed on your device. We’ve also added a new FAQs guide and help section to the web application to provide additional support.
Stay informed. Stay safe.
Access the Rail Crossing Locator here:
fra.dot.gov/railcrossingloca…
ALT FRA Rail Crossing Locator app icon
1
434

24 Dec 2025
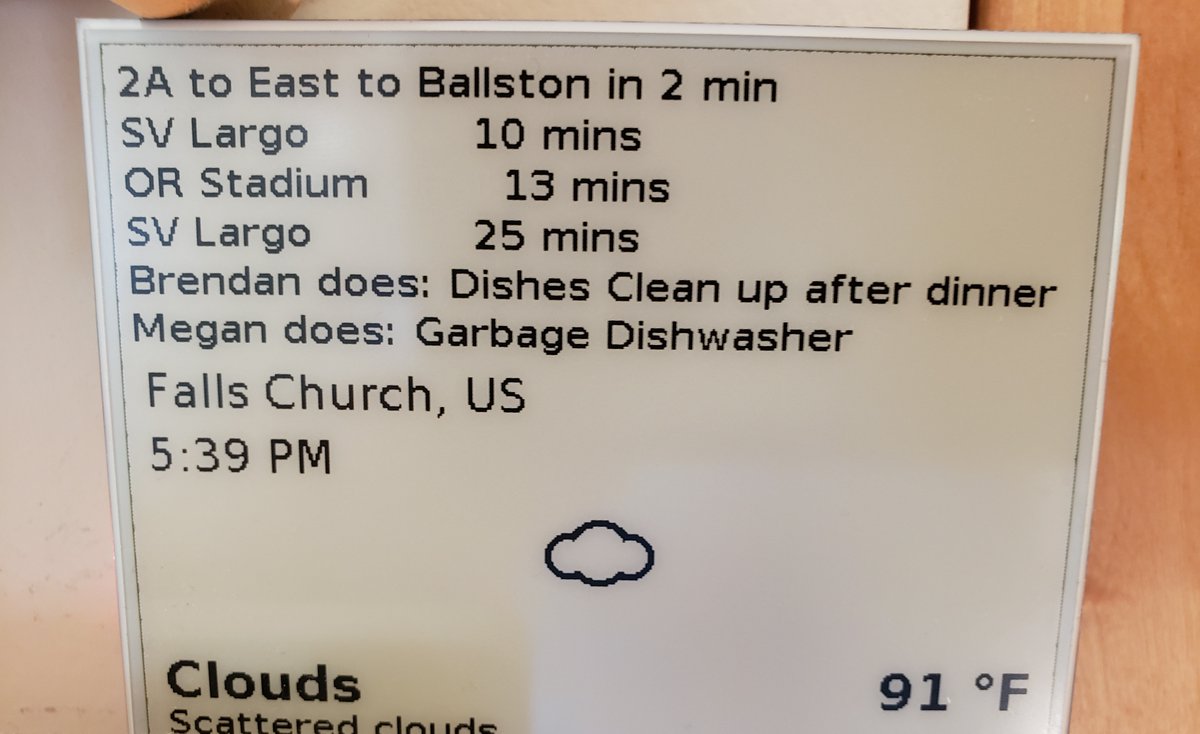
Short film about a guy building @Raspberry_Pi Christmas gifts for his friends to navigate Boston's @MBTA: youtube.com/watch?v=jHDNbvv6… 🎅
1
1
175
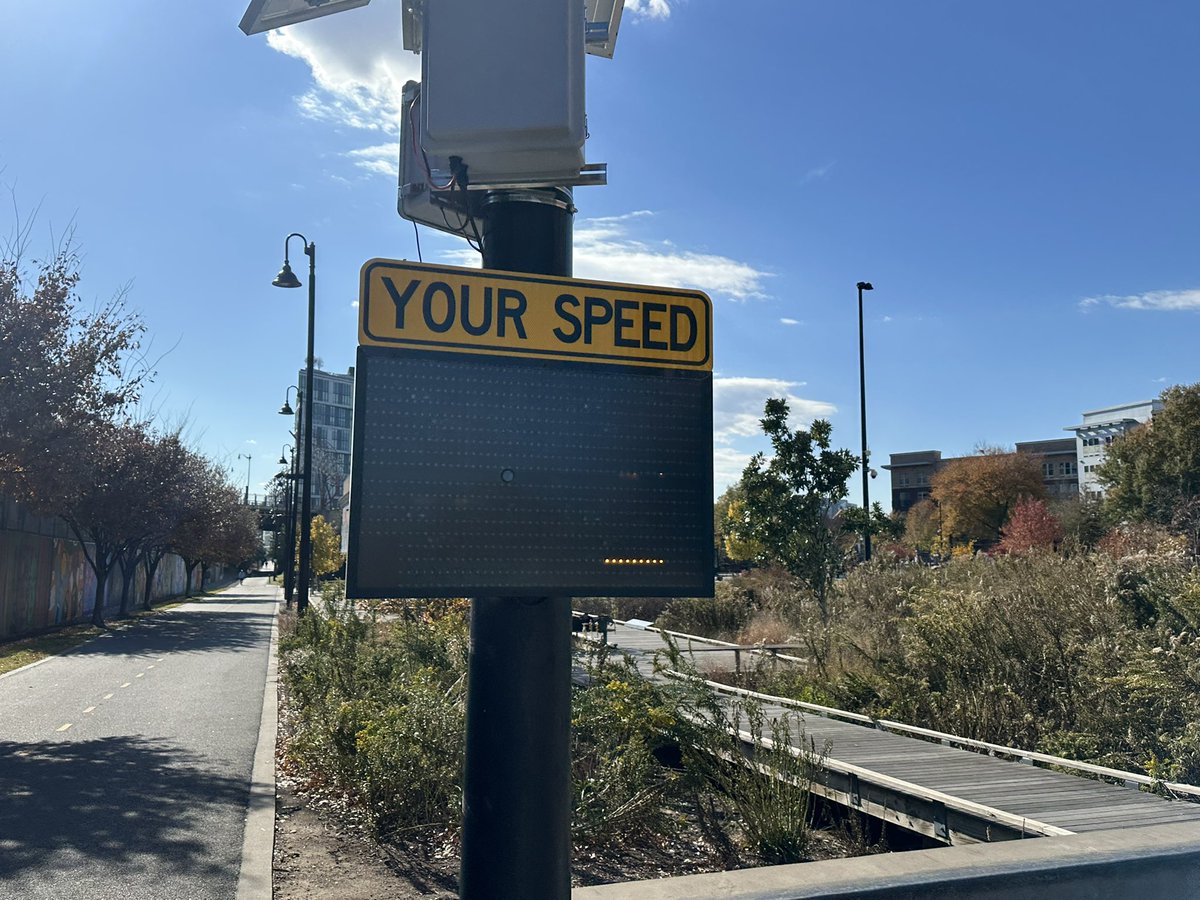
Transportation Tech retweeted

12 Nov 2025
Interesting: @DDOTDC has placed two speed-sensing cameras along the Metropolitan Bike Trail that show a smiley face if you’re riding under 15 mph or a frown if you’re above. City officials say it’s to encourage safer riding, but they are also collecting speed data from cyclists.
12
8
61
12,678
31 Oct 2025
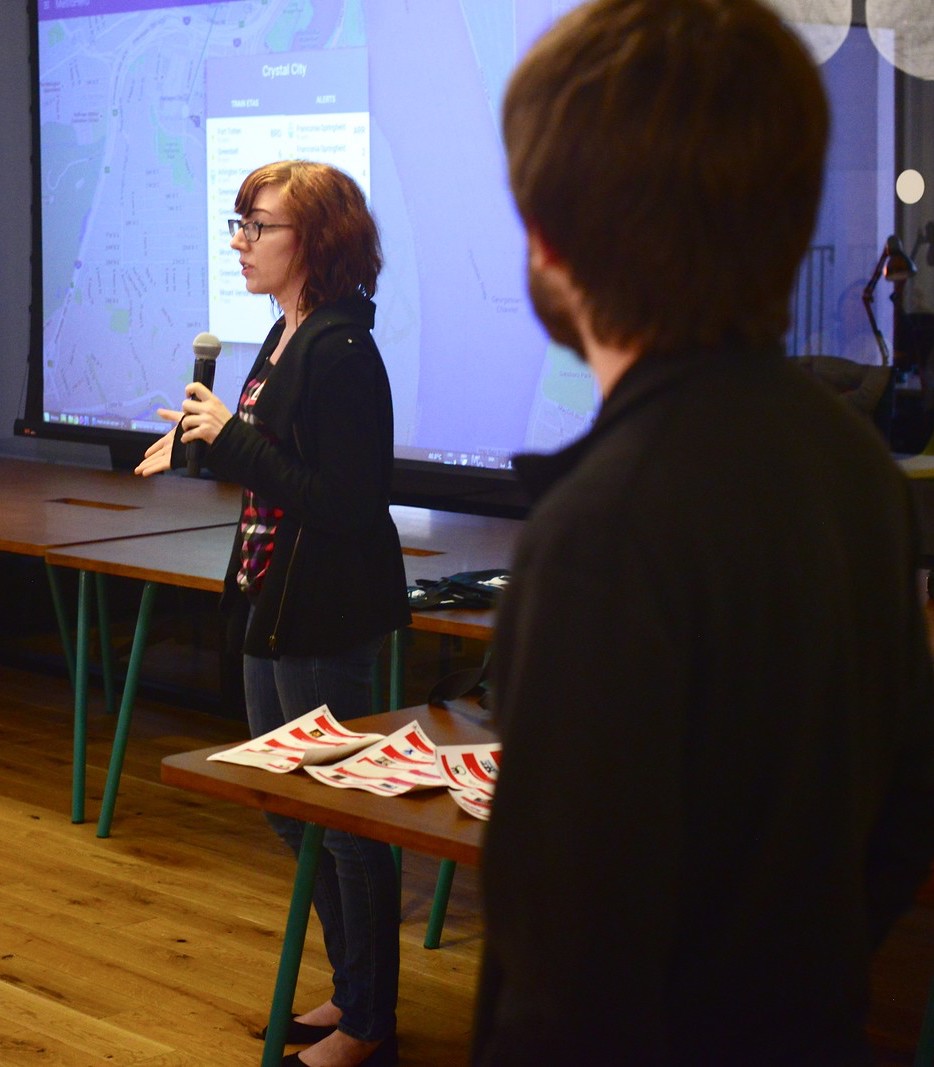
Wednesday, Nov 12 @geodcmeetup will have a presentation on RideFlow DC: meetup.com/geo-dc/events/311…
79