
Scientist @fredhutch, studying viruses, evolution and immunity. Collection of #COVID19 threads here: bedford.io/misc/twitter/
Joined December 2010
- Tweets 5,265
- Following 748
- Followers 402,144
- Likes 6,511
886 Photos and videos


5 Dec 2022
Unfortunately, I'm not sure how best to extrapolate this number to the US, as I believe that testing has declined more in the UK than in the US. However, the ~10-fold difference between a year ago and today is absolutely striking and may suggest a roughly similar decline. 11/16
21
11
121
5 Dec 2022
This would imply a crude infection to fatality rate (IFR) of 17514/25.8M = 0.07% or 1 death in ~1500 infections, which fits with broad expectation for current IFR. If instead we use deaths with COVID on death certificate we get an IFR of 0.04%. 15/16
9
13
107
5 Dec 2022
We have a situation of continued substantial circulation, but with per infection risk of death similar to influenza. Though this is not accounting for long COVID which alongside greater circulation places health burden of COVID substantially higher than influenza. 16/16
24
33
203
5 Dec 2022
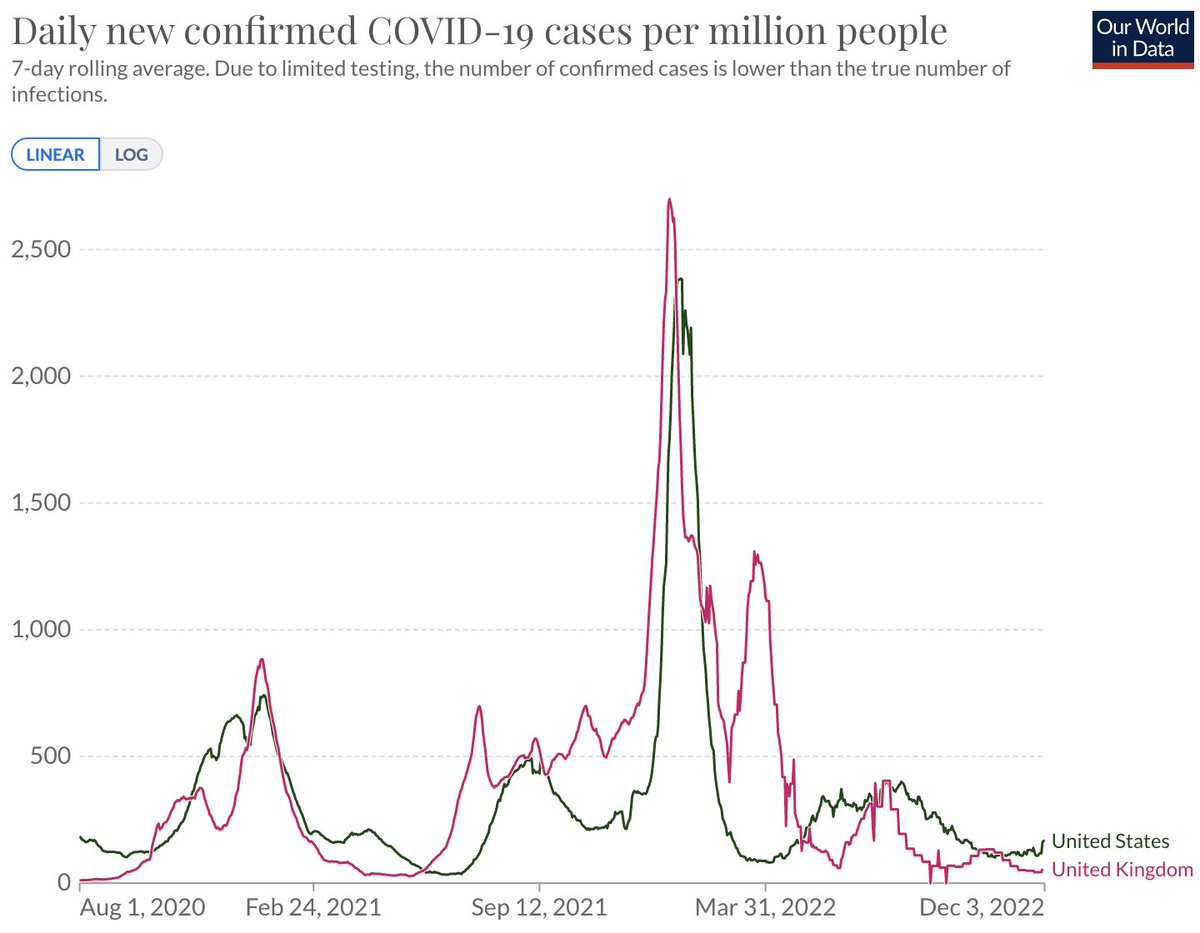
Currently, the US is reporting about 54k daily cases of COVID-19 (16 per 100k per capita) and the UK is reporting about 4k (6 per 100k). This seems comfortingly low compared to even this summer's BA.5 wave and let alone last winter's BA.1 wave. Figure from @OurWorldInData. 1/16
18
76
296
5 Dec 2022
Likewise, the current 300-fold ratio can be converted assuming the average infection tests positive for 8-days in 2022 (medrxiv.org/content/10.1101/…). This would imply a current case detection rate of 1 case per ~38 infections. 10/16
8
15
75
5 Dec 2022
The 30-fold ratio can be converted into case detection rate by dividing by the span of time during which the average infection tests positive. I'll use 10-days for the pre-Omicron period (nejm.org/doi/full/10.1056/NE…). This gives a detection rate of 1 case per ~3 infections. 9/16
2
5
56
5 Dec 2022
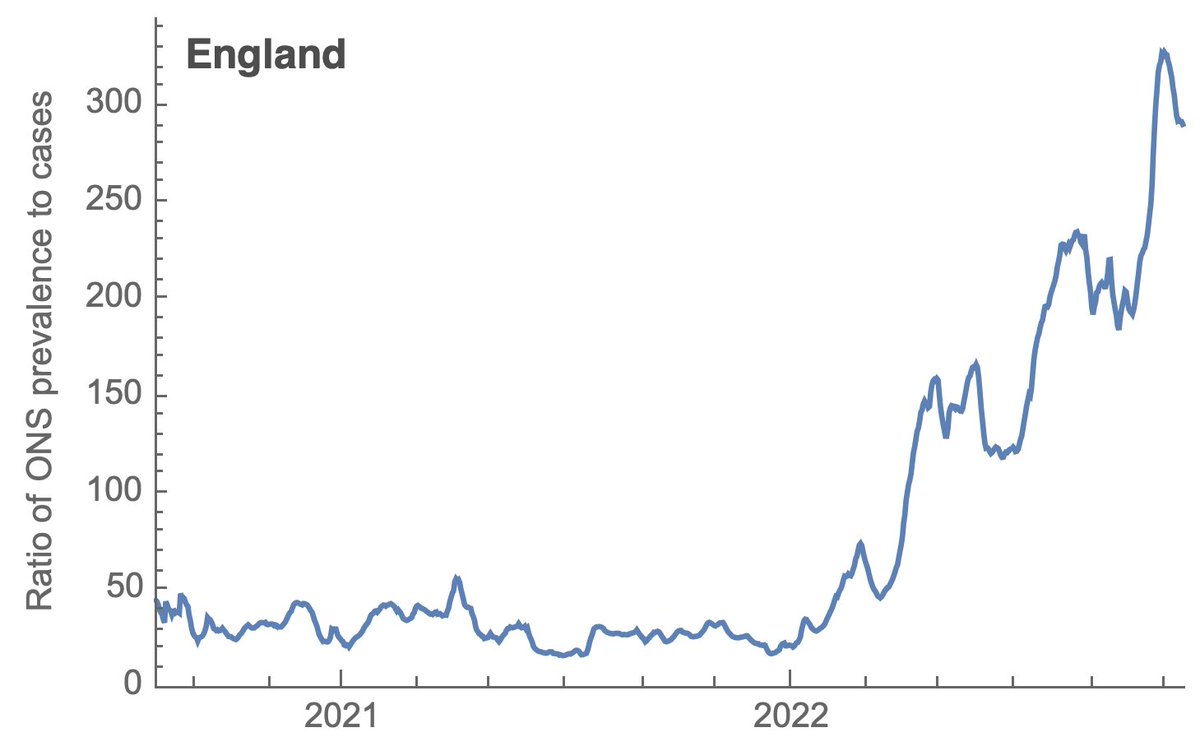
If we take a ratio of ONS prevalence to daily incidence, we get the following where the ratio is fairly constant at ~30-fold throughout 2020 and 2021, but increases sharply throughout 2022 and is now perhaps ~300-fold. 8/16
1
11
75
5 Dec 2022
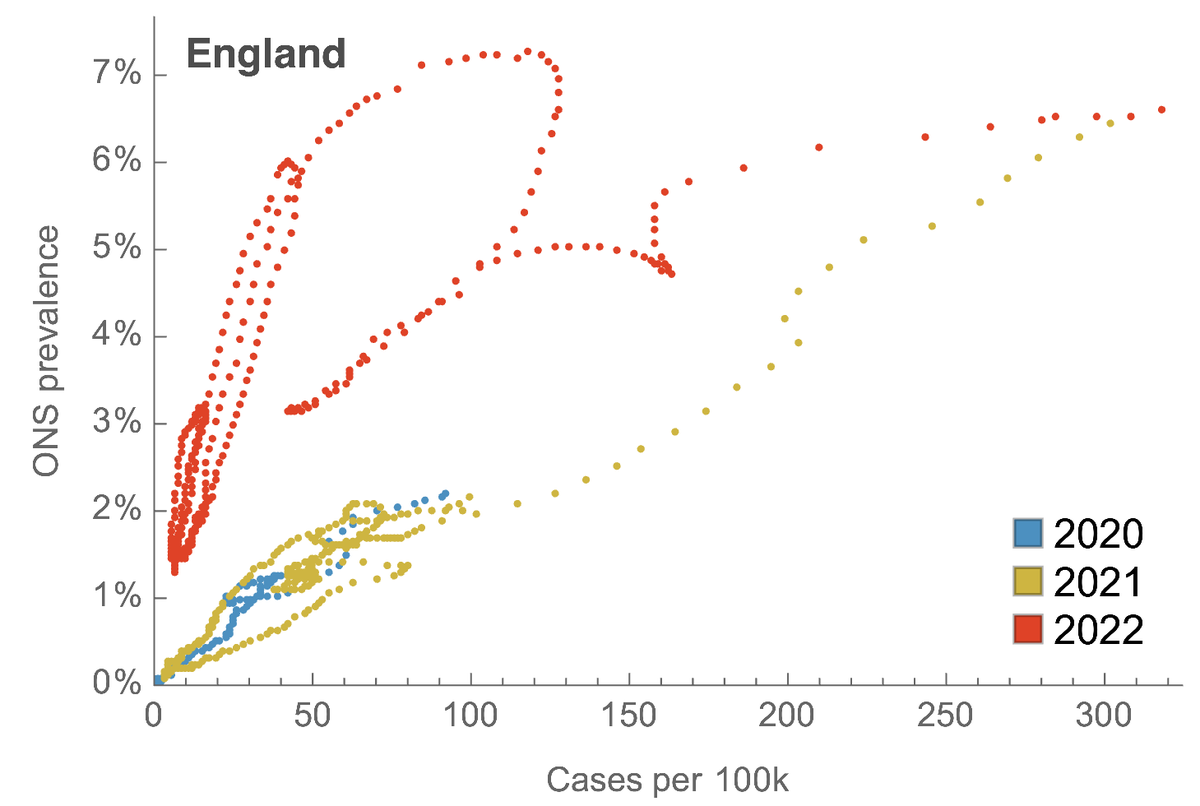
If we compare daily cases to prevalence we see an interesting result, where there is a consistent relationship in 2020 and most of 2021 (blue and yellow points), and a shift in 2022 to a steeper relationship where fewer cases correspond to greater prevalence (red points). 7/16
1
9
63
5 Dec 2022
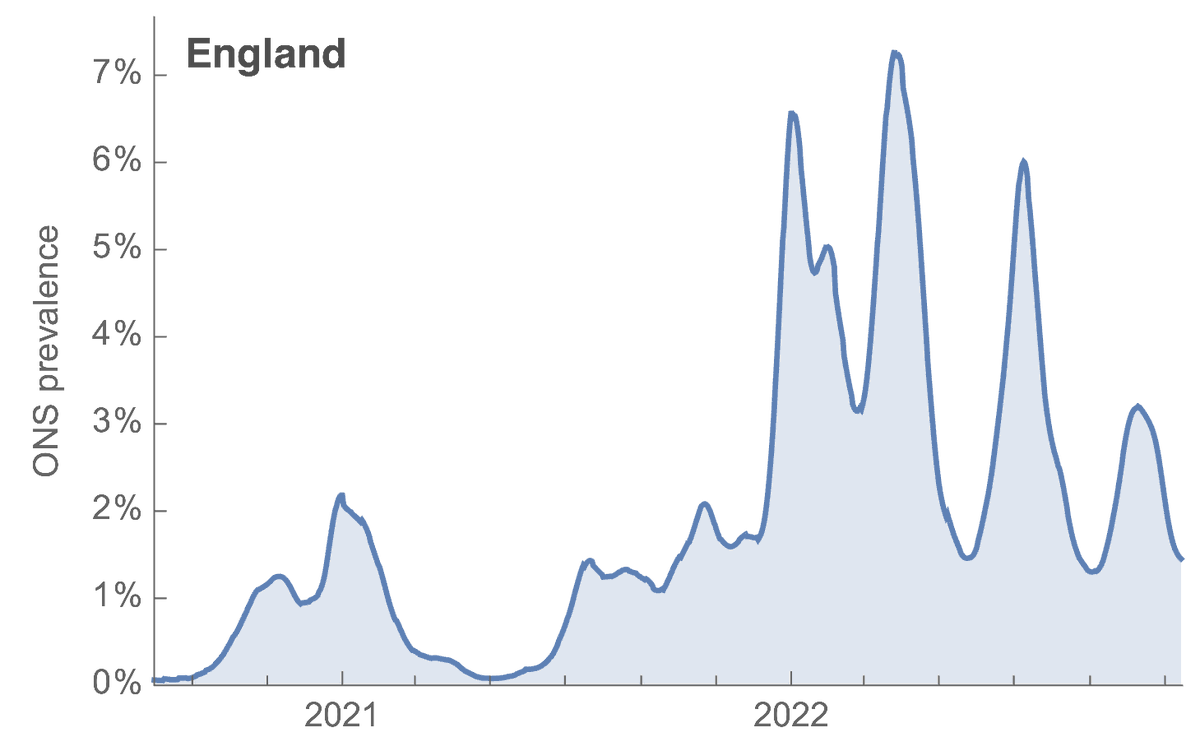
While here I'm showing estimated prevalence (proportion of individuals testing positive) from the @ONS infection survey (ons.gov.uk/peoplepopulationa…). The initial Omicron surge results in the most concurrent infections, but later waves in 2022 result in comparable prevalence. 6/16
1
7
66
5 Dec 2022
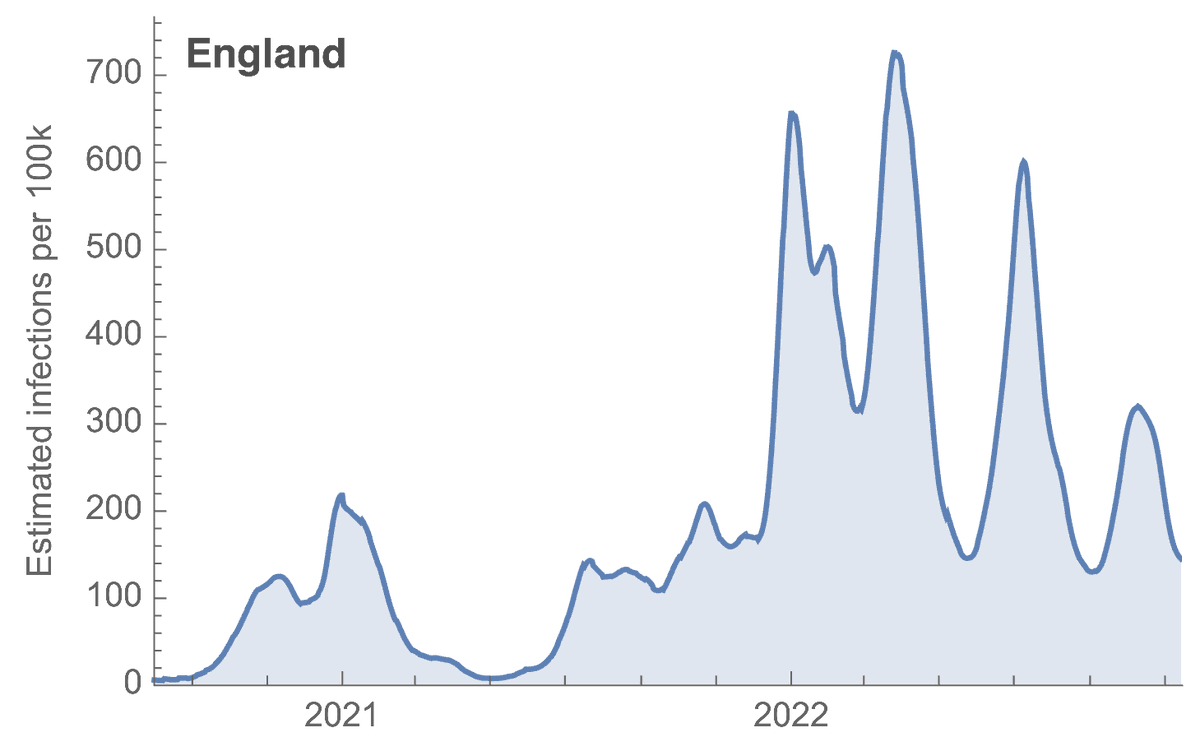
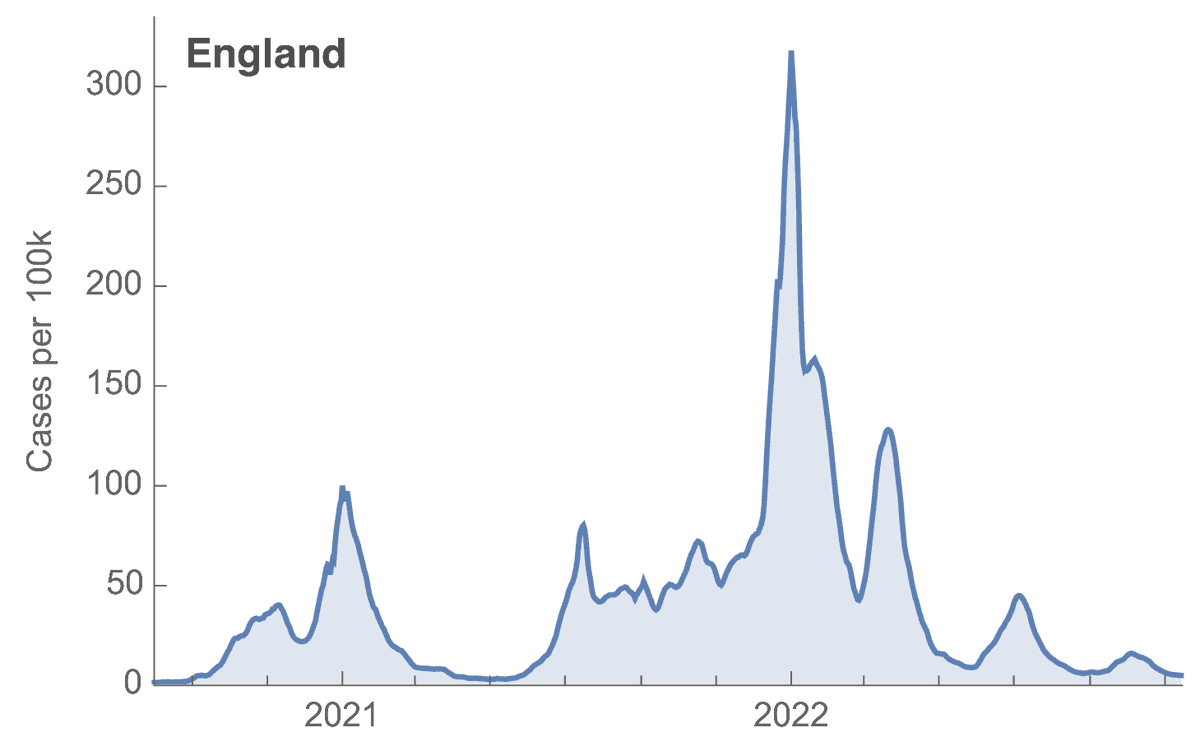
Here, I'm showing per capita case counts for England for Aug 2020 to Nov 15, 2022 using data from @UKHSA (coronavirus.data.gov.uk/deta…). The spike from the initial Omicron surge is quite evident and nothing in 2022 compares to this. 5/16
2
8
61
5 Dec 2022
Although there are things like wastewater surveillance in the US, I believe the gold standard to assess case detection rate is the @ONS infection survey (ons.gov.uk/peoplepopulationa…) that has continued to test swabs every week in the UK regardless of individual's symptom status. 4/16
1
9
92
5 Dec 2022
We're interested in the case detection rate or the ratio of underlying new infections compared to reported cases. Throughout much of 2020 and 2021, I had a working estimate of 1 infection in ~3.5 getting reported as a case. 3/16
x.com/trvrb/status/148061042…
10 Jan 2022

Historically, I have assumed that around 30% of infections in the US are reported as cases. This number was derived from seroprevalence and modeling estimates from sites like (no longer updated) covid19-projections.com. 3/15
1
7
65
5 Dec 2022
However, at this point, nearly all infections will be in individuals with prior immunity from vaccination or infection and this combined with a roll back in testing makes it unclear how to interpret current case counts compared to previous time periods. 2/16
2
11
112
26 Aug 2022
I was invited by @VandammeAm and other organizers of the #VEME2022 Virus Evolution and Molecular Epidemiology Workshop to present my perspective on applying pathogen phylogenetics for decision making. Slides from my talk are available here: bedford.io/talks/phylogeneti….
29
38
147
16 Aug 2022
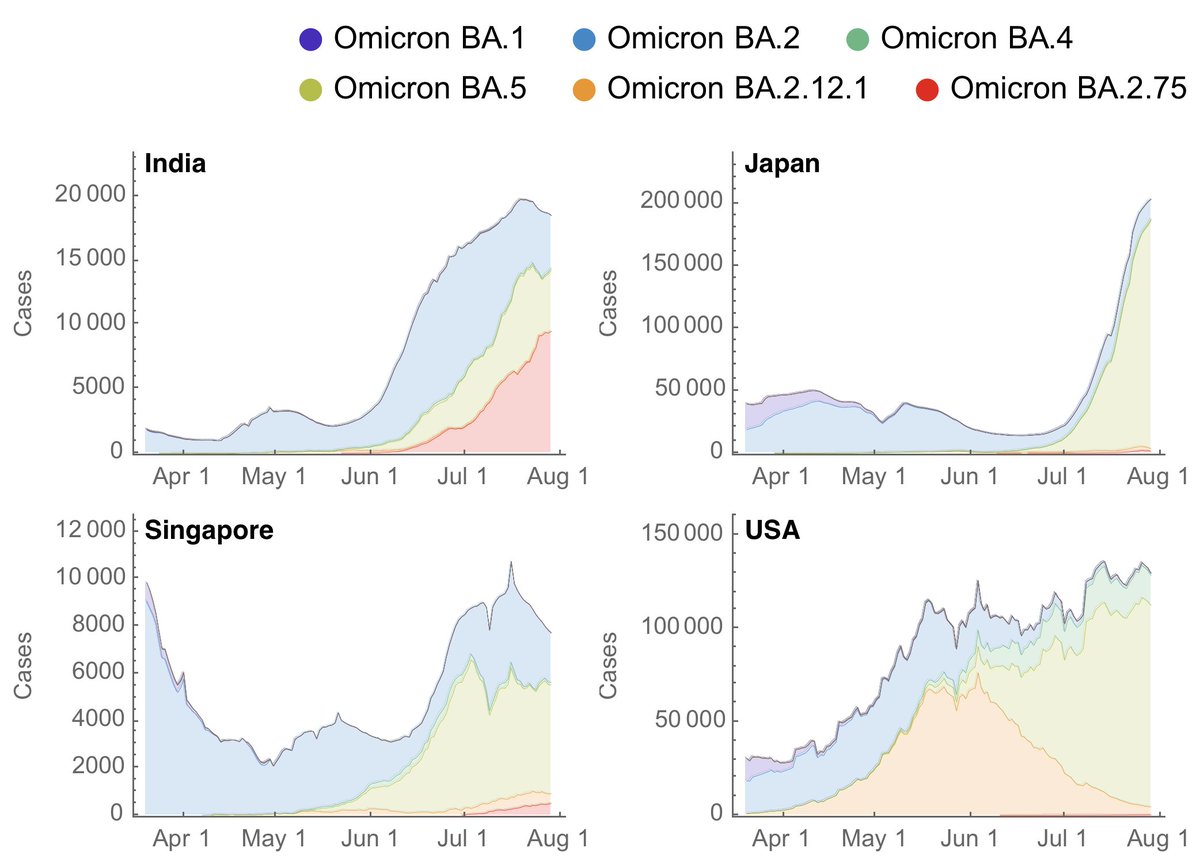
Largely through partial immune escape, lineage BA.5 viruses resulted in sizable epidemics throughout much of the world. However, in most countries these epidemics are now beginning to wind down. What do we expect after BA.5? 1/10
32
381
1,365
16 Aug 2022
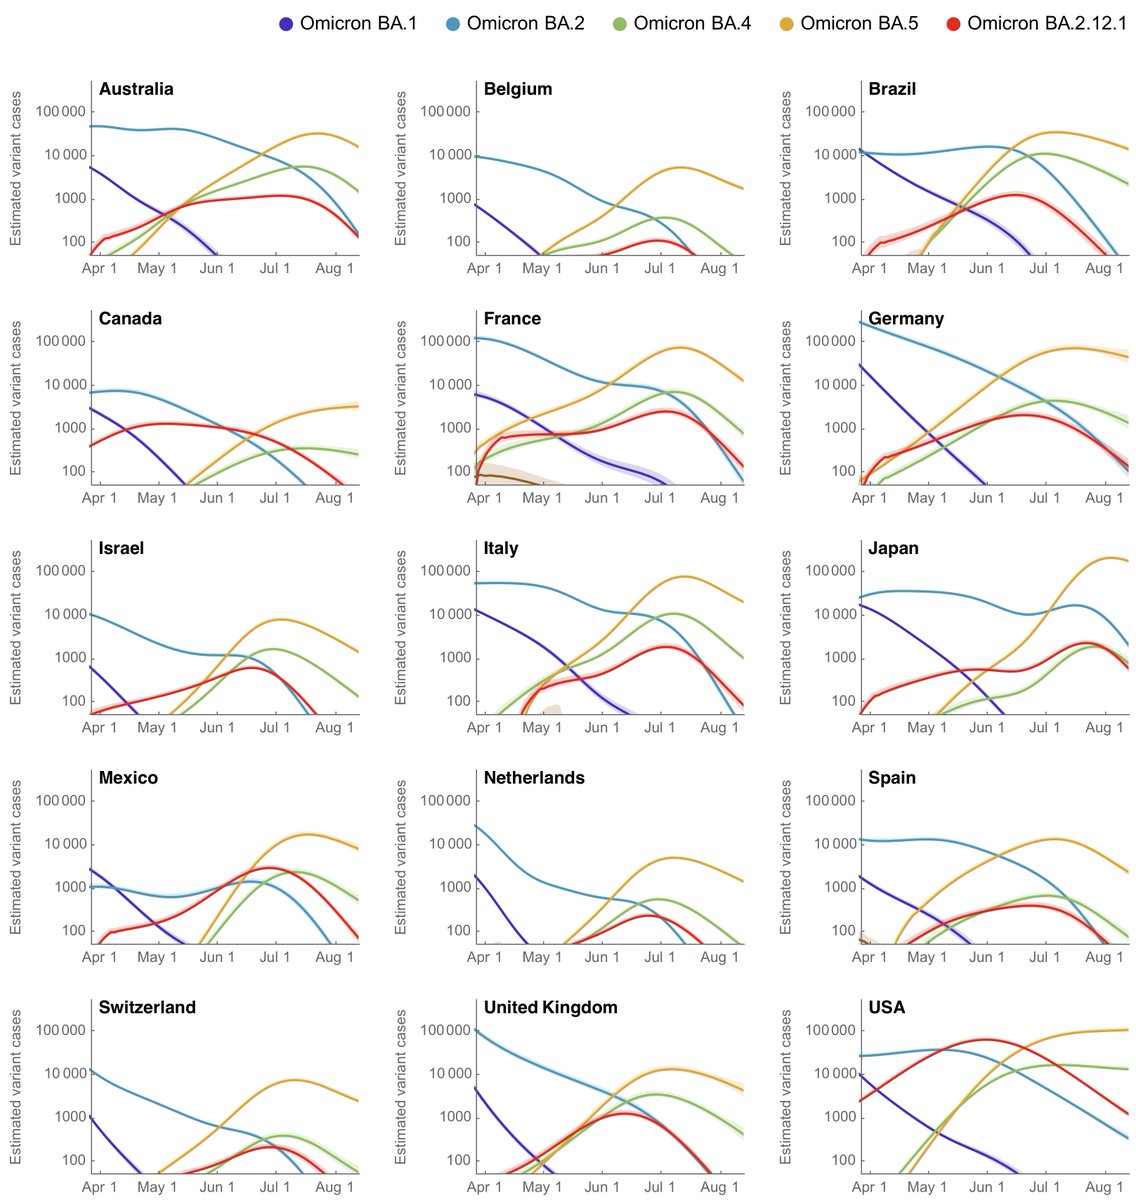
However, during these months there will likely emerge sub-lineages of BA.5 bearing additional mutations that make these viruses more competitive. And so the "winning" variant will be the one that happens to collect the right mutations and generate a highly fit subvariant. 9/10
11
36
320
16 Aug 2022
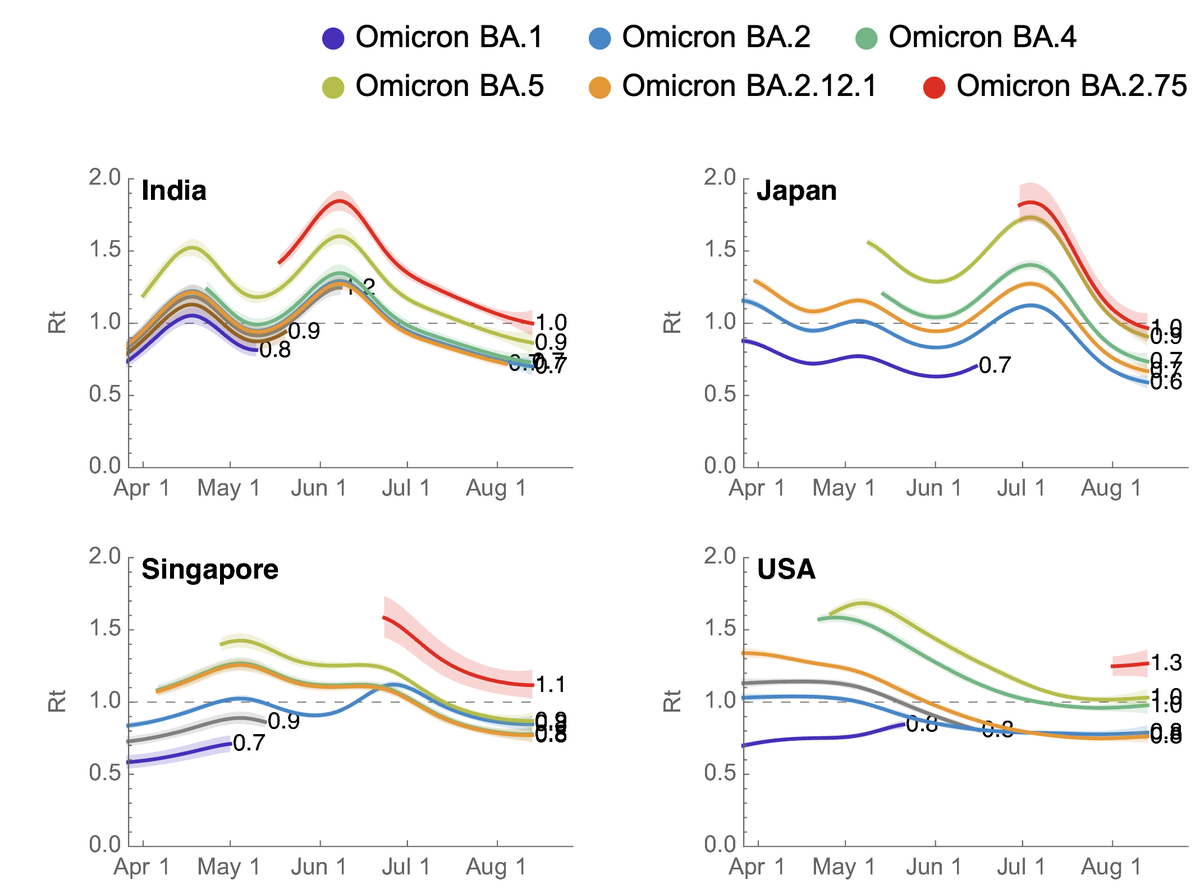
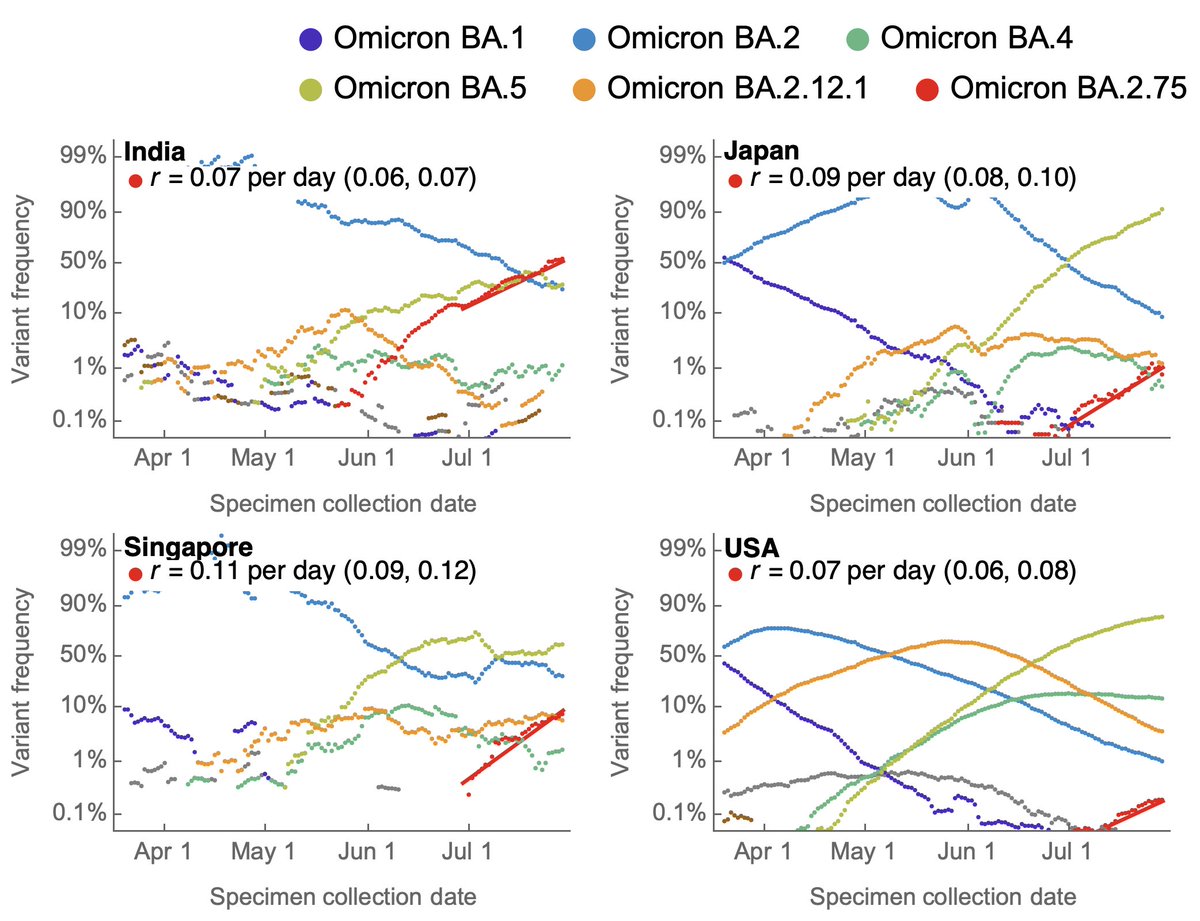
These analyses of BA.2.75 relied on open data sharing from scientists in India, Japan, Singapore and the US. We're still seeing remarkable evolution of SARS-CoV-2 with new variants emerging and spreading rapidly making continued global genomic surveillance essential. 10/10
15
61
489