
The design tool for content marketers. Make stunning graphics in minutes with Visage.
Joined February 2014
- Tweets 1,437
- Following 3,137
- Followers 3,262
- Likes 9,337
739 Photos and videos


Visage retweeted

6 Jun 2017
Great work by @sodaspeaks and @forrester on the new Global Digital Outlook. Report layout & charts by @visageco thesodareport.com/forecast/g…
1
4

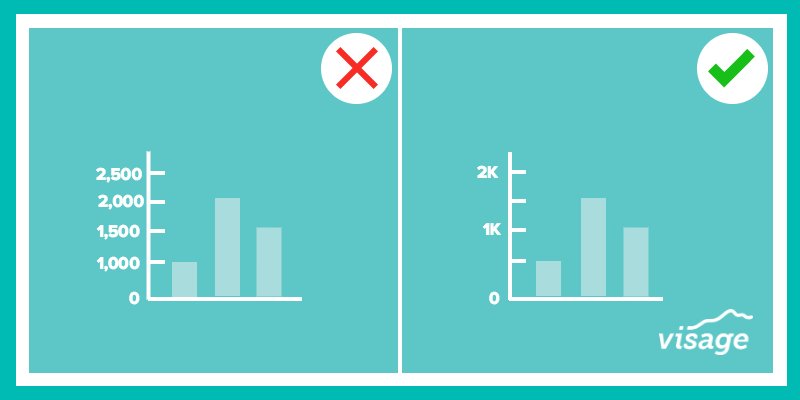
#Barcharts are supposed to help communicate your message, not complicate it. Keep it clear with these 12 tips visg.co/2dZ8ViD
1
Sometimes visualizing survey results can be harder than conducting the survey itself. These #designtips can help // visg.co/2eLnBFm
1
2
Conducting a survey is pointless if you can't communicate your findings. Follow these #designtips //visg.co/2eaPe8U
Just because a product is a bit boring doesn't mean the marketing for it has to be. //visg.co/2elkKi7
1
Sometimes visualizing survey results can be harder than conducting the survey itself. These #designtips can help // visg.co/2eaKkbU
1
1
Freeze! Your slide transitions are driving your audience crazy. Cut it out. // visg.co/2emoxg5
1
Conducting a survey is pointless if you can't communicate your findings. Follow these #designtips //visg.co/2eaOfpa
1
"Posts with visualizations receive 94% more page visits." // visg.co/2elgoYj
1
1
Leave it to @Kleenex to get you to use their product DURING their advert. Check out this gem and more >> visg.co/2ejaMzp
1
1
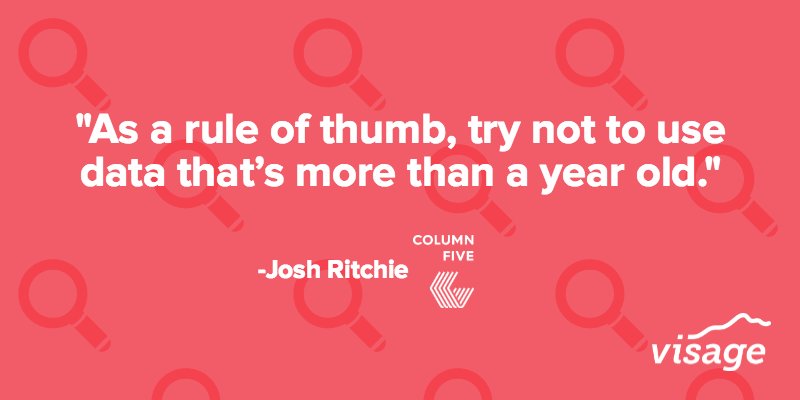
Awesome design but lacking data resources? We've got you. // visg.co/2cVRfV7
1
2
In a presentation, limit yourself to one idea per slide and avoid overwhelming your audience. // visg.co/2elhWl4
3
3
Data can communicate a lot—but only if your audience completely understands what they are looking at. // visg.co/2ej2Caf
1
2
#Datavisualization increases audience comprehension and retention // visg.co/2ej7OuX