
We're an environmental tech nonprofit that empowers all people, companies, policymakers, and countries to slash emissions and choose cleaner energy.
- Tweets 2,124
- Following 569
- Followers 2,178
- Likes 810


ALT A graphic has a background of a blue sky with white clouds. A text box shows a faux post from a WattTime social media account. The WattTime logo icon is in a circle to the left of the WattTime name and the handle @WattTime.org. The text says "stay up to date with the WattTime world by following us @WattTime.org" a logo for the social media app Bluesky is on the bottom of the graphic.


ALT A promotional graphic for SXSW 2025 featuring Laura Corso as a featured speaker. The design has a yellow and black color scheme with a circular headshot of Laura Corso at the top. Her title, "VP, Strategic Growth," is displayed below her name. The event details are listed: "Location Matters: Optimizing America’s Energy Transition," scheduled for Saturday, March 9, from 2:30 to 3:30 PM at the Hilton Austin, Downtown, Salon A. The SXSW 2025 logo is positioned at the bottom.
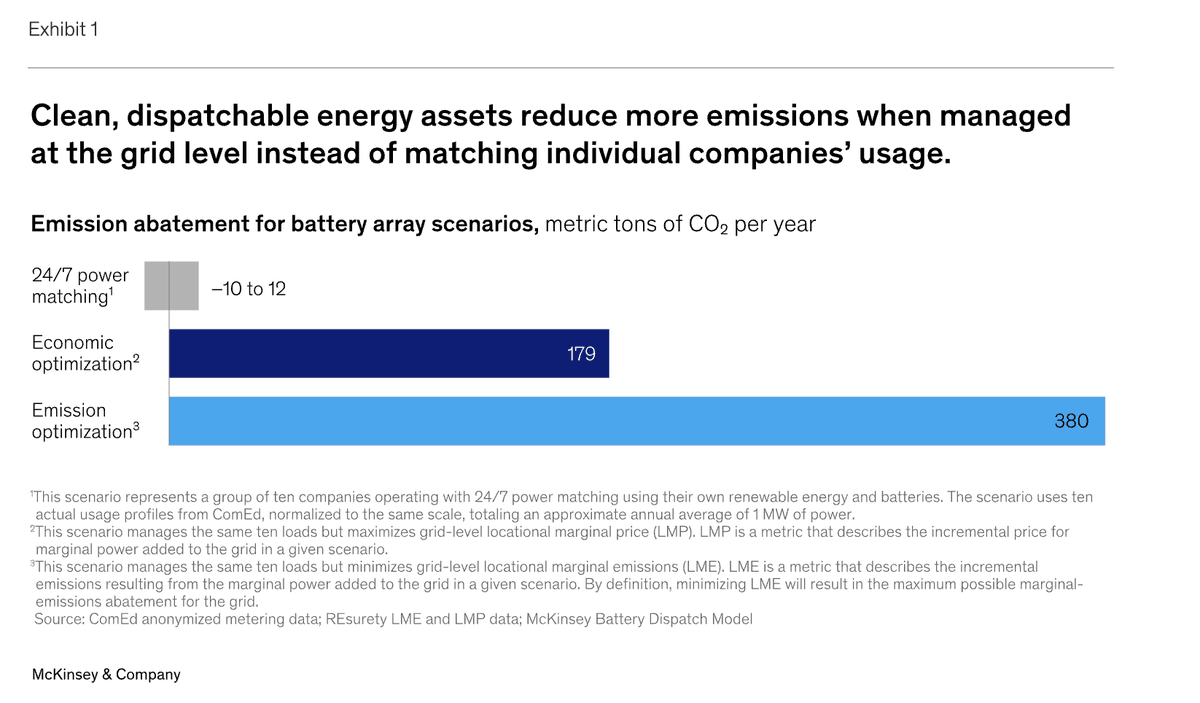
ALT A bar chart titled "Emission abatement for battery array scenarios, metric tons of CO₂ per year," comparing three battery management strategies: "24/7 power matching," "Economic optimization," and "Emission optimization." The "24/7 power matching" scenario has a small gray bar indicating emissions ranging from -10 to 12 metric tons. The "Economic optimization" scenario has a dark blue bar showing 179 metric tons of CO₂ abatement. The "Emission optimization" scenario has a light blue bar showing the highest abatement at 380 metric tons. The chart is sourced from ComEd anonymized metering data, REsurety LME and LMP data, and the McKinsey Battery Dispatch Model.
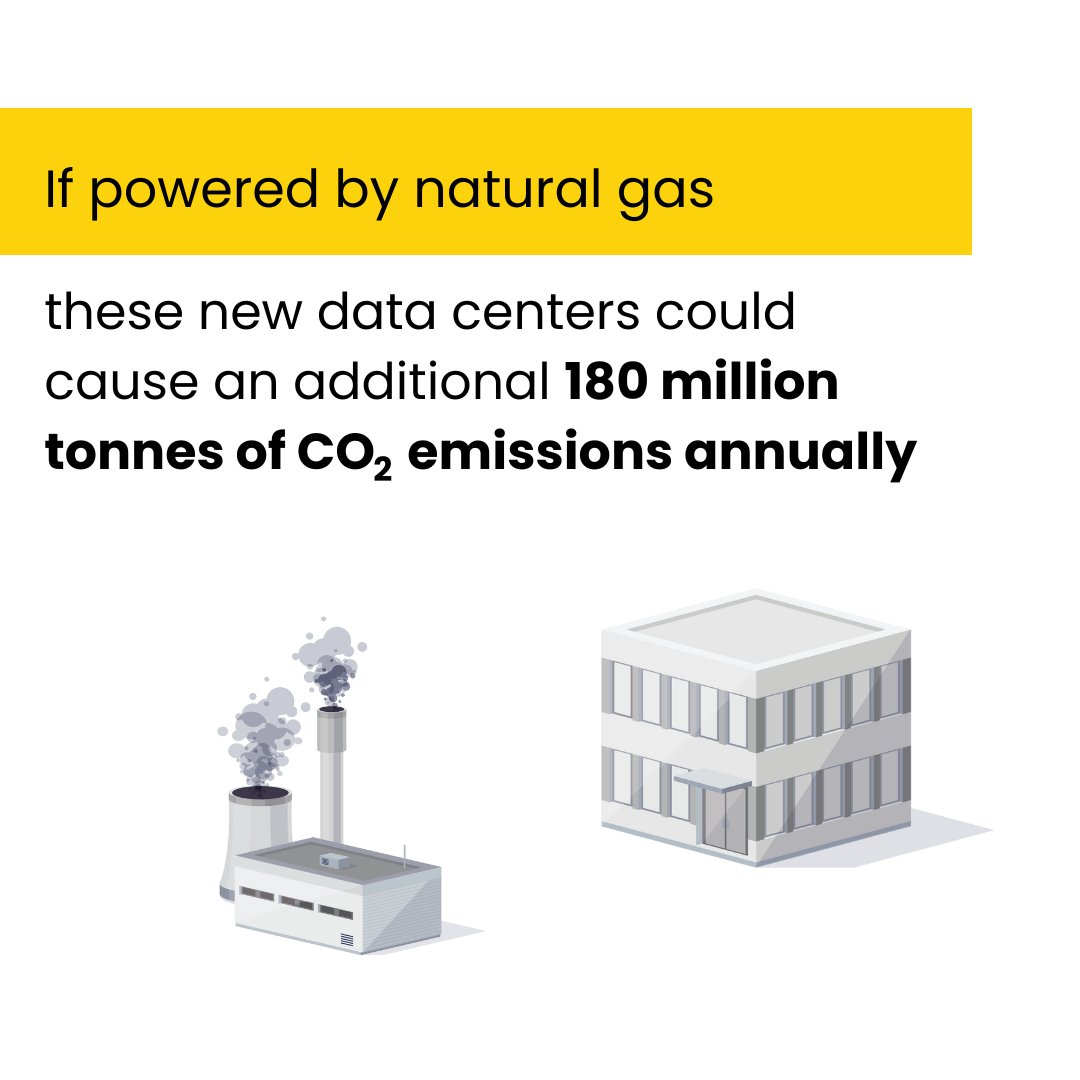
ALT A graphic featuring a factory with smokestacks emitting dark smoke and a modern data center building. Overlaid text reads: "If powered by natural gas, these new data centers could cause an additional 180 million tonnes of CO₂ emissions annually."
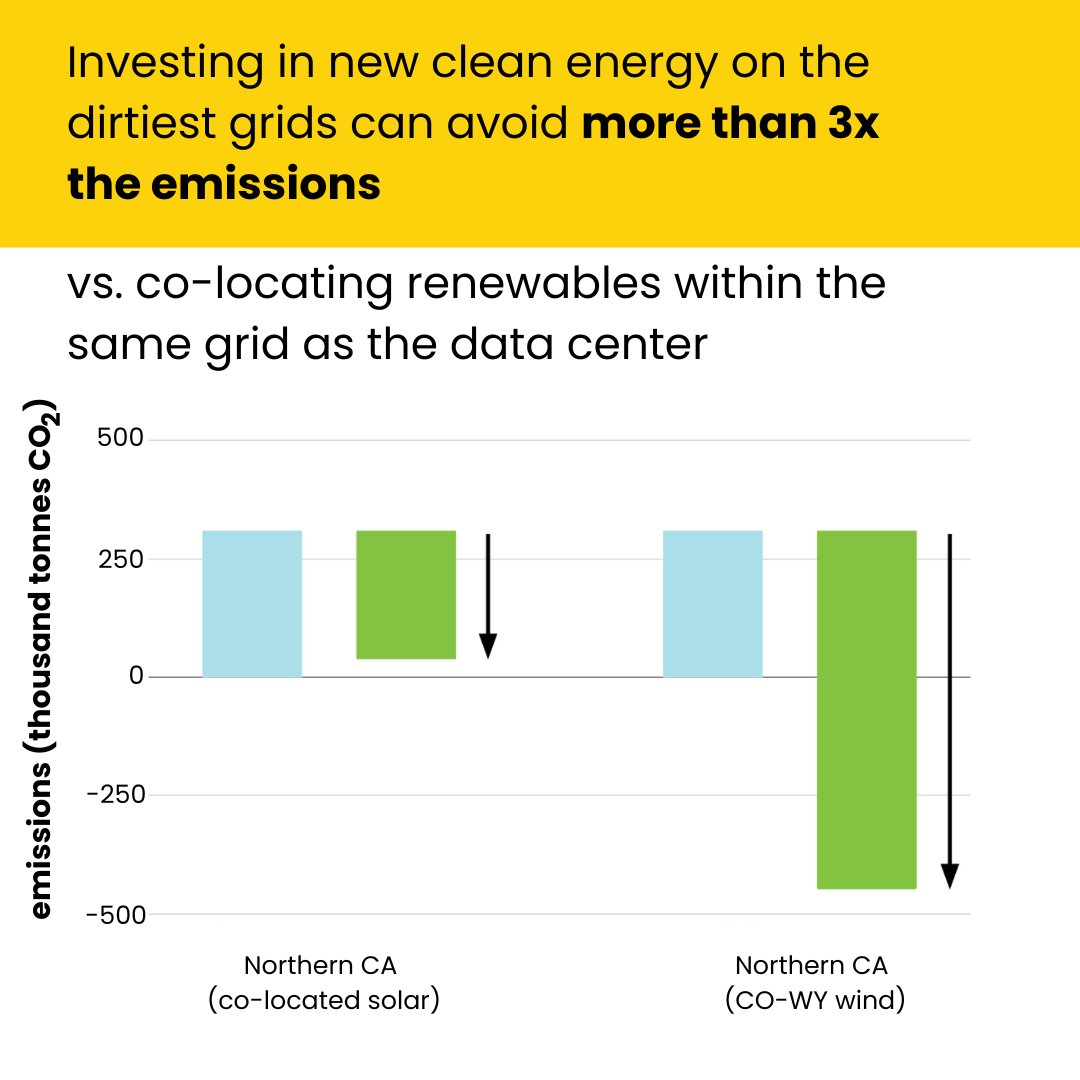
ALT A bar chart comparing CO₂ emissions from data centers in different grid regions. The CO-WY region has significantly higher emissions than Northern CA, with a label indicating "more than 2x the emissions." Overlaid text emphasizes the impact of building data centers on grids with LOWER marginal emissions rates.
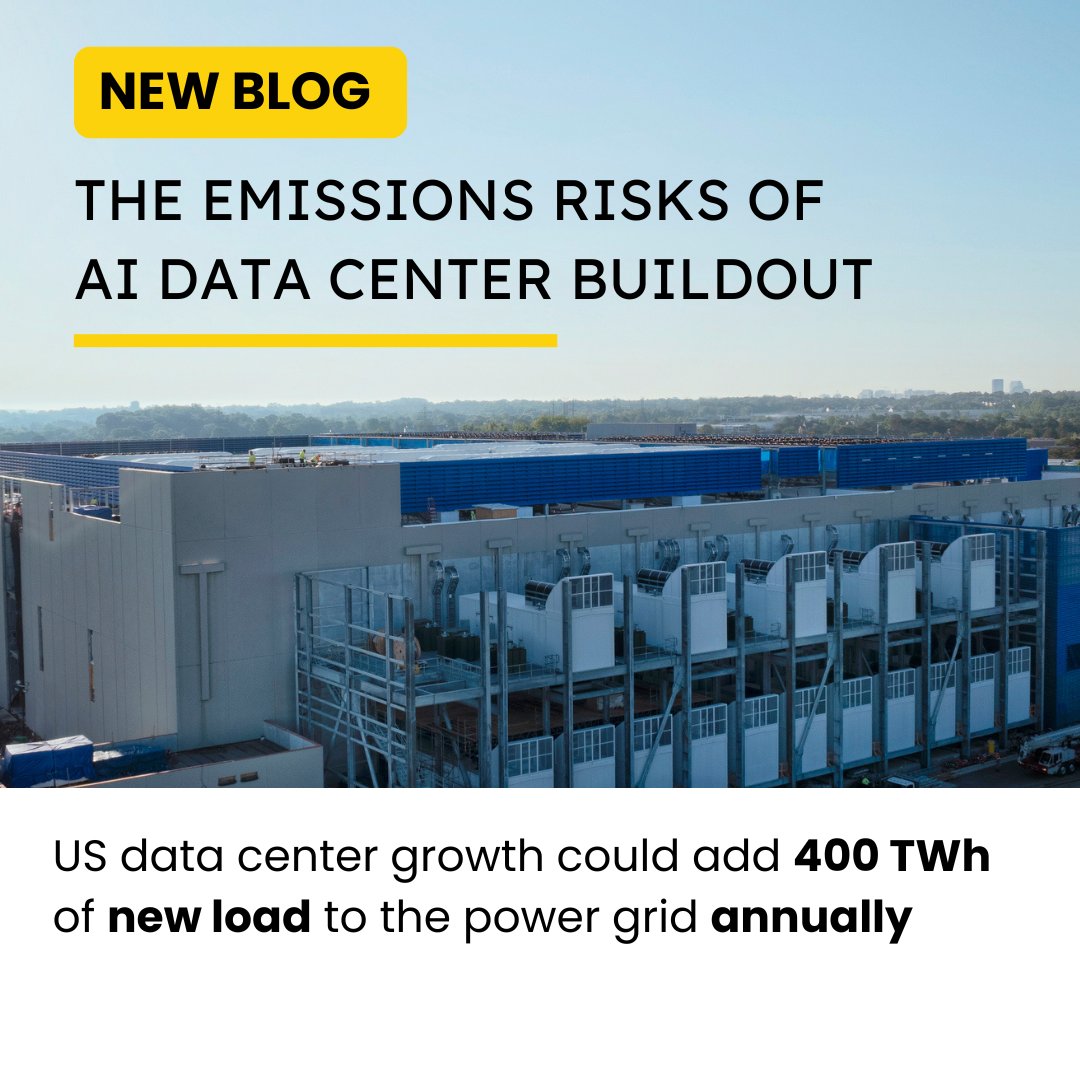
ALT A large data center with cooling infrastructure on its exterior. Overlaid text reads: "NEW BLOG - The Emissions Risks of AI Data Center Buildout." A subheading states, "US data center growth could add 400 TWh of new load to the power grid annually."
ALT A speaker graphic for GreenBiz25 has an Image of Eric Nguyen, Chief Product Officer at WattTiime. The featured session is titled "LEVERAGING AI FOR SUPPLY CHAIN DECARBONIZATION" and will take place on Monday, February 10th 9:30am-12:00pm

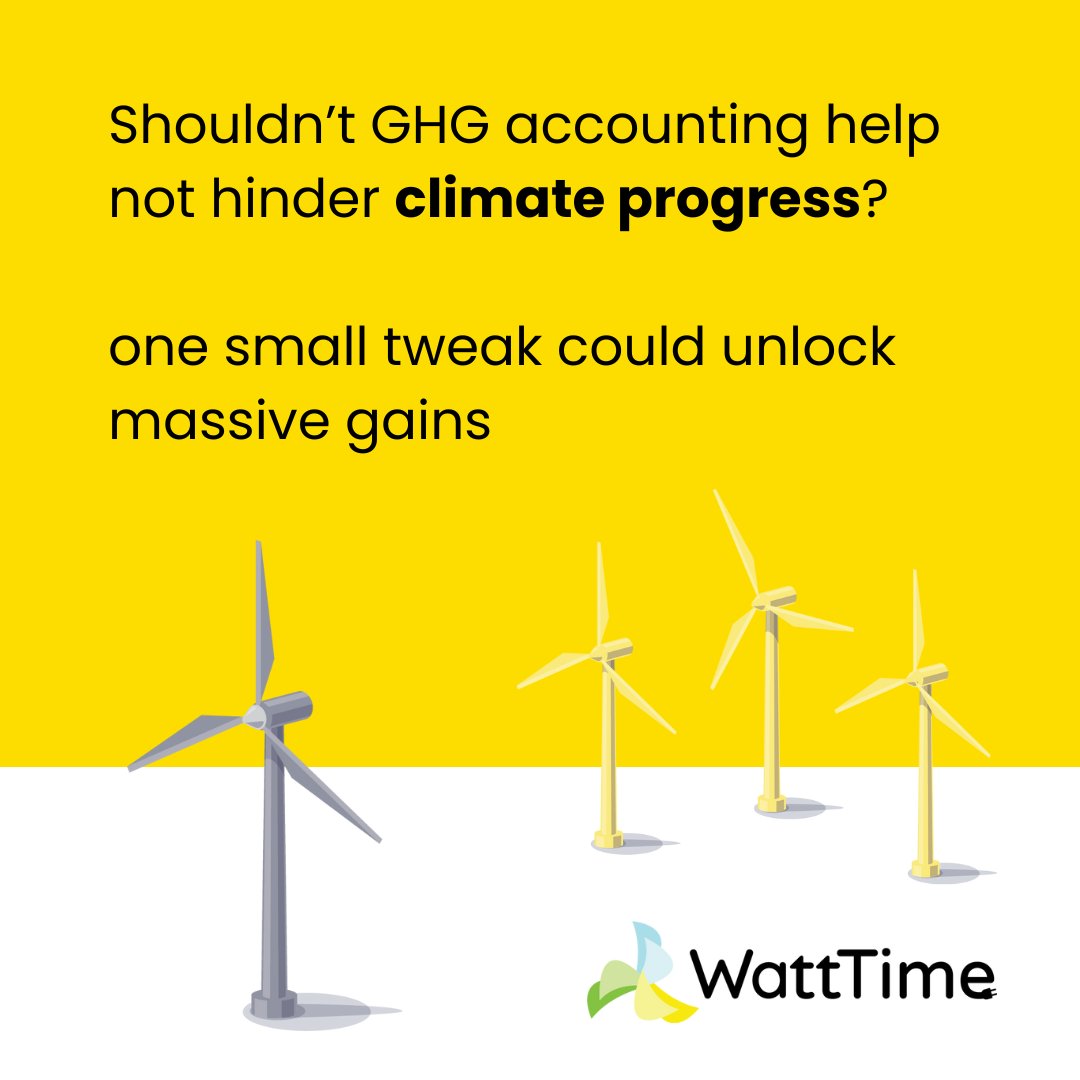
ALT A yellow and white graphic reads, "Shouldn't GHG accounting help not hinder climate progress? one small tweak could unlock massive gains." Images of wind mills in grey and yellow and a WattTime logo are below the text.