
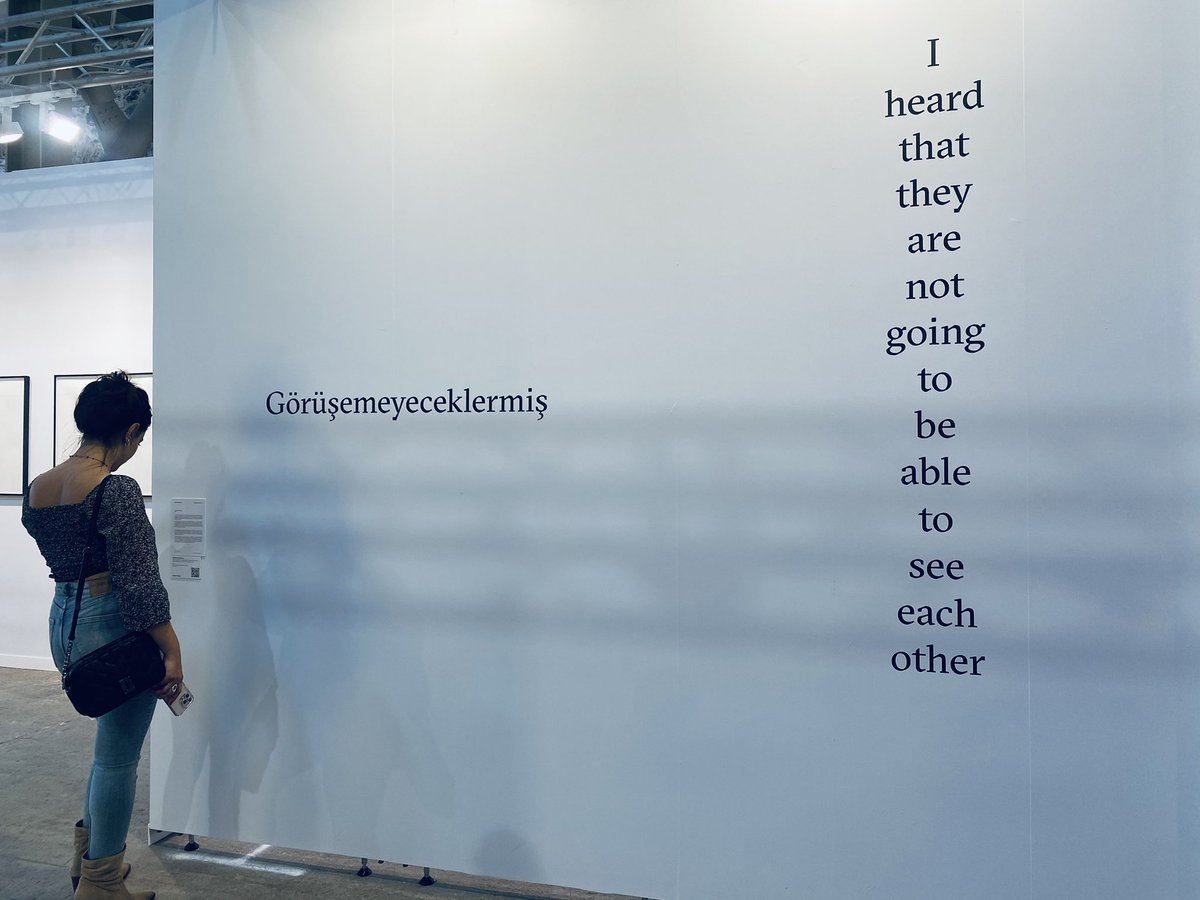
Endüstri Mühendisi, Yazılımcı, Bilgisayarcı, Gönüllü Grafikçi, @UniBogazici 81, @TEDAnkara 76
Joined June 2009
- Tweets 12,746
- Following 1,321
- Followers 33,858
- Likes 28,453
2,735 Photos and videos


Zeki Berk retweeted

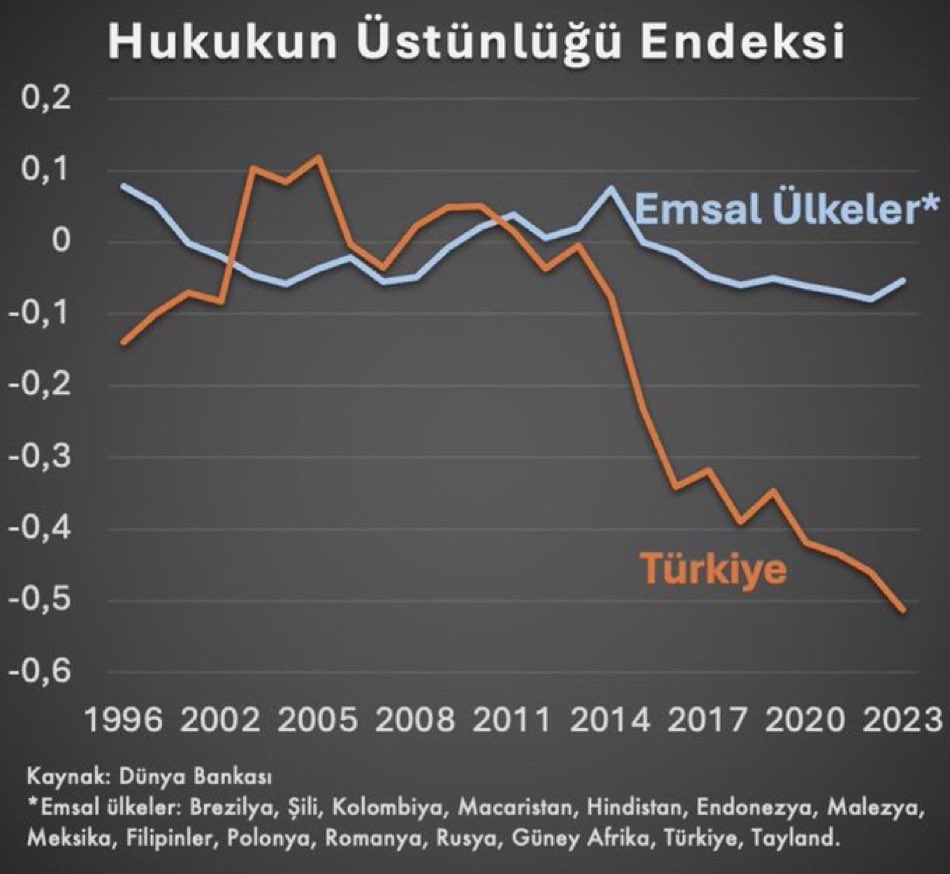
Bu arada gözden kaçmasın, Türkiye iktidar elitleri, dünyanın sonu geliyor, savaş çıkıyor yanlış tahliliyle ülkeyi çok uzun süre içinden çıkamayacağı iktisadi ve siyasal bir uçuruma ittiler. Devlet aklı dedikleri bu olsa gerek.
Hiç dünya borsalarına bakıyor musunuz bilmiyorum. Şu anda savaş değil, büyük bir genişleme fiyatlanıyor.
Yapay Zeka balonu olabilir tabii, ama 1-2 sene daha böyle devam ederse, Türkiye ve dünya arasındaki fark yeniden 19. yüzyıla geri dönecek. Yani kapanmayacak bir farka.
Askeri sanayi kompleksi sadece en güçlünün kazanabileceği, geri kalan herkesin kaybettiği bir sistemdir.
Türkiye son çeyrek asrını beton sanayi ve askeri sanayi kompleksleriyle harcadı. 1877'ye de geri döndü. 150 yıllık demokrasi deneyimi, sanayileşme hamlesi bir kere daha heba oldu.
10
39
218
19,258
Zeki Berk retweeted

Feb 1
Enflasyon-kur artışı makası açılmaya devam ediyor.
Bu durum, Türkiye’nin dünyaya göre giderek daha pahalı bir ülke olması anlamına geliyor.

120
406
2,628
151,982
Zeki Berk retweeted
Geçenlerde paylaşmıştım. Yann LeCun, Silikon Vadisi'ndeki firmaları bir tür uyarıyordu ve Çin'in yükselişine dikkat çekiyordu.
Tam da bunun üstüne Financial Times'ta bu yükselişin temel nedeni "dahi sınıfları"nı anlatan bir köşe yazısı yayımlandı. Henüz 2026'nın başında olsak da benim için şu ana kadar okuduğum en bilgilendiriciköşe yazılarından biri bu sene. O yüzden kısaca bahsetmek istiyorum, çünkü bu sistem öyle ya da böyle içinde bulunduğumuz teknoloji yarışının bir tür belirleyicisi.
Makalenin yazarı Zijing Wu da aslında bu "dahi sınıflarının" eski bir öğrencisi.
Sistem, ülkenin zeki çocuklarını henüz lise çağındayken tespit edip bilim, matematik ve teknoloji alanlarında uluslararası rekabete hazırlamayı amaçlıyor. Öğrenciler için bu sisteme girmenin en büyük motivasyonu ise Çin'in korkulan üniversiteye giriş sınavı Gaokao'yu atlayarak, doğrudan Tsinghua veya Pekin Üniversitesi gibi elit kurumlara yerleşme şansı elde etmek. Bu uğurda öğrenciler, normal lise müfredatının yanı sıra üniversite düzeyinde dersleri de kapsayan, tarih veya coğrafya gibi derslerden feragat edilen son derece ağır bir çalışma temposuna giriyorlar.
Bu sınıflardan mezun olanlar arasında TikTok, Alibaba, Meituan ve DeepSeek gibi şirketlerin kurucu ya da beyin takımından isimler var. Özellikle DeepSeek'in başarısı, bu sistemin yerli yetenek havuzunu nasıl efektif bir sonuca çevirdiğinin kanıtı olarak öne çıkıyor. Genç mühendisler, hiyerarşiden uzak ve kaynağın bol olduğu ortamlarda, tıpkı lise yıllarındaki bilim olimpiyatlarına hazırlanır gibi çalışarak, çok daha düşük maliyetlerle Amerika'da geliştirilen modellerle yarışmaya çalışıyorlar.
Fakat dediğim gibi, Zijing Wu bu dahi sınıfının eski bir öğrencisi ve kendi deneyiminden yola çıkarak bu sistemin yarattığı insani maliyete dikkat çekiyor. Edebiyata ilgi duymasına rağmen matematik yeteneği yüzünden bu sisteme dahil edilen Wu, sürecin öğrencilere ağır bir baskı ve sosyal izolasyon getirdiğini, ancak aynı zamanda onlara ömür boyu sürecek bir sorgulama ve akıl yürütme disiplini kazandırdığını söylüyor.
Yapay zekadaki yarış aslında Amerika'nın sermaye ve teknolojik altyapı gücü ile Çin'in kalifiye insan gücü arasındaki bir yarış gibi duruyor.

4
9
59
8,842
Zeki Berk retweeted

Jan 29
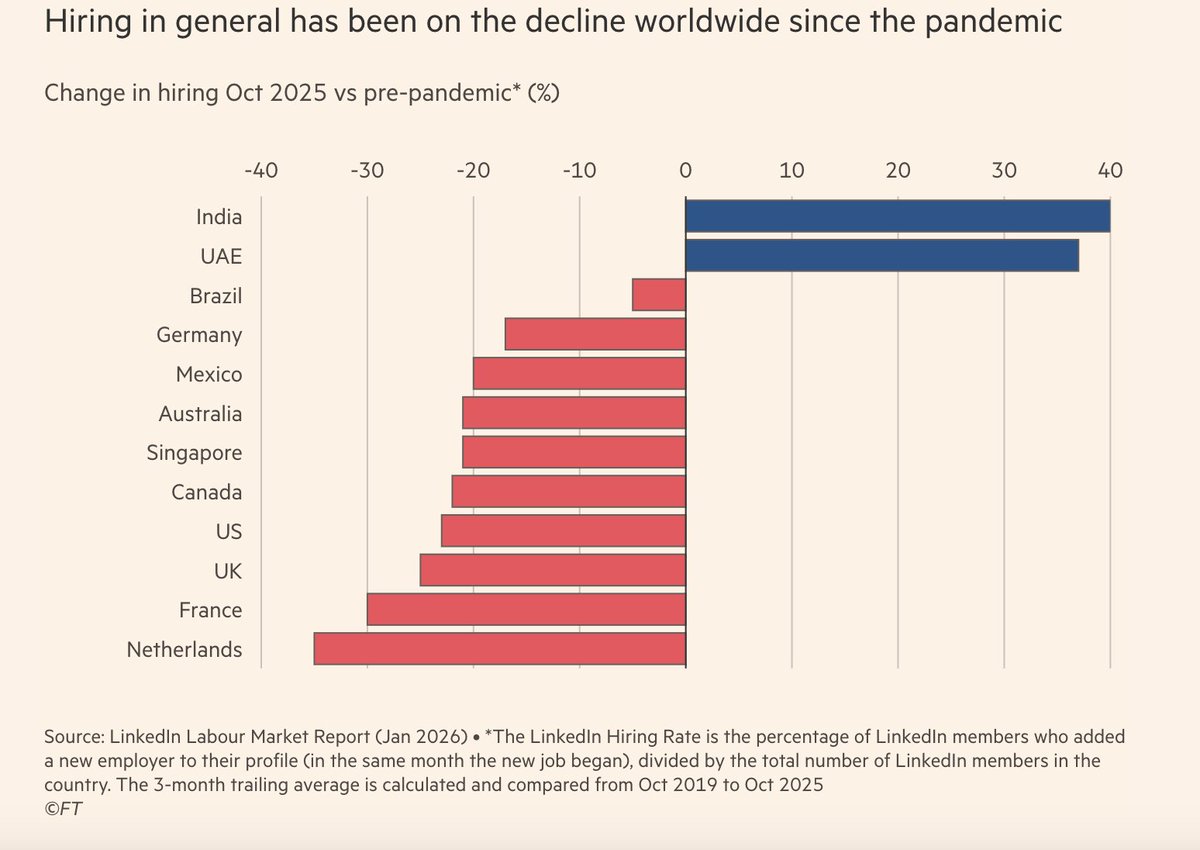
İş ilanlarının azalmasında yapay zekanın büyük payı var anlatısı ne kadar doğru, emin değilim.
Pandemi öncesine kıyasla, Hindistan ve BAE hariç, dünya genelinde işe alımlarda ortalama azalma var. Ancak asıl sebep yapay zekadan ziyade ekonomik belirsizlik.
Yapay zeka 2023-25 arasında yeni iş tanımları oluşturmuş ve bu pozisyonlara 1.3 milyondan fazla insan alınmış. Üstelik yapay zekanın etkilediği iş tanımları da oldukça kısıtlı.
Büyük şirketlerin yaptığı işten çıkarmaların ana sebebi çoğunlukla yapay zeka değil ama bunu öyle lanse etmek daha kolay geliyor.
4
7
69
10,924
Zeki Berk retweeted
Jan 18
Gelir düzeyi yüksek ülkeler yapay zekayı iş ve kişisel amaçlarla, gelişmekte olan ülkeler ise daha çok eğitim odaklı kullanıyor.
Antrophic’in raporuna göre yapay zeka karmaşık görevleri basit görevlere kıyasla 12 kat hızlandırıyor, ancak işlerin niteliğinin düşmesi riskini de beraberinde getiriyor. Güzel rapor. Bağlantıyı aşağıya bırakıyorum.
3
3
31
5,128
Zeki Berk retweeted

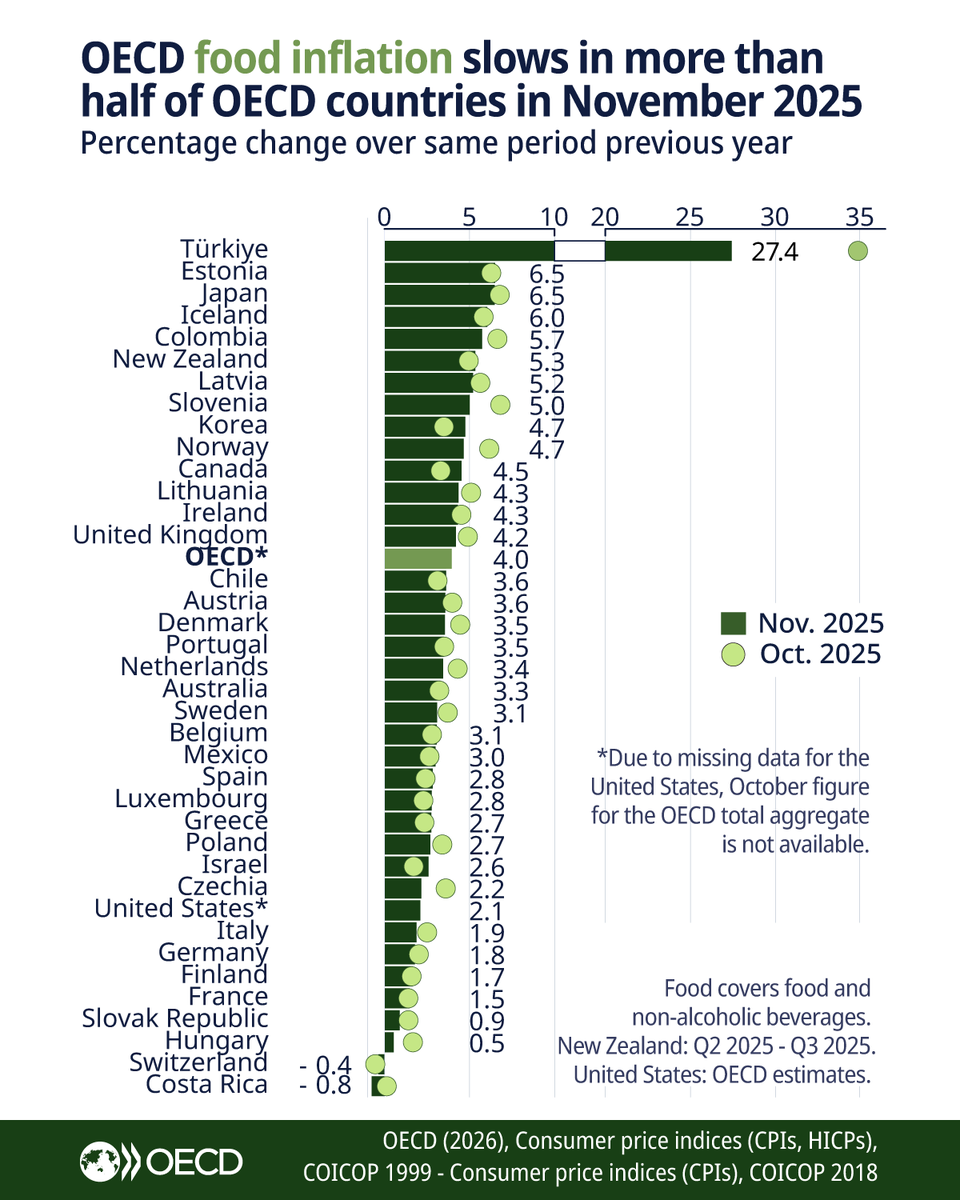
Over half of OECD countries saw a slowdown of food inflation in November 2025.
Food inflation remained broadly stable in France in November but fell in Italy, the UK, Germany & Japan. Conversely, food inflation in Canada jumped to 4.5%.
🔗 brnw.ch/21wZ54Z | #OECDstats
1
11
33
3,905

Zeki Berk retweeted

25 Dec 2025
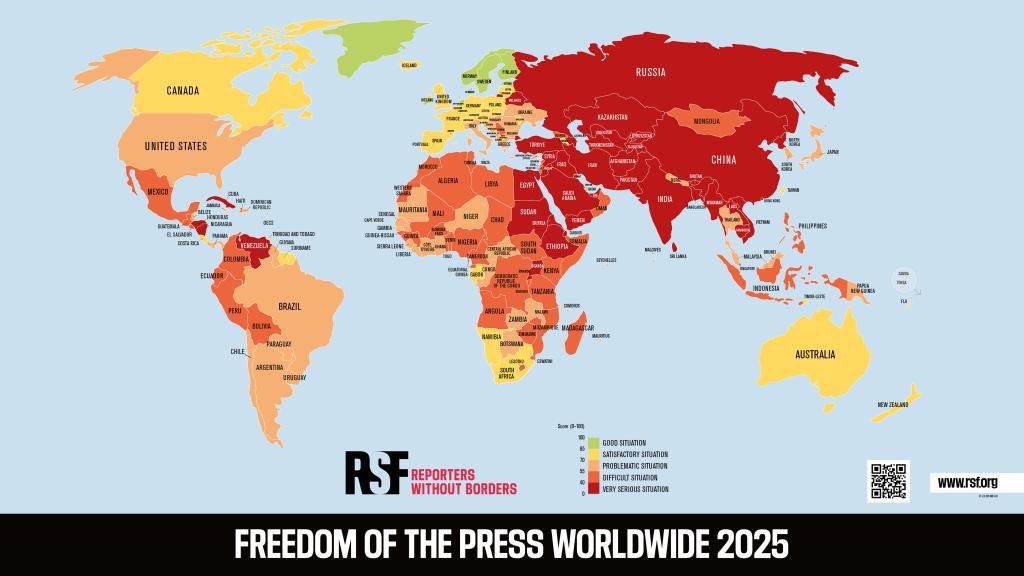
Freedom of the Press Worldwide 2025
1. Norway🇳🇴
2. Estonia🇪🇪
3. Netherlands🇳🇱
4. Sweden🇸🇪
5. Finland🇫🇮
6. Denmark🇩🇰
7. Ireland🇮🇪
8. Portugal🇵🇹
9. Switzerland🇨🇭
10. Czechia🇨🇿
11. Germany🇩🇪
12. Liechtenstein🇱🇮
13. Luxembourg🇱🇺
14. Lithuania🇱🇹
15. Latvia🇱🇻
16. New Zealand🇳🇿
17. Iceland🇮🇸
18. Belgium🇧🇪
19. Trinidad and Tobago🇹🇹
20. United Kingdom🇬🇧
21. Canada🇨🇦
22. Austria🇦🇹
23. Spain🇪🇸
24. Taiwan🇹🇼
25. France🇫🇷
26. Jamaica🇯🇲
27. South Africa🇿🇦
28. Namibia🇳🇦
29. Australia🇦🇺
30. Cabo Verde🇨🇻
31. Poland🇵🇱
32. Suriname🇸🇷
33. Slovenia🇸🇮
34. Armenia🇦🇲
35. Moldova🇲🇩
36. Costa Rica🇨🇷
37. Montenegro🇲🇪
38. Slovakia🇸🇰
39. Timor-Leste🇹🇱
40. Fiji🇫🇯
41. Gabon🇬🇦
42. North Macedonia🇲🇰
43. Dominican Republic🇩🇴
44. Samoa🇼🇸
45. Seychelles🇸🇨
46. Tonga🇹🇴
47. Belize🇧🇿
48. OECS
49. Italy🇮🇹
50. Mauritania🇲🇷
51. Mauritius🇲🇺
52. Ghana🇬🇭
53. Panama🇵🇦
54. Liberia🇱🇷
55. Romania🇷🇴
56. Sierra Leone🇸🇱
57. United States🇺🇸
58. Gambia🇬🇲
59. Uruguay🇺🇾
60. Croatia🇭🇷
61. South Korea🇰🇷
62. Ukraine🇺🇦
63. Brazil🇧🇷
64. Ivory Coast🇨🇮
65. Andorra🇦🇩
66. Japan🇯🇵
67. Malta🇲🇹
68. Hungary🇭🇺
69. Chile🇨🇱
70. Bulgaria🇧🇬
71. Congo-Brazzaville🇨🇬
72. Central African Republic🇨🇫
73. Guyana🇬🇾
74. Senegal🇸🇳
75. Comoros🇰🇲
76. Malawi🇲🇼
77. Cyprus🇨🇾
78. Papua New Guinea🇵🇬
79. Qatar🇶🇦
80. Albania🇦🇱
81. Botswana🇧🇼
82. Zambia🇿🇲
83. Niger🇳🇪
84. Paraguay🇵🇾
85. Thailand🇹🇭
86. Bosnia Herzegovina🇧🇦
87. Argentina🇦🇷
88. Malaysia🇲🇾
89. Greece🇬🇷
90. Nepal🇳🇵
91. Northern Cyprus
92. Benin🇧🇯
93. Bolivia🇧🇴
94. Ecuador🇪🇨
95. Tanzania🇹🇿
96. Serbia🇷🇸
97. Brunei🇧🇳
98. Eswatini🇸🇿
99. Kosovo🇽🇰
100. Angola🇦🇴
101. Mozambique🇲🇿
102. Mongolia🇲🇳
103. Guinea🇬🇳
104. Maldives🇲🇻
105. Burkina Faso🇧🇫
106. Zimbabwe🇿🇼
107. Lesotho🇱🇸
108. Chad🇹🇩
109. South Sudan🇸🇸
110. Guinea Bissau🇬🇼
111. Haiti🇭🇹
112. Israel🇮🇱
113. Madagascar🇲🇬
114. Georgia🇬🇪
115. Colombia🇨🇴
116. Philippines🇵🇭
117. Kenya🇰🇪
118. Equatorial Guinea🇬🇶
119. Mali🇲🇱
120. Morocco🇲🇦
121. Togo🇹🇬
122. Nigeria🇳🇬
123. Singapore🇸🇬
124. Mexico🇲🇽
125. Burundi🇧🇮
126. Algeria🇩🇿
127. Indonesia🇮🇩
128. Kuwait🇰🇼
129. Tunisia🇹🇳
130. Peru🇵🇪
131. Cameroon🇨🇲
132. Lebanon🇱🇧
133. Democratic Rep. of Congo🇨🇩
134. Oman🇴🇲
135. El Salvador🇸🇻
136. Somalia🇸🇴
137. Libya🇱🇾
138. Guatemala🇬🇹
139. Sri Lanka🇱🇰
140. Hong Kong🇭🇰
141. Kazakhstan🇰🇿
142. Honduras🇭🇳
143. Uganda🇺🇬
144. Kyrgyzstan🇰🇬
145. Ethiopia🇪🇹
146. Rwanda🇷🇼
147. Jordan🇯🇴
148. Uzbekistan🇺🇿
149. Bangladesh🇧🇩
150. Laos🇱🇦
151. India🇮🇳
152. Bhutan🇧🇹
153. Tajikistan🇹🇯
154. Yemen🇾🇪
155. Iraq🇮🇶
156. Sudan🇸🇩
157. Bahrain🇧🇭
158. Pakistan🇵🇰
159. Türkiye🇹🇷
160. Venezuela🇻🇪
161. Cambodia🇰🇭
162. Saudi Arabia🇸🇦
163. Palestine🇵🇸
164. UAE🇦🇪
165. Cuba🇨🇺
166. Belarus🇧🇾
167. Azerbaijan🇦🇿
168. Djibouti🇩🇯
169. Myanmar🇲🇲
170. Egypt🇪🇬
171. Russia🇷🇺
172. Nicaragua🇳🇮
173. Vietnam🇻🇳
174. Turkmenistan🇹🇲
175. Afghanistan🇦🇫
176. Iran🇮🇷
177. Syria🇸🇾
178. China🇨🇳
179. North Korea🇰🇵
180. Eritrea🇪🇷
@RSF_inter
713
910
2,559
1,234,135
Zeki Berk retweeted
27 Sep 2025
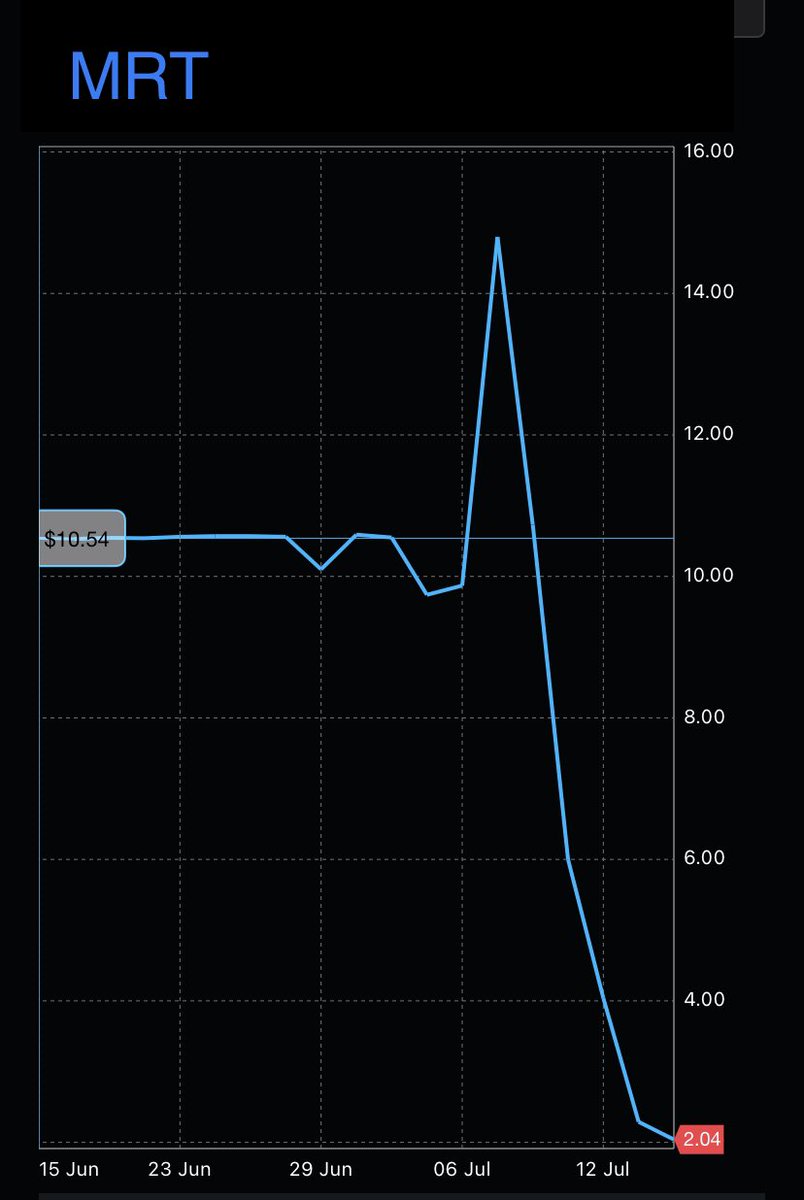
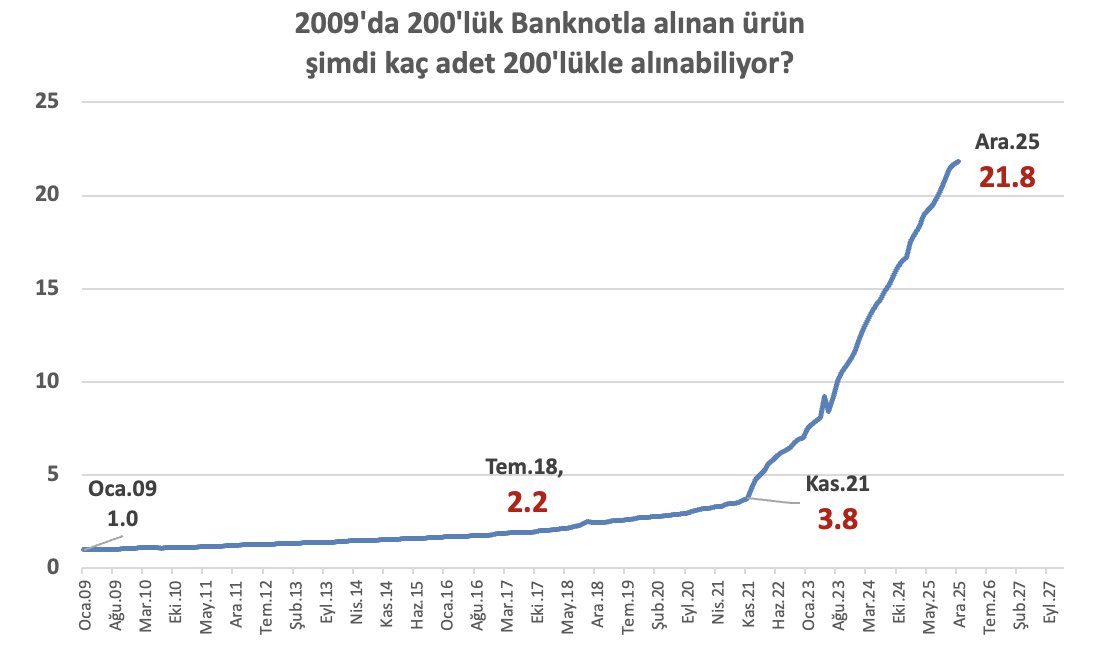
Yıl sonunda asgari ücretin açlık sınırının 6 altına düşeceğini tahmin ediyorum.
(Biraz önce paylaştığım grafikte bir formül hatası yapmışım, yeniden hesapladım, özür dilerim).

65
172
1,519
95,377
Zeki Berk retweeted
7 Sep 2025
Dibin de dibi varmış..
289
2,112
12,923
602,605
Zeki Berk retweeted
10 Aug 2025
Google'ın deprem uyarı sistemi nasıl çalışıyor?
2 Jun 2025

Depremle ilgili atılan twitlere bakayım dedim ve çoğunlukla Google’ın uyarı sisteminin birkaç saniye önce uyarı verdiğini yazmış insanlar. Kısaca bu sistemin nasıl çalıştığını anlatayım.
Google'nin deprem uyarı sistemi , dünya genelinde kullanılan 2 milyardan fazla Android telefonun dahili ivmeölçerlerini kullanarak çalışıyor. Bu telefonlardaki akselerometre sensörleri yer titreşimlerini algıladığında, deprem şüphesi durumunda konum ve titreşim verilerini Google'ın sunucularına gönderiyor.
Google'ın sunucuları, milyonlarca telefondan aynı anda gelen bu verileri birleştiriyor ve makine öğrenmesi algoritmaları kullanarak depremin yerini, büyüklüğünü ve yoğunluğunu belirliyor. Sistem, birden fazla telefondan gelen tutarlı verileri analiz ederek gerçek depremlerle sahte alarmları ayırt edebiliyor.
Potansiyel bir deprem algılandığında ve büyüklüğü 4.5'in üzerindeyse, sistem etkilenen bölgedeki Android kullanıcılarına hafif sarsıntılar için dikkat et, şiddetli sarsıntılar için de harekete geç uyarısını gönderiyor.
Tekrar herkese çok geçmiş olsun. #google #deprem
1
2
18
4,609
Zeki Berk retweeted

31 Jul 2025
How does the risk of death change as we age?
After the first year of life, death rates continue to decline through childhood.
This chart visualizes annual death rates across age groups, using national data from the United States, which covers all births registered between 2018 and 2021.
The chart uses a log scale, which shows that the risk reduction during childhood is very dramatic. For example, during these years, a ten-year-old child’s risk of dying was almost fifty times lower than an infant’s.
In adolescence, however, death rates rise again suddenly, which looks like a hump.
As you can see, this is mainly due to a rise in deaths from external causes (shown in orange), which include accidents, falls, overdoses, poisonings, violence, suicides, and other injuries. Deaths from these causes then remain roughly stable until old age.
Research shows that the precise shape and timing of the hump varies between countries and changes over time. However, the total death rate continues to rise across adulthood due to increased deaths from diseases.
You can see that the rise becomes exponential — for example, 80-year-olds are around ten times more likely to die than 60-year-olds.
As we age, our cells get damaged by injury, stress, and DNA mutations. Because of this, our organs deteriorate. This makes us more vulnerable to additional damage, and our body becomes less able to repair itself.
Research suggests that this leads to an exponentially growing risk of developing many diseases — including cancers, cardiovascular diseases, infectious diseases, dementias, and others — which increase death rates overall.
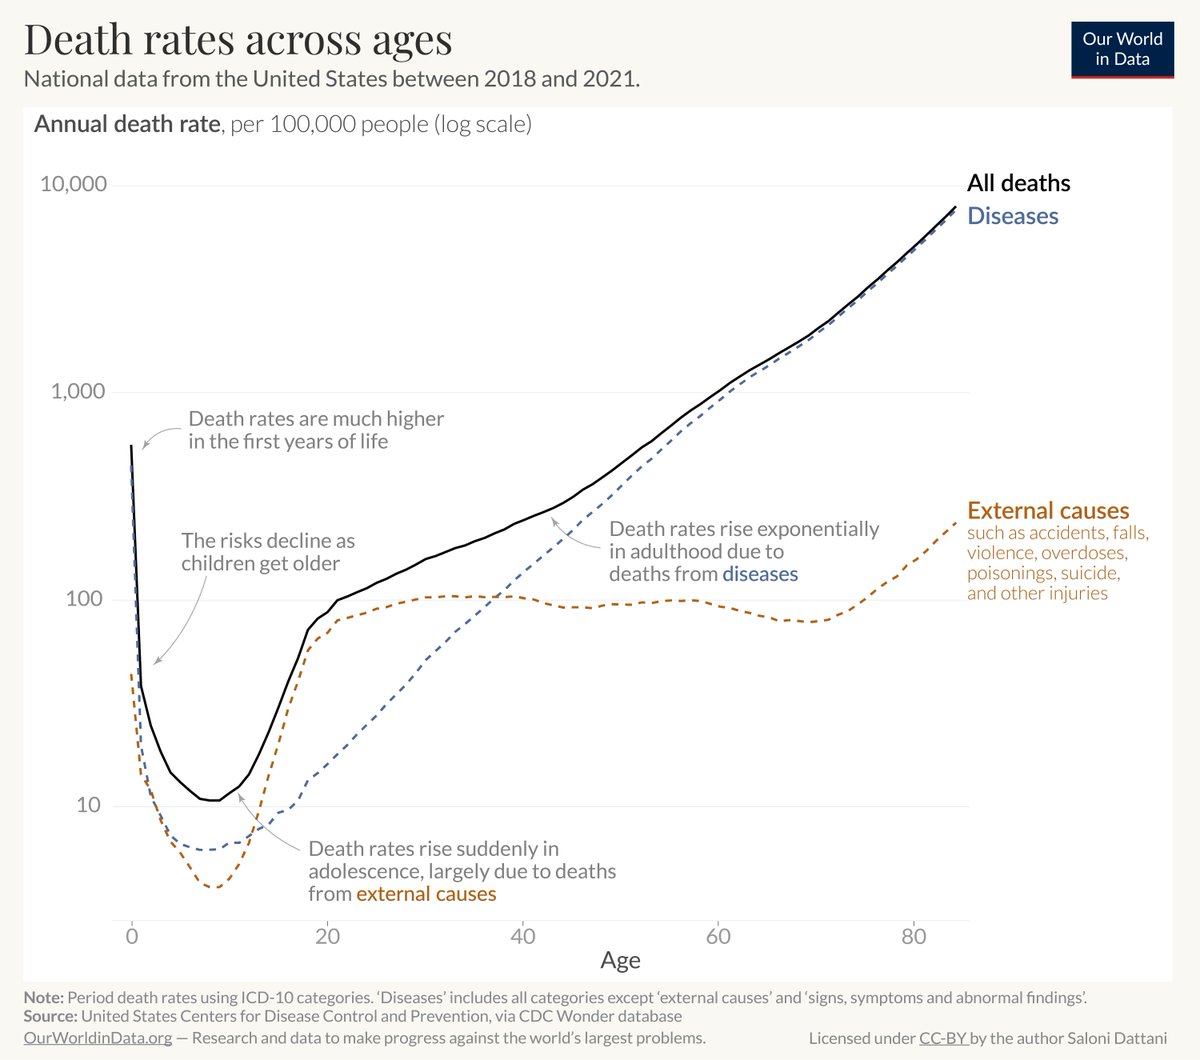
ALT Age-specific mortality in the US, broken down by diseases and external causes, using data from the CDC Wonder between 2018 and 2021. Chart CC BY Our World in Data
1
24
103
13,395
Zeki Berk retweeted
27 Jul 2025
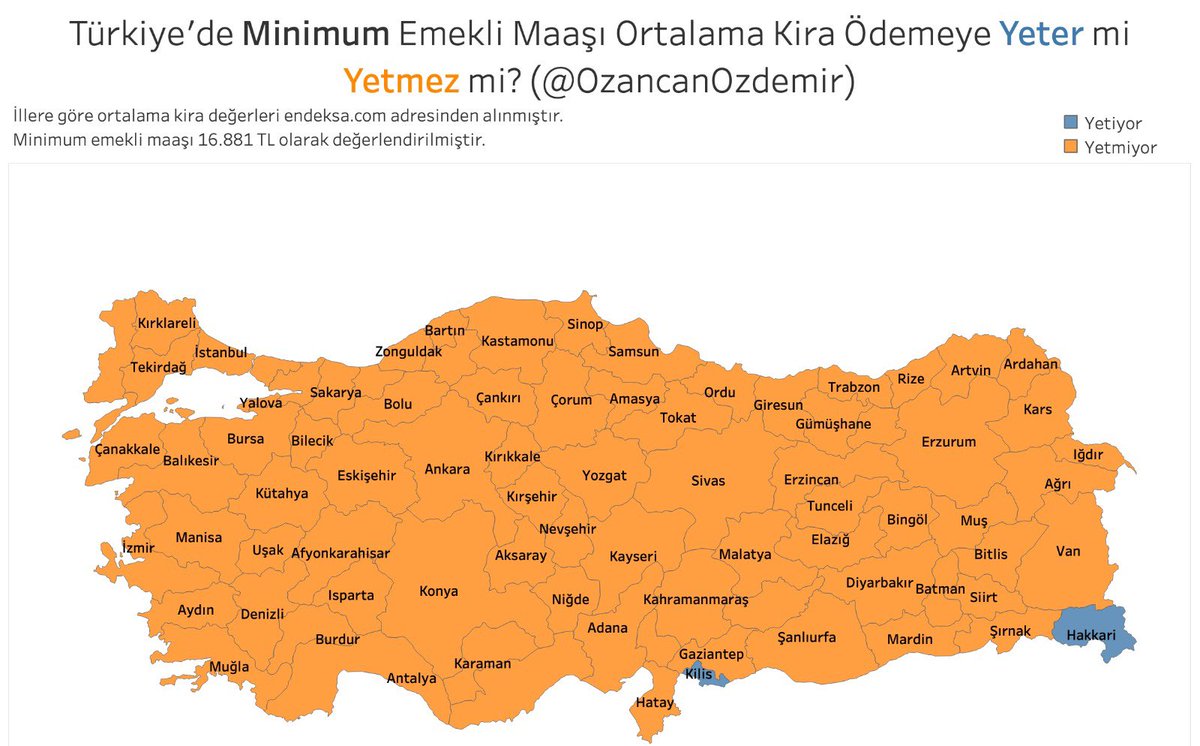
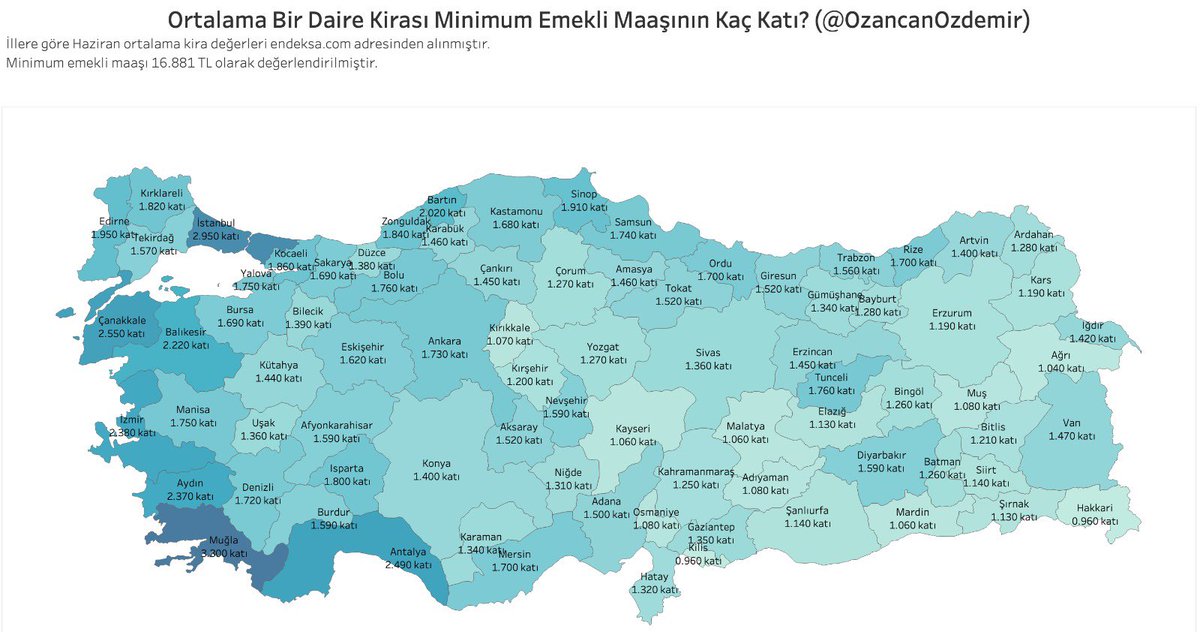
Türkiye'de minimum emekli maaşı 81 ilin 79'unda ortalama bir ev kirası ödemeye yetmiyor.
Ortalama ev kiraları Muğla'da minimum emekli maaşının 3.3 katı, İstanbul'da 2.9 katı, Antalya'da 2.5 katı, Ankara'da 1.7 katı. Büyükşehirlerde yaşamak kirada oturan emekliler için zor.
1
27
74
14,811
Zeki Berk retweeted

17 Jul 2025
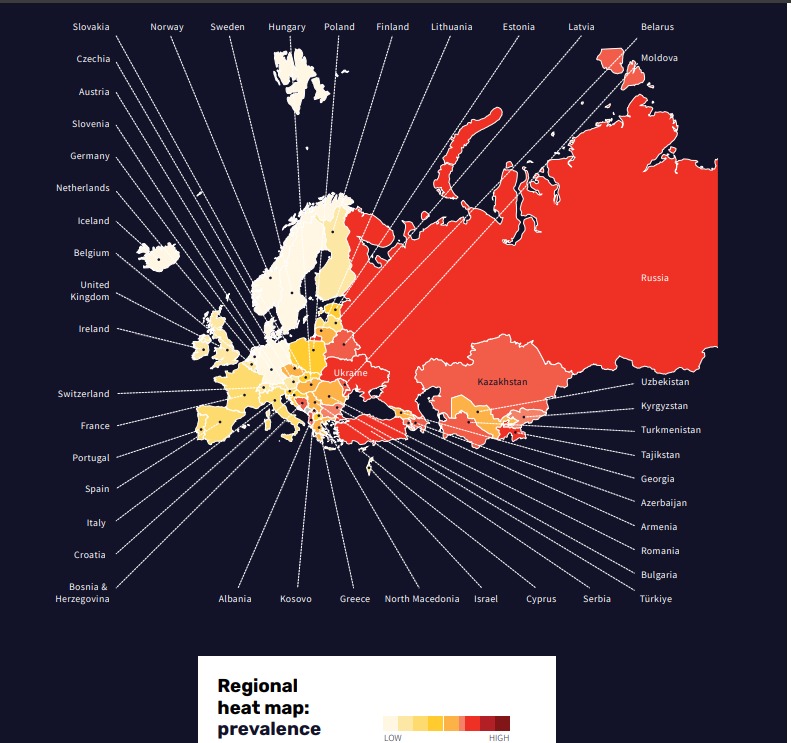
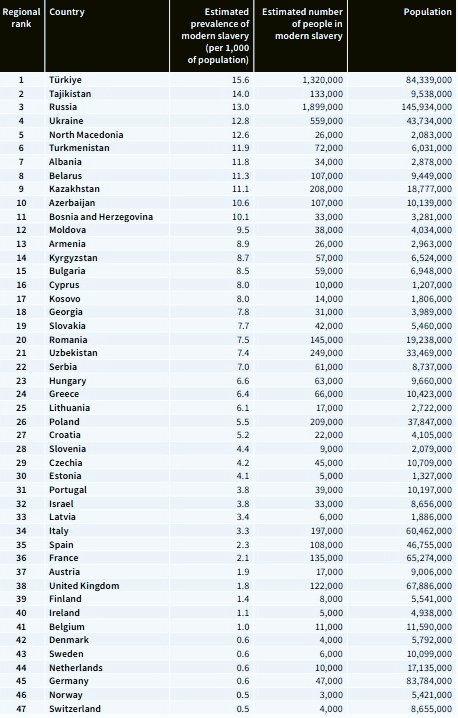
Dünya Kölelik Endeksi’nin tepesinde olduğumuzu anımsatayım: en fazla birkaç milyon kişi rahat hayat yaşıyor olabilir ama 80 milyon köleleri gibi çalıştığı için…
17 Jul 2025

Global Slavery Index 2023
Prevalence of Modern Slavery in Europe and Central Asia
Highest 5 Countries
Türkiye🇹🇷
Tajikistan🇹🇯
Russia🇷🇺
Ukraine🇺🇦
North Macedonia🇲🇰
Lowest 5 Countries
Switzerland🇨🇭
Norway🇳🇴
Germany🇩🇪
Netherlands🇳🇱
Sweden🇸🇪
@WalkFree
2
19
48
4,680
Zeki Berk retweeted
14 May 2025
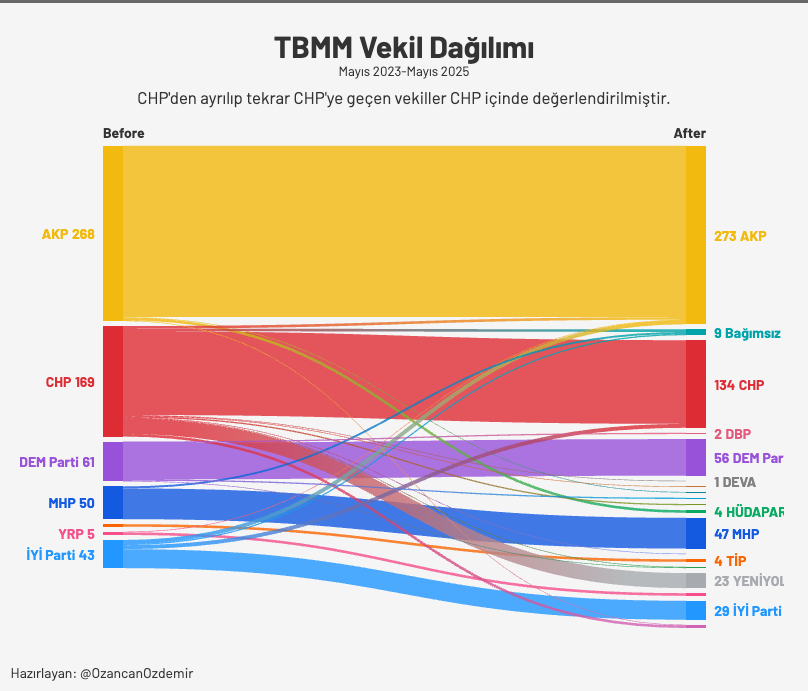
Son transferlerden sonra TBMM'deki partilerin vekil dağılımı bu şekilde oluştu.
Başka partilerden olup, CHP listelerinden giren 39 vekilden 4 tanesi iktidar partisine geçmiş. Bu vekillerin 3'ü Gelecek 1'i İyi Partili.
İttifak politikası haricinde en fazla vekil kaybeden parti İYİ Parti. 43'ten 29'a düşmüş. CHP ve AKP'ye eşit sayıda vekil geçmiş. (6).
1
7
19
4,664
Zeki Berk retweeted
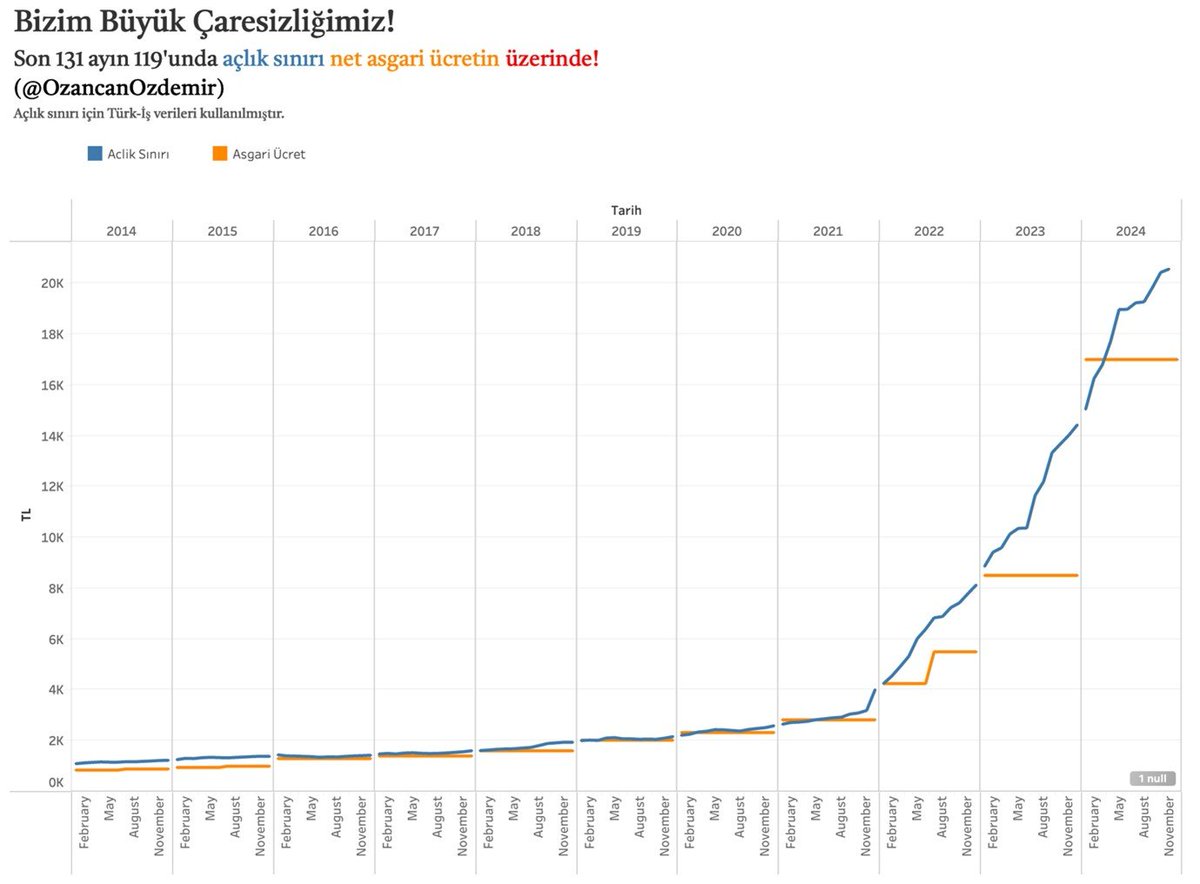
18 Apr 2025
Son 135 ayın 123'ünde net asgari ücret, 4 kişilik bir ailenin sadece gıda gideri olan açlık sınırının altında.
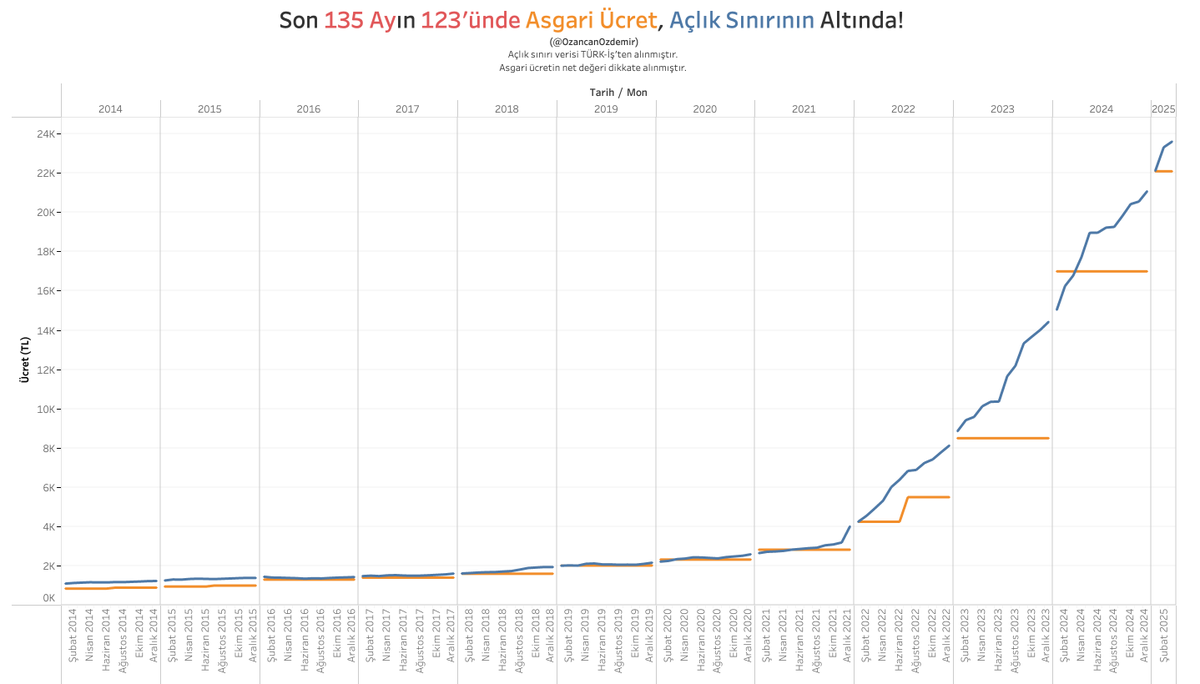
31 Jan 2025
Türk-İş'in açıkladığı değerlere göre daha Ocak ayında asgari ücret açlık sınırının üzerinde. 2024'te en azından birkaç ay direnebilmişti. Geçtiğimiz ay sonunda ülkedeki emekçi kesimin yaşadığı bu sorunu anlatmaya çalışmıştım.
6
20
8,195
Zeki Berk retweeted
31 Mar 2025
Zaten hiç hapiste olmaması gereken @tayfun_kahraman ve şimdi de @mhrpolat kronik hastalıkların da mağdurları…
Bu hak ihlallerine vesile olmak, göz yummak, insanlığının gereğini yerine getirmemek demek.
Teyzem Sevgi Soysal’ın bir zamanlar cezaevinden yazdığı “Biz insanları sevdiğimiz, çok sevdiğimiz için buradayız” sözleri tam da onlar, Silivri ve ötesindeki “düşünce suçluları”, öğrenciler, siyasetçiler, belediye başkan ve yöneticileri, sivil toplum mensupları için de geçerli…
31 Mar 2025

MS hastası Tayfun’a hastane sevki sırasında eziyet ettiler. Herkes gördü.
Şimdi bir sürü kronik hastalığı olan Mahir'e aynı eziyeti reva görüyorlar. Herkes görüyor. Henüz kimse yargılanmadı.
Tayfun gibi haksız yere tutuklu olduğunu cümle âlemin bildiği Mahir'i yoğun bakım odasından aldılar, Silivri’ye yeniden götürdüler.
Birileri çıkıyor ve “Türkiye bir hukuk devletidir, yargı bağımsızdır” diyor.
Kim inanıyorsa artık…
Bizim gibi herkes görüyor zulmünüzü. Niyetinizi de biliyoruz.
Ölümden öte köy yok ama ölmeyeceğiz!
Acımızı içimize atmayacağız!
Susmayacağız!
Avaz avaz bağıracağız!
86 milyona tek tek anlatacağız!
Bayramlarımızı zehir ettiniz!
Çiçek gibi insanların hayatlarıyla oynuyor, çocuklarını babasız bırakıyorsunuz!
Bahçeleriniz bahar görmesin!
1
12
46
4,067
Zeki Berk retweeted

28 Mar 2025
"Resepsiyona indiğimde karşımda 3 sivil polis vardı"
Türkiye'de gözaltına alınan ve sınır dışı edilen BBC Muhabiri Mark Lowen yaşadıklarını DW'ye anlattı
Detaylar: dwturkce1.com/tr/sın�…
24
364
1,030
85,880
Zeki Berk retweeted
28 Mar 2025
😳
28 Mar 2025

Swedish journalist Joakim Medin has been detained in Turkey after arriving in Istanbul on Thursday to report on the protests. We do not as yet know where or how he is, and are imploring the Swedish government to take action to help get Joakim home. etc.se/inrikes/swedish-journ…
1
13
3,782
Zeki Berk retweeted

28 Mar 2025
Ekrem İmamoğlu’nun Cumhurbaşkanı adaylığı; adaletin ve milletin egemenliğinin teminatı olacak bir yolculuğun başlangıcıdır.
Gelin, yarın saat 12.00’de Maltepe’ye koşalım, meydanda buluşalım, iktidar yürüyüşümüzü hep birlikte başlatalım!
2,523
5,384
37,414
1,154,570