
Making data your friend
Joined June 2021
- Tweets 593
- Following 172
- Followers 3,050
- Likes 88
453 Photos and videos


27 Oct 2023
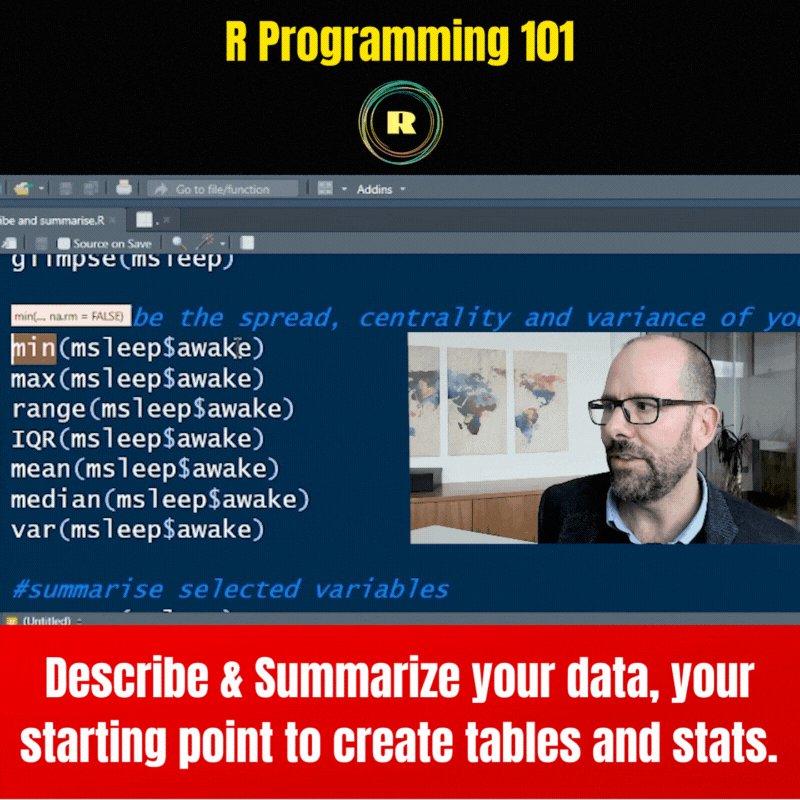
📊 Want to dive into data analysis with R? 🤓
Learn how to create tables and descriptive statistics using R programming. Whether you're new to data science or just need to analyze data, we've got you covered 👉 zurl.co/ZCP3 💡📈
#DataAnalysis #RProgramming
1
6
30
3,331
16 Oct 2023
Level up your data analysis with R Programming! 🖥️📈 Must-watch for beginners diving into R. Master data manipulation—a key step before stats! 🔍✨ #RProgramming #DataAnalysis #Statistics #BeginnersGuide #DataManipulation #LearnWithDataSci
👉 zurl.co/AaOy
4
16
2,300
13 Oct 2023
📊 Dive into R programming with Dr. Greg Martin! Learn data cleaning and analysis step-by-step. 🧹 Perfect for data enthusiasts! 💡 #RProgramming #DataAnalysis #Tidyverse #DataScience 🎓
👉 zurl.co/kJtK
1
13
1,718
12 Oct 2023
📊🚀 Watch this beginner-friendly journey using #RProgramming and the powerful #tidyverse! 📈 Learn to explore and understand your data's intricacies with ease. Let's unravel the secrets of data science and quantitative analysis together! 💡
👉 zurl.co/3DPM
1
6
1,339
11 Oct 2023
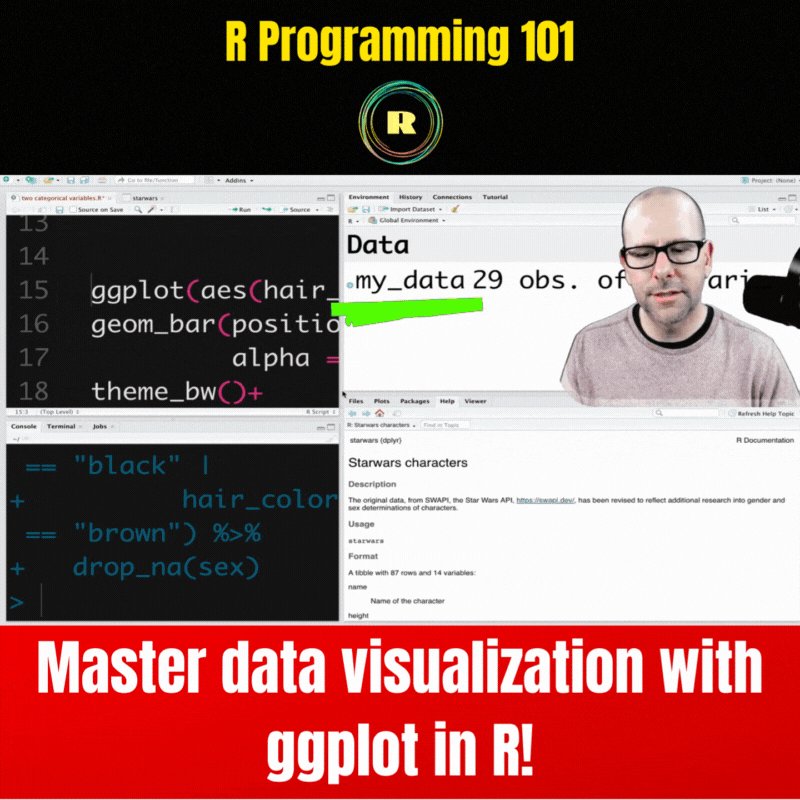
📊 Explore easy bar chart creation with ggplot in R! 📈 Ideal for data science and stats beginners. 💡 #DataViz #RProgramming #Statistics #RStats #LearnR 🚀
👉 zurl.co/cJ8O
6
19
2,353
10 Oct 2023
📊 Dive into R programming for powerful visualizations! 📈 Ggplot simplifies creating plots and graphs for your data. 📊✨ Perfect for stats, quantitative analysis, and data science enthusiasts! 📊👨💻
#RProgramming #DataVisualization #Ggplot
👉 zurl.co/PNSG
4
18
2,156
9 Oct 2023
📊 Dive into R Programming: Create, Visualize, Analyze! 📈 Watch now to master ggplot for plots & graphs. 📺👨💻 Ideal for R beginners! 🌟 Step into the realm of statistics with us! 🚀
#RProgramming #DataViz #ggplot #Tidyverse #LearnR
👉 zurl.co/F9u5
5
31
2,757
6 Oct 2023
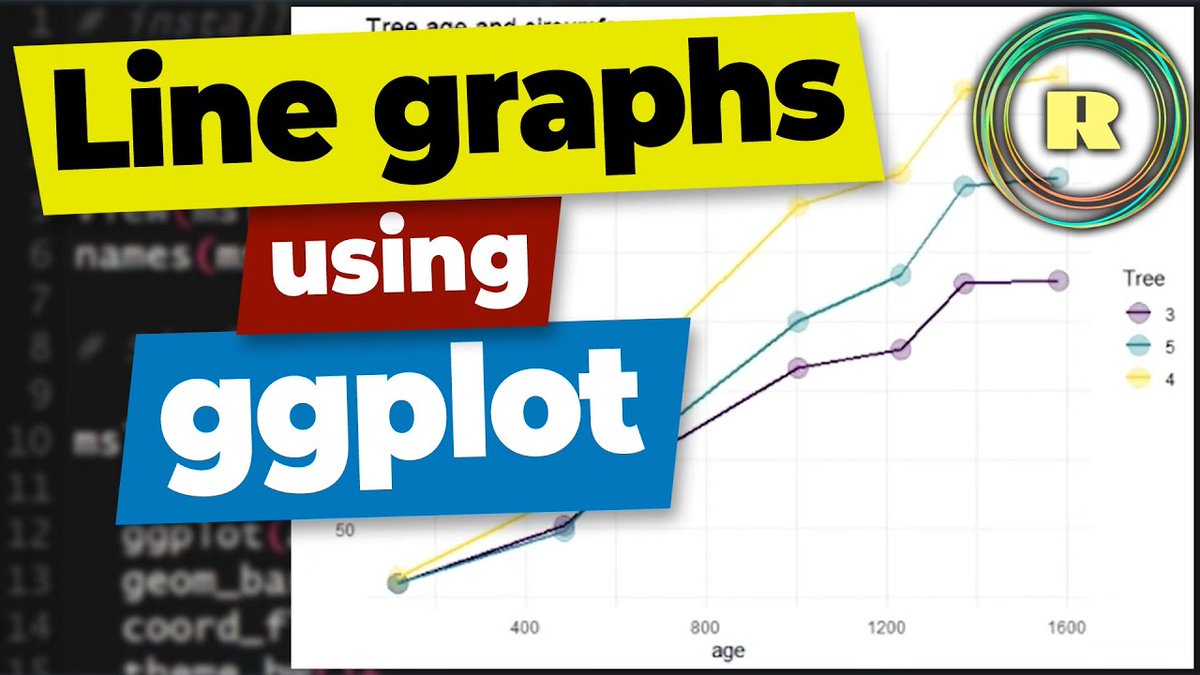
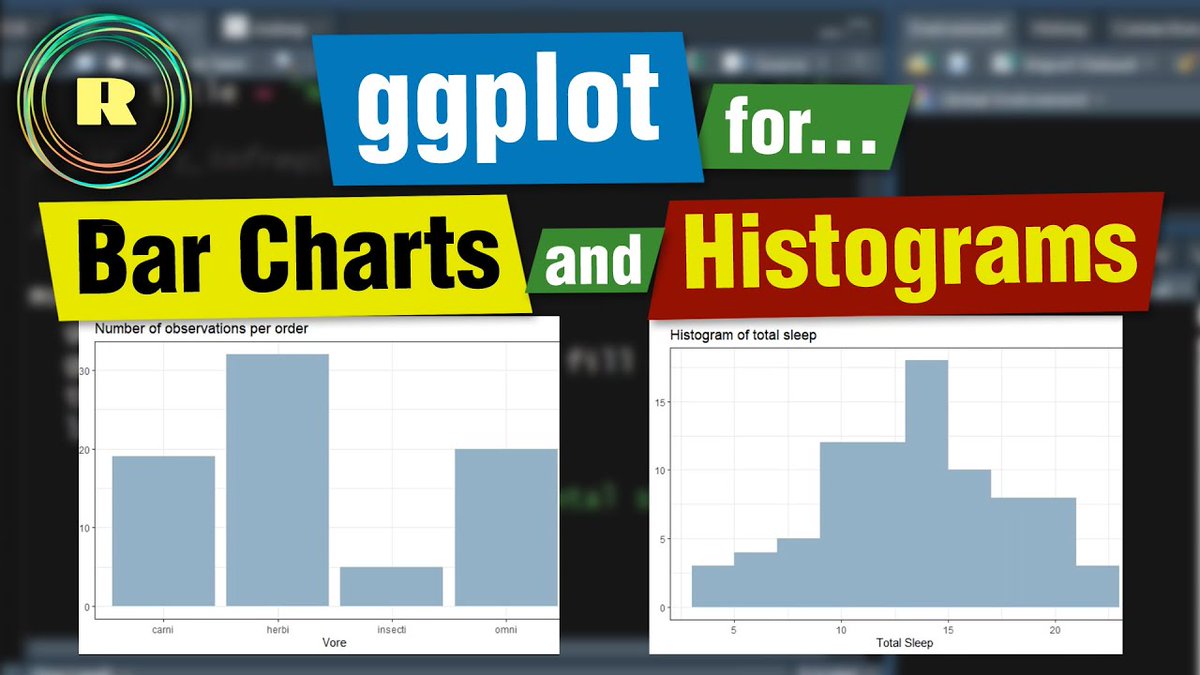
📊💡 Master #DataVisualization with ggplot in R! 📈✨ Create effortless bar charts and histograms. 💪🖥️ If into data science, statistics, and learning R, ggplot2 is a must! 🌟 Join our #RProgramming series to unlock ggplot's potential! 📊👩💻
👉 youtu.be/n_ACYLWUmos
8
964
5 Oct 2023
📊🖥️ Discover #DataVisualization in R! 📈✨ Learn easy visualization using R and ggplot. Perfect for creating stunning scatter plots with numeric variables. 🌟 Part of a series for data enthusiasts! 📊📚 📉🧠 #RProgramming #Statistics #LearnR
👉 zurl.co/ck6q
9
967
4 Oct 2023
📊💡 Master #DataViz with #ggplot in R! 📈✨
Create captivating plots with #ggplot2 in #RProgamming! 🖥️
Explore numeric & categorical data, crafting engaging scatter plots & insightful linear models. 🎥📈 📊📚
👉 zurl.co/4Siu
1
4
833
3 Oct 2023
Discover the ease of #RProgramming! Learn to use functions with data objects through this video—a fundamental step in mastering R programming. 📊 Making stats simple! 👍
👉 zurl.co/0YEO
5
703
29 Sep 2023
📊 Dive into #RProgramming with this beginner-friendly video! Learn 10 ways to filter and subset your data. Perfect for stats enthusiasts, data scientists, & quantitative researchers. Don't miss out! 🎥 #DataFiltering #DataScience #QuantitativeResearch
zurl.co/5ZZL
6
13
1,435
27 Sep 2023
📊 Dive into beginner-friendly R programming for data recoding and manipulation! 🖥️ Explore tidyverse's dplyr in R Studio, ideal for aspiring data analysts. 🌟 #RProgramming #DataManipulation #DataScience #QuantitativeAnalysis #BeginnersGuide
👉 zurl.co/I3K3
8
16
1,550
26 Sep 2023
📊 Dive into R Programming for Beginners! 🖥️✨ Learn how to rename variables and rearrange columns with Tidyverse in R! 🚀💡
#RProgramming #DataScience #Tidyverse #DataAnalysis
👉 zurl.co/Ulpe
1
4
536
25 Sep 2023
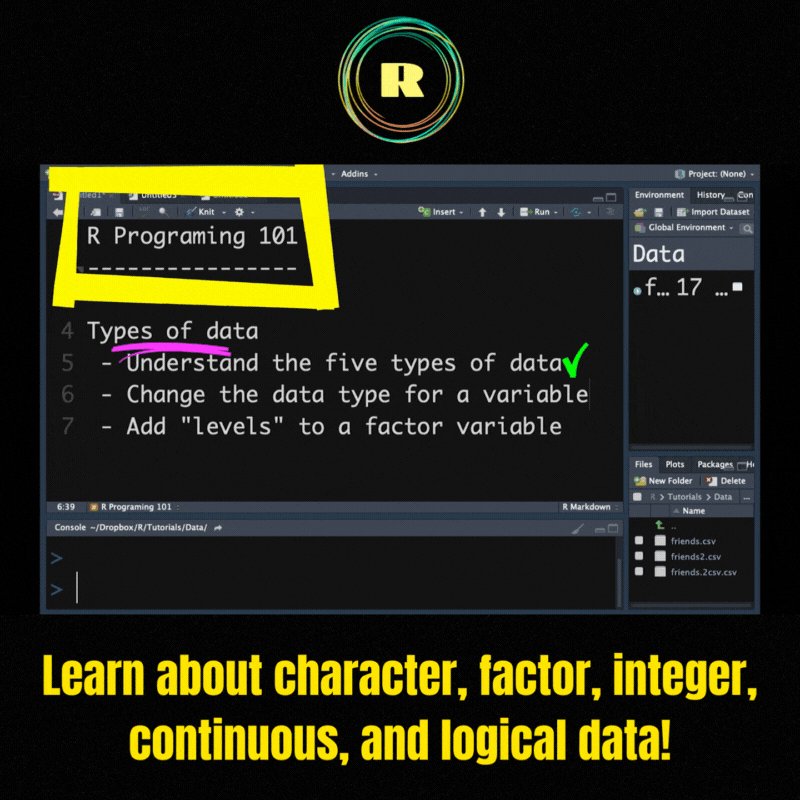
📊 Discover 5 key data types in #RProgramming: character, factor, integer, continuous, and logical. Learn how to analyze data frames and modify variable types in this "R Programming for Beginners" series! 🎥💡 #DataTypes #Statistics
👉 zurl.co/81H1
1
1
590
22 Sep 2023
📊 Explore #DataManipulation with tidyverse in R! Join "R Programming for Beginners" to master DPLYR commands for data analysis. 🎥🔍 Level up your R game with R Studio! 💡📈 #RProgramming #DataScience #RStats #LearnR
zurl.co/YMG3
2
6
763
21 Sep 2023
🚀 Master Data Import in R! 📊 Unleash Excel data with R code and R Studio tools. 🖥️ Dive into our R Programming for Beginners series. 📚
👉 zurl.co/OfPz
#RProgramming #DataImport #RStudio #BeginnersGuide #RStats
1
12
1,105
20 Sep 2023
📹 Learn to kickstart your R project! 🚀 Import data, install key packages like tidyverse, DPLYR, ggplot for advanced data analysis. 📊✨
Join our #RProgramming for Beginners series and dive into the world of data science and stats! 📈💡
👉 zurl.co/THGH 🖥️
1
5
602
19 Sep 2023
📹 Dive into R programming for beginners! 🖥️ Learn to install R & set up R Studio for data science and stats. 📈✨ Ready to explore the world of data and numbers? 💡
zurl.co/4oQM
#RProgramming #DataScience #RStudio #StatisticalAnalysis #LearnR #DataAnalysis 📊🔍
2
10
950
14 Sep 2023
📈 WHY USE R?
Dive into the world of #R programming!
Discover why it's the go-to choice for data analysis over SPSS, STATA, SAS, and more. Watch me calculate means, medians, plot histograms, and find correlation coefficients in this video. 📊
zurl.co/u274

3
9
1,005