
Joined April 2026
- Tweets 532
- Following 6
- Followers 89
- Likes 35
152 Photos and videos


Capital Outlier retweeted
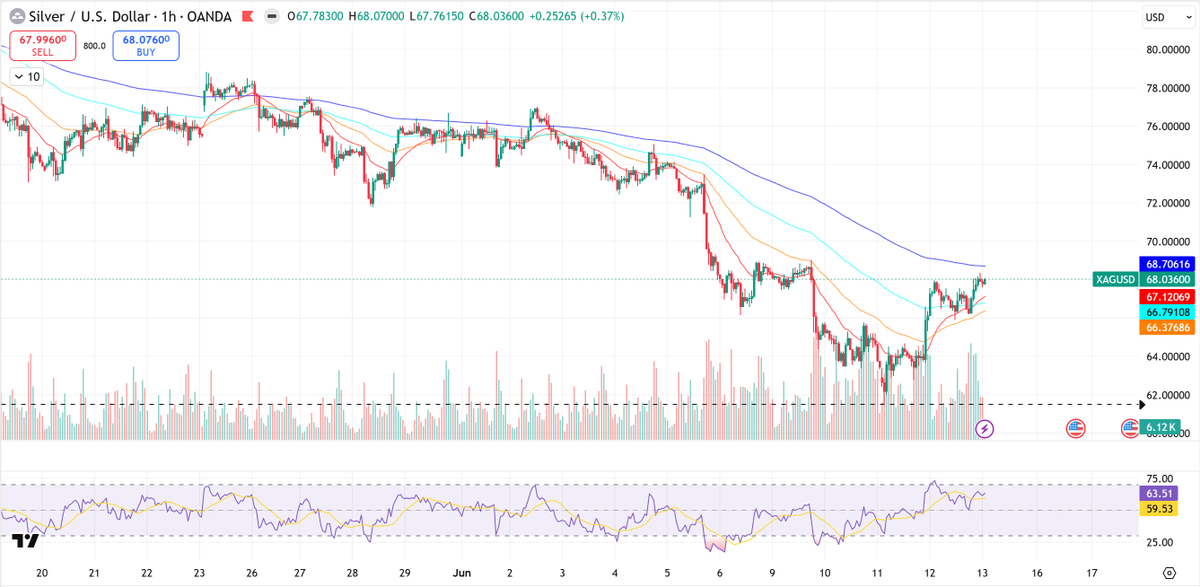
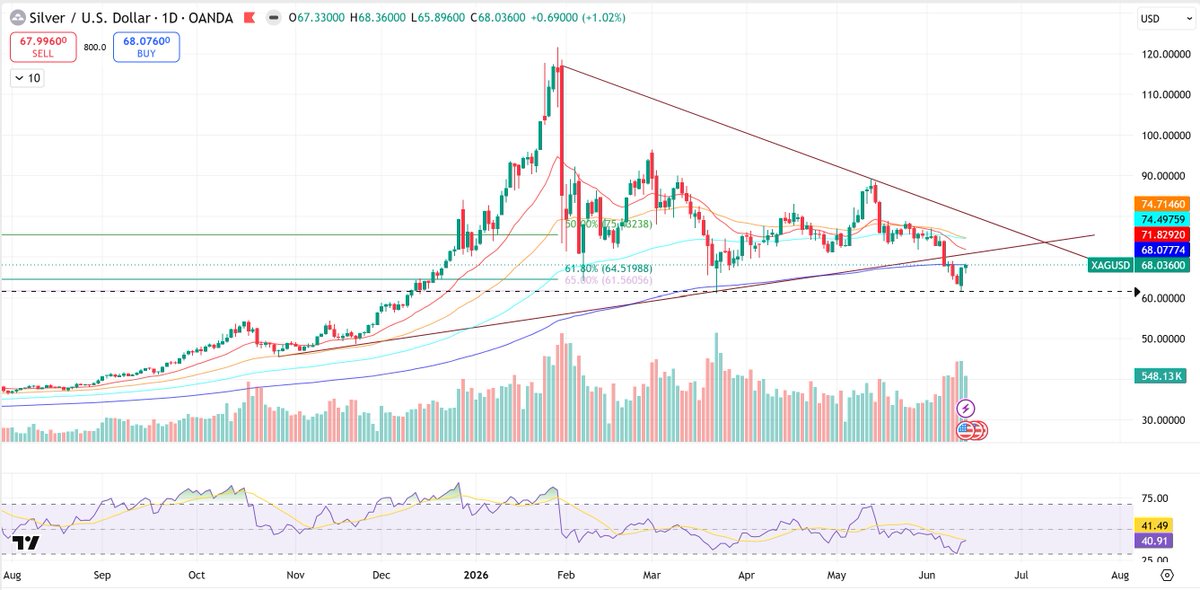
📈 #XAGUSD #Silver
As expected, the $61.50 to $64.50 confluence demand zone holding the 61.8% to 65% Fibonacci pocket triggered a sharp, systematic relief bounce. The structural defense of the key horizontal floor successfully neutralized the aggressive selling momentum.
🔍 Technical Setup:
• 1H: Clean V-reversal from the $61.50 liquidity pocket back up to $68.03. Price is pushing through short-term hourly EMAs, with the RSI recovering efficiently into neutral-bullish territory (63.51) after the recent deep compression.
• Daily: A strong bullish engulfing reaction precisely off the major macro horizontal support line. Price is now pressing straight into the critical $68.00 to $69.00 near-term resistance zone and daily EMA cluster.
⚡ My Playbook:
✅ The initial short-term swing long play from the demand pocket is executing flawlessly.
• To sustain this momentum shift, I am watching for a clean, definitive daily close confirmation above the $68.00 to $69.00 resistance line to unlock the next structural legs higher.
• For the broader macro continuation, the priority remains waiting for a confirmed weekly higher low base to fully establish before expanding long-term exposure.
The floor held with high precision. Now we watch how buyers manage the immediate overhead supply wall.
DYOR
Not a recommendation
#silver #xagusd #trading #investing #technicalanalysis #commodities #macro #pricecation #SOH #nifty
Jun 11

📈 #XAGUSD #Silver
Price is undergoing a sharp corrective decline from its recent major swing highs, currently testing a critical multi-month horizontal demand floor and key Fibonacci retracement markers.
🔍 Technical Setup:
• 1-Day Chart: Price has dropped through its short-term daily EMAs but is currently catching a bid right above the major horizontal support line. The price action is compressing directly within the macro 61.8% Fibonacci retracement level ($64.51) and the 65% pocket ($61.56).
• 1-Week Chart: The broader multi-year macro uptrend remains valid, but the velocity of the current sell-off means a solid weekly base must form here to prevent a deeper macro structural shift.
• Daily RSI: Hovering heavily in compressed territory near 31.45, signaling massive near-term exhaustion from sellers and a high statistical probability of a relief bounce.
📊 Key Structural Levels:
• Intraday Support (Day's Low): $61.50 (The absolute defensive floor for the ongoing session, aligning perfectly with the 65% Fibonacci level).
• Immediate Support / Demand Zone: $61.50 to $64.50 (A crucial confluence region containing the 61.8% to 65% Fibonacci pocket and the historical horizontal breakout base).
• Major Supply Zone 1: $68.00 to $69.00 (The immediate overhead resistance area and blue moving average line where sellers are highly likely to defend).
• Major Supply Zone 2: $71.00 to $75.00 (The primary structural breakdown zone, clustered tightly with the short-term daily moving averages).
⚡ My Playbook:
• Setting up an aggressive short-term swing long within the $61.50 to $64.50 demand zone to play a clear relief bounce. Looking for a daily close confirmation back above the $68.00 to $69.00 resistance line to aim for upside structural objectives at $71.00 to $75.00 and $82.00 to $85.00, keeping an invalidation on a daily close below $60.00.
• Preparing a higher-confidence position for the next major trending leg higher by waiting for a weekly higher low and a weekly close above $75.00, adding exposure on a breakout above $90.00 to capture macro structural extensions at $100.00, $115.00, and $130.00, with an invalidation on a weekly close below $57.00.
• A SFP right around these current levels would be an ideal trigger for a fakeout recovery. However, a clean weekly close below $61 would invalidate the immediate recovery bias and signal continued macro weakness toward the $45 to $50 macro demand zone.
DYOR
Not a recommendation
#silver #xagusd #trading #investing #commodities #swingtrading #macro #gold #priceaction
2
1
135
Capital Outlier retweeted
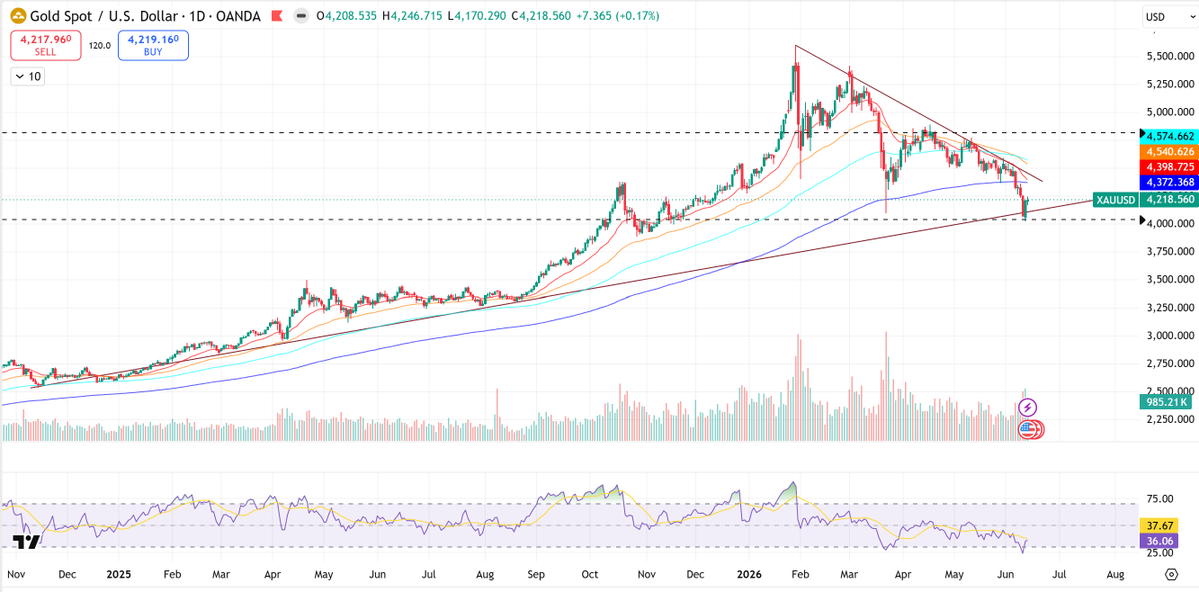
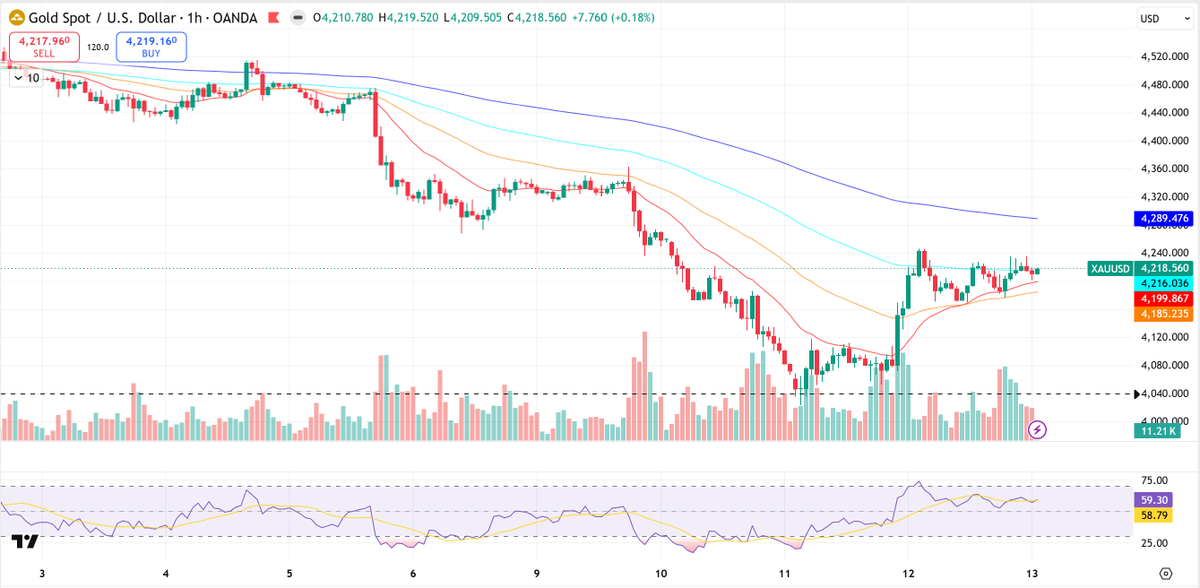
📈 #XAUUSD #Gold
As expected, the $4,000 to $4,100 demand zone delivered a strong relief bounce. The market defended the key $4,000 psychological level and avoided a deeper structural breakdown.
🔍 Technical Setup:
• 1H: Sharp V-reversal from $4,023 to $4,218. Price is now consolidating below near-term resistance. RSI has recovered to neutral territory after being heavily oversold.
• Daily: Clean bullish reaction from major support. Price is now testing the descending trendline that has capped rallies since the peak.
• Weekly: Macro structure remains intact. Weekly EMA support held on its first meaningful retest in months, reinforcing the late-2025 consolidation base.
⚡ My Playbook:
✅ The bounce thesis is playing out as expected.
• A sustained daily close above $4,200 to $4,250 would strengthen the case for a broader momentum shift and confirm a potential Wave 4 low.
• For the bigger macro setup, I want to see a confirmed weekly higher low followed by a reclaim of $4,400 before targeting a potential Wave 5 expansion.
The support held. Now the real test is whether buyers can reclaim overhead supply.
DYOR
Not a recommendation
#gold #xauusd #trading #investing #pricecation #SOH #technicalanalysis #commodities #macro #nifty
Jun 11
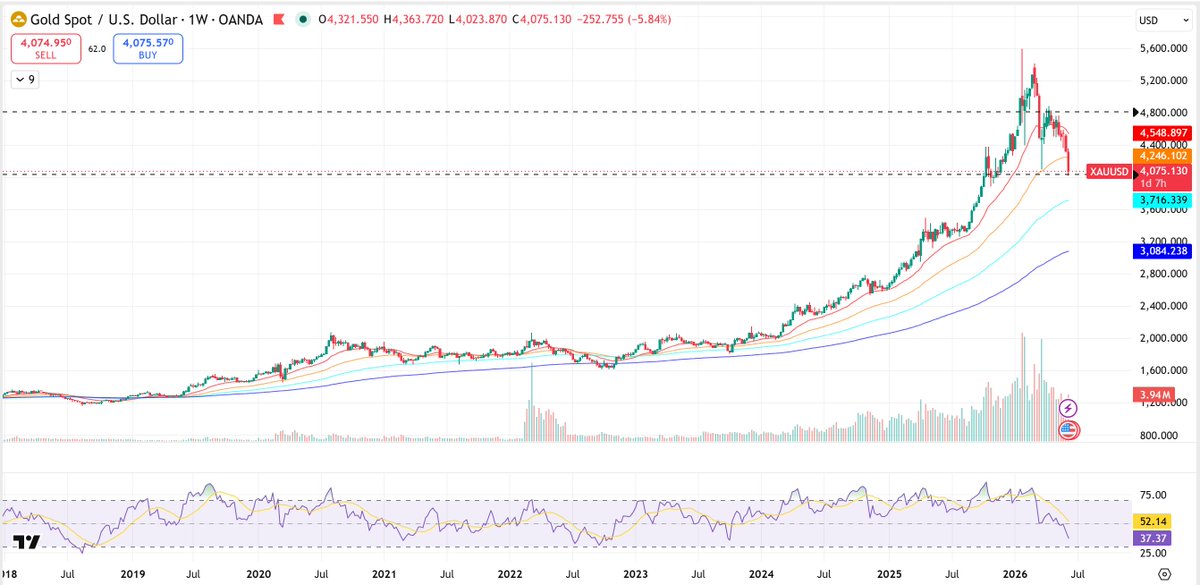
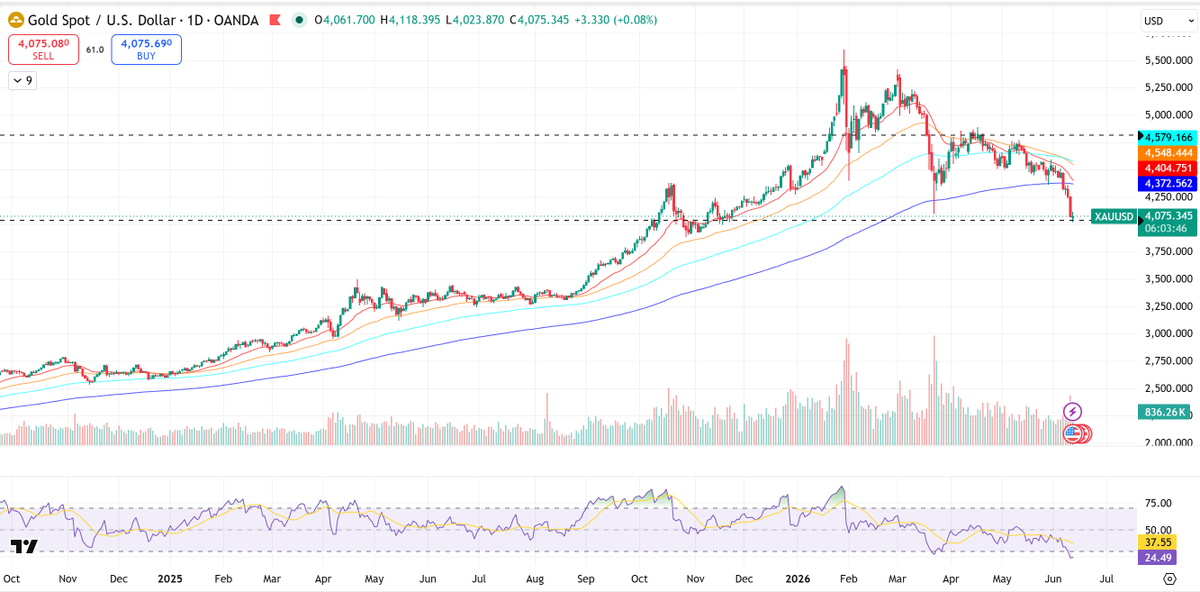
📈 #XAUUSD #Gold
Price is undergoing a steep correction after hitting a macro peak near $5,500, now searching for structural equilibrium as it hits a major multi-month demand zone and critical moving averages.
🔍 Technical Setup:
• Daily Chart: Intraday action shows a temporary pause in selling momentum right at the key horizontal support line. The price has broken below its daily EMA cluster, meaning a strong base must form here to shift the near-term trend.
• Weekly Chart: The broader macro bull run remains structurally active. The current sell-off is testing the crucial long-term weekly EMA support line for the first time in months, matching up perfectly with historical consolidation zones from late 2025.
• Daily RSI: Currently hovering in deeply oversold territory at 24.49, indicating massive near-term exhaustion from sellers and a high probability of a relief bounce.
📊 Key Structural Levels:
• Intraday Support (Day's Low): $4,023.87 (The absolute floor safeguarding the psychological $4,000 level).
• Immediate Support / Demand Zone: $4,000 to $4,100 (A vital multi-month structural support pocket where historical buying interest emerged).
• Major Supply Zone 1: $4,200 to $4,250 (The immediate overhead breakdown pivot and near-term daily EMA resistance line).
• Major Supply Zone 2: $4,550 to $4,600 (The dominant distribution peak from May, marking a heavy overhead supply wall).
⚡ My Playbook:
• Setting up a short-term swing long within the $4,000 to $4,100 demand zone to catch a wave 4 bottoming play. Looking for a daily close confirmation back above $4,200 to validate the momentum shift, keeping an invalidation break below $3,900 to structural supply zones at $4,400 and $4,550.
• Preparing a wider macro position to capture the potential wave 5 impulse by waiting for a weekly higher low and a definitive reclaim of $4,400. Adding strength on a breakout past $4,600, with a macro invalidation on a weekly close below $4,000 to clear the path toward $4,800 and the psychological $5,200 levels.
• A Swing Failure Pattern (SFP) right around these current levels would be an ideal trigger for a fakeout recovery. However, a clean weekly close below $4,099 would invalidate the immediate recovery bias and signal continued macro weakness toward the $3,700 floor.
DYOR
Not a recommendation
#gold #xauusd #trading #investing #commodities #swingtrading #macro #nifty #metals #preciousmetals
2
88
Capital Outlier retweeted
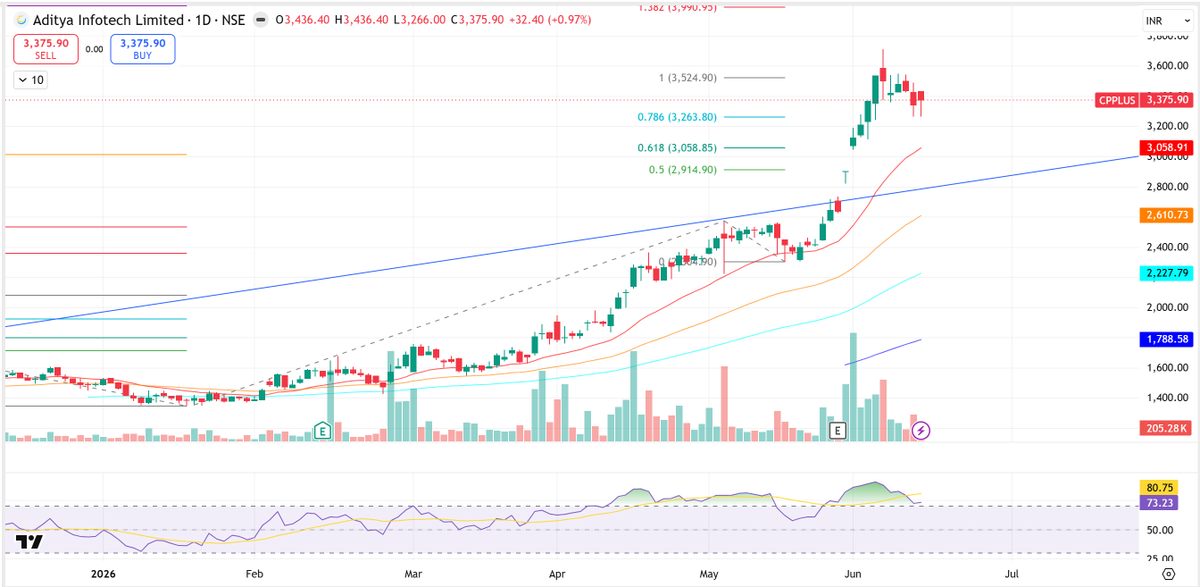
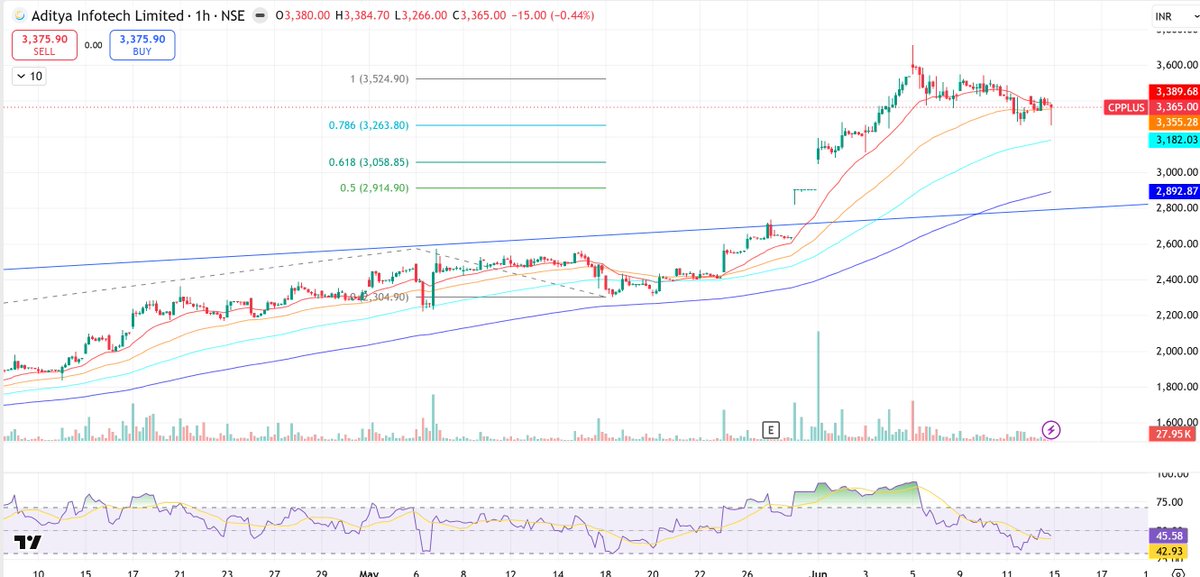
📈 #CPPLUS #AdityaInfotech
Following the powerful breakout past the macro Fibonacci structure, #CPPlus surged to an absolute peak of ₹3,714 before entering a logical phase of local consolidation.
🔍 Technical Setup:
• 1H Chart: The near-term trend is building a highly structured base near local support. Price is actively consolidating at ₹3,365.00, finding strong intraday support directly at the hourly moving average clusters. This local floor is reinforced tightly by the macro structural breakout level at ₹3,263.80 just below it.
• RSI Check: The micro-structure has reset beautifully. The 1H RSI has cooled down completely from overextended levels and is now hovering in neutral territory at 45.58, indicating that the immediate vertical froth has been thoroughly purged while approaching structural support.
⚡ My Playbook:
• The initial levels beyond the ₹3,263 breakout zone have mapped out perfectly.
• The current priority remains tracking trend maturity on the lower timeframes. I am content riding core positioning rather than forcing fresh entries during a healthy, necessary consolidation pattern.
• Patient base monitoring is key. A decisive breakdown below the immediate hourly EMA and ₹3,263 structural floors would signal a deeper retest, whereas a clean bullish pivot away from this hourly support cluster sets the stage to target a daily close confirmation back above ₹3,525.
DYOR
Not a recommendation
#StockMarketIndia #AdityaInfotech #CPPLUS #TechnicalAnalysis #PriceAction #Nifty
On May 29, I highlighted ₹2,914 as a key breakout level and ₹3,263 as the next area of interest for #CPPLUS
June 1 close: ₹3,126.
The breakout has played out so far, and the broader thesis remains intact.
The crowd wanted confirmation. The market rewarded conviction.
Now comes the harder part: avoiding FOMO.
RSI is in overheated territory, and parabolic moves rarely travel in a straight line forever. For now, I'm simply letting the trend play out.
Personally, I wouldn't be initiating a fresh position at these levels. I'd rather respect the risk and wait for the market to present a cleaner setup.
The next zone I'm watching is ₹3,245–₹3,265.
Just sharing my observations and process.
DYOR.
Not a recommendation.
#AdityaInfotech #CPPLUS #StockMarketIndia #PriceAction #Nifty
73
Capital Outlier retweeted
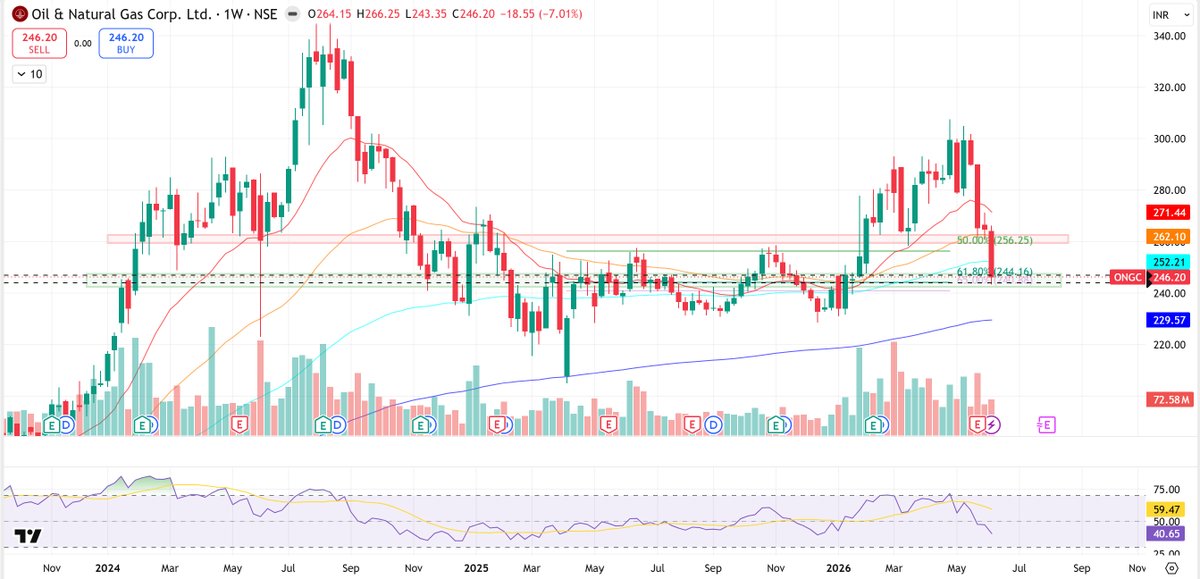
📈 #ONGC (Oil & Natural Gas Corp. Ltd.)
Price has breached immediate overhead supports following a sharp multi-week decline, dropping straight into a critical macro Fibonacci confluence and long-term volume structural base.
🔍 Technical Setup:
• 1-Week Chart: The primary macro uptrend is facing a deep corrective phase, marked by a heavy red weekly candle stripping away recent gains. Price action is currently compressing directly within the macro 61.8% Fibonacci retracement level (₹244.16) and the 65% Golden Pocket ($241.26) region.
• Volume Profile Context: The stock is currently hovering slightly above its major structural Volume Profile Point of Control (VPOC), which acts as a historical heavy liquidity magnet and accumulation zone.
• Macro vs Short-Term Bias: In the shorter timeframes, the stock is bearing the brunt of intense selling pressure due to weakness in global crude oil prices. However, on longer-term timeframes, this deep correction brings price back to a highly attractive accumulation floor.
📊 Key Structural Levels:
• Intraday Support (Weekly Low): ₹243.35 (The defensive floor safeguarding the lower bounds of the Golden Pocket).
• Immediate Support / Demand Zone: ₹240 to ₹245 (The core confluence pocket aligning the 61.8% to 65% Fib levels with historical horizontal congestion).
• Major Supply Zone 1: ₹256 to ₹262 (The immediate overhead breakdown pivot area, mapping to the 50% Fibonacci retracement mark).
• Major Supply Zone 2: ₹290 to ₹310 (The major multi-week swing rejection peak and key distribution block).
⚡ My Playbook:
• Watching the reaction inside the ₹240 to ₹245 demand zone closely. While the long-term structural value makes this an excellent macro accumulation territory, smaller timeframes require patience until crude-driven selling momentum exhausts.
• Looking for a clear weekly stabilization base or a daily reversal candle to confirm that smart money is actively absorbing the supply before exploring bounce plays.
• A decisive further breach of this entire Golden Pocket and VPOC zone would completely void the immediate recovery structure, opening the gates for a deeper macro retest of lower structural floors.
DYOR
Not a recommendation
#ongc #investing #trading #nse #swingtrading #crudeoil #psustocks #priecaction #nifty
1
1
143
Most investors think markets are driven by earnings. They're not. Markets are driven by expectations.
A company can report record profits and still fall. Another can post terrible numbers and rally.
Why?
Because markets don't price reality. They price the gap between reality and expectation.
This single idea explains most of the "irrational" market moves people complain about. The same principle applies to economies, elections, and interest rates.
In investing, being right isn't enough. You have to be right when the market is wrong. That's where the money is made. Most people analyze outcomes. The best investors analyze expectations.
The real question isn't "What will happen?" It's "What does everyone else think will happen?"
What expectation do you think the market is getting wrong today?
#investing #earnings #priceaction #nifty #sensex
18

Jun 13
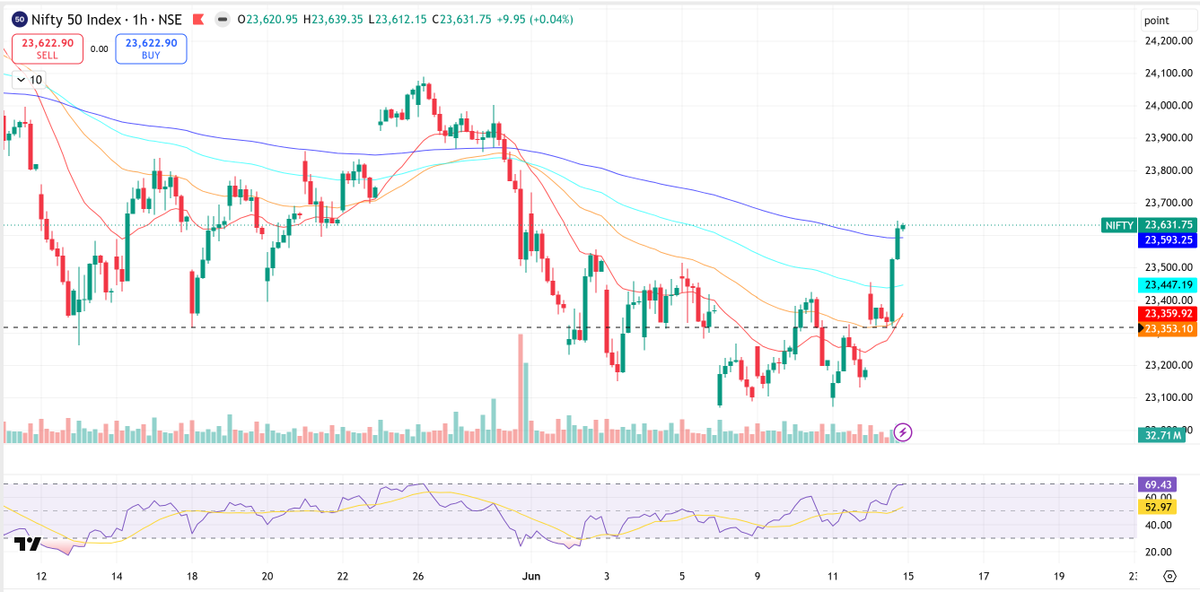
Last week, everyone said the selloff was because US jobs were too strong. Earlier this week, the selloff was because of war.
Now #Nifty is rallying again.
Funny how the explanation always changes after the move.
The narrative changes. Liquidity doesn't.
#trading #pricecation

1
97
Jun 12
📈 #NETWEB Netweb Technologies India Limited
Price is bouncing sharply after a quick liquidity sweep down toward the macro demand zone, actively reclaiming key short-term EMAs to confirm strong institutional support.
🔍 Technical Setup:
• 1-Hour Chart: A textbook SFP - Swing Failure Pattern triggered just before the session close. Smart money swept the previous lows down to the major structural floor near ₹4,100, rapidly trapping late shorters and reversing back up on high buying volume.
• Daily Chart: Long-term macro uptrend remains fully intact. The stock took support right at the major structural flip line and the key orange EMA band, sparking a massive 9.45% intraday surge.
• Daily RSI: Hooking up sharply from its mid-level reset to a bullish 58.01, showing clear reinjection of upward price momentum.
📊 Key Structural Levels:
• Intraday Support (Day's Low): ₹4,100 (The structural SFP sweep low and absolute floor for the session).
• Immediate Support / Demand Zone: ₹4,300 to ₹4,370 (The structural breakout line and the hourly EMA cluster).
• Major Supply Zone 1: ₹4,800 to ₹4,900 (The primary structural swing peaks that initiated the recent multi-day pullback).
• Major Supply Zone 2: ₹5,000 to ₹5,100 (The psychological resistance and macro structural overhead liquidity ceiling).
⚡ My Playbook:
• Regaining and holding firmly above the structural pivot line at ₹4,400 is highly positive. The sudden high-volume SFP confirms that demand has aggressively returned at the structural value area.
• Maintaining a hawkish stance here on broad market exposures. Volatile macros and a slate of upcoming mega IPOs mean sudden profit booking can hit the street at higher levels.
• Better to trail longs tightly and look to lock in gains along the way rather than turning over-aggressive at immediate resistance walls.
DYOR
Not a recommendation
#netweb #investing #trading #nse #swingtrading #priceaction #midcap #nvidia #nifty

2
538
Jun 12
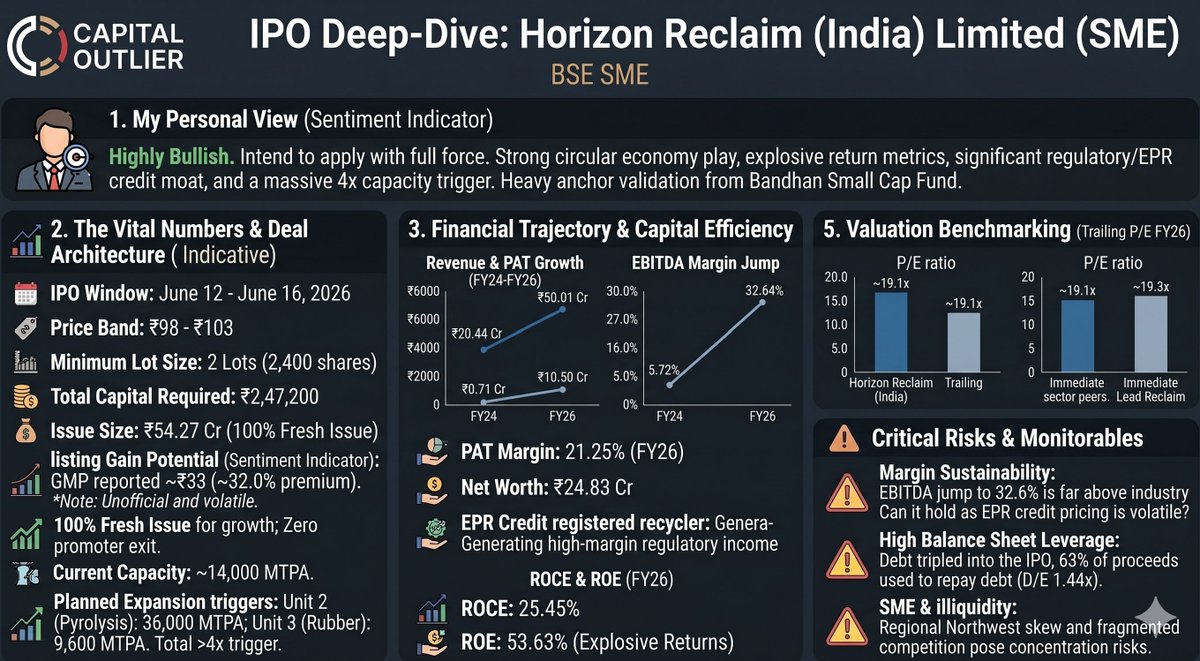
🧵 IPO Deep-Dive: Horizon Reclaim (India) Limited (SME)
My Personal View: I will apply. The company offers a strong circular economy play with impressive growth in return ratios and structural capacity triggers. While the rapid margin expansion demands close attention, the heavy institutional interest in the anchor portion adds systematic validation. The Vital Numbers & Deal Architecture:
• IPO Window: June 12 – June 16, 2026
• Price Band: ₹98 – ₹103 per share
• Minimum Retail Lot Size: 2 Lots (2,400 shares)
• Total Capital Required: ₹2,47,200
• Listing Gain Potential: Market sources report an unofficial GMP of ~₹33 (~32.0% expected premium). (Note: GMP tracking is completely unofficial, volatile, and does not guarantee actual listing day performance).
(1/2) #SMEIPO #HorizonReclaim #CircularEconomy #IPOAnalysis #NIFTY #StockMarketIndia #investing
May 30
I've found IPO investing to be one of the most rewarding opportunities in the market, but IPOs are a lot like mining.
Most people focus on the shiny marketing. Few are willing to dig deep enough to find the real gems. Every IPO comes with a compelling story. Not every IPO comes with a compelling business.
I'll be sharing my research and framework on every notable IPO that hits the market.
Expect:
• What the company actually does
• Financials that matter (growth, margins, debt)
• Valuation vs. listed peers
• Key risks & red flags
• Listing gain potential vs. long-term thesis
• Businesses worth owning, and those worth avoiding
The goal isn't to apply for every IPO. The goal is to identify the rare businesses that can create wealth long after the listing day excitement fades.
No hype. No blind subscriptions. Just structured IPO research. If you're serious about IPO investing, follow along. 📌
1
3
195
Jun 12
🧵Horizon Reclaim: Financials, Peers & Red Flags
What the Company Actually Does & Long-Term Thesis:
Horizon Reclaim manufactures reclaimed rubber, a recycled material derived from used tyres, EPDM, and industrial scrap. Its products are widely supplied B2B to the automotive, footwear, and industrial sectors. As a CPCB-registered recycler under the Extended Producer Responsibility (EPR) framework, the business model captures an additional layer of regulatory and high-margin EPR credit income. Long-term growth is anchored by a massive 4x capacity expansion plan, stepping up from the current ~14,000 MTPA to include 36,000 MTPA at Unit 2 (Pyrolysis) and 9,600 MTPA at Unit 3 (Rubber).
Financials That Matter & Capital Efficiency:
Growth & Margins: Total revenue expanded 37.3% YoY to ₹50.01 Cr in FY26, up from ₹36.39 Cr in FY25. Operating leverage has driven substantial margin expansion, with EBITDA rising to ₹16.32 Cr (32.6% margin) and PAT jumping 48.5% to ₹10.50 Cr in FY26 .
Return Metrics & Base: Capital metrics look highly robust, with a reported FY26 Return on Equity (RoE) at 42.29% and Return on Capital Employed (RoCE) swinging up to 25.45%.
Anchor Validations & Issue Structure: The ₹54.27 Cr issue consists entirely of fresh shares with zero promoter exit. Promoters will dilute from 95.84% down to 69.89%. Notably, Bandhan Small Cap Fund has taken a lead participant block within the anchor book.
Valuation vs. Listed Peers
At the upper price band of ₹103, the stock evaluates to a post-issue P/E of ~19.1x based on trailing FY26 earnings, on a post-issue market cap of ₹201 Cr.
The company trades at a fair valuation relative to its immediate sector peer, Lead Reclaim, leaving statistical valuation headroom if the expanded capacities execute cleanly. However, standard comparisons vary as product focus, regional supply-side spreads, and value-added pyrolysis lines alter asset-level structures.
Key Risks & Red Flags
Margin Durability & Cyclicality: The primary monitorable is the sustainability of the current margin profile. EBITDA margins rose sharply from 5.7% (FY24) to 32.6% (FY26). If this expansion is heavily reliant on volatile EPR credit pricing or favorable scrap cycles, margins could face normalization pressures.
Leverage & Geographic Skew: The business carries a post-IPO debt-to-equity ratio of 1.44, which is on the higher side for a micro-cap business. Close to 63% of the IPO proceeds (₹26.70 Cr) are earmarked strictly for debt repayment. Furthermore, its current customer base reflects a significant geographic concentration skew toward the northwestern region of India.
Disclaimer: This analysis reflects my personal tracking ledger and individual portfolio intent. It is shared strictly for educational and informational purposes and does not constitute investment advice. SME IPOs carry significant liquidity and volatility risks; please consult a SEBI-registered professional or do your own thorough diligence before investing.
(2/2) #SMEIPO #HorizonReclaim #CircularEconomy #IPOAnalysis #NIFTY #StockMarketIndia #investing
2
99
Jun 12
🧵IPO Deep-Dive: Susan Electricals India Limited (SME)
My Personal View: I might apply. This stands out as a high-growth industrial play riding strong sectoral tailwinds, backed by a high-quality anchor list. However, the cash conversion cycle is a critical factor that needs careful monitoring before taking a long-term view.
The Vital Numbers & Deal Architecture:
• IPO Window: June 11 – June 15, 2026
• Price Band: ₹120 – ₹127 per share
• Minimum Retail Lot Size: 1 Lot (1,000 shares)
• Total Capital Required: ₹1,27,000
• Listing Gain Potential: Market sources indicate positive momentum, but tracking remains completely unofficial. (Note: GMP tracking is completely unofficial, volatile, and does not guarantee actual listing day performance).
(1/2)
#SMEIPO #SusanElectricals #IPOAnalysis #NIFTY #StockMarketIndia #investing
May 30
I've found IPO investing to be one of the most rewarding opportunities in the market, but IPOs are a lot like mining.
Most people focus on the shiny marketing. Few are willing to dig deep enough to find the real gems. Every IPO comes with a compelling story. Not every IPO comes with a compelling business.
I'll be sharing my research and framework on every notable IPO that hits the market.
Expect:
• What the company actually does
• Financials that matter (growth, margins, debt)
• Valuation vs. listed peers
• Key risks & red flags
• Listing gain potential vs. long-term thesis
• Businesses worth owning, and those worth avoiding
The goal isn't to apply for every IPO. The goal is to identify the rare businesses that can create wealth long after the listing day excitement fades.
No hype. No blind subscriptions. Just structured IPO research. If you're serious about IPO investing, follow along. 📌
1
1
4
213
Jun 12
🧵Susan Electricals: Financials, Peers & Red Flags
What the Company Actually Does & Long-Term Thesis:
Susan Electricals manufactures aluminium and copper-based electrical winding wires, stranded conductors, and power cables used heavily in power distribution, transformers, and grid modernization. The business is a natural beneficiary of government infrastructure pushes like Saubhagya 2.0 and the RDSS scheme. Additionally, a planned 60% capacity expansion into higher-margin Medium Voltage Covered Conductors (MVCC) provides a strong structural growth narrative.
Financials That Matter & Capital Efficiency:
Growth & Margins: Revenue exploded from ₹103.48 Cr in FY24 to ₹269.35 Cr in FY26 (a clean ~61.2% CAGR). EBITDA surged to ₹32.08 Cr in FY26 as operating leverage kicked in, expanding EBITDA margins from 3.51% to 11.91%. PAT grew to ₹18.25 Cr.
Return Metrics & Base: Capital efficiency looks top-tier on paper, with an extraordinary FY26 RoE of 64.64% and RoCE at 29.05%. Customer concentration has also dropped significantly, with the top client falling from ~39.72% down to 9.70% of revenue, diversifying their risk base.
Anchor Validations: The ₹19.34 Cr anchor book locked in premium institutional participants at the ₹127 cap. Marquee names include Motilal Oswal Finvest, SageOne Flagship Growth Fund, and Vikasa India EIF.
Valuation vs. Listed Peers
At the upper price band of ₹127, the stock trades at roughly 14x trailing FY26 earnings and is estimated at ~8x FY27E based on forward working capital deployment.
The issue is priced to leave visible valuation headroom relative to listed cable and wire peers trading at higher industry multiples. However, direct comparisons are limited as peer firms vary considerably in raw material hedging capability, value-added product mix, and capacity utilization.
Key Risks & Red Flags
Cash Flow Disconnect: The most vital red flag is cash conversion. Despite generating a cumulative PAT of ₹24.65 Cr over the last three years, cumulative operating cash flow (CFO) stands deep in the negative at -₹33.60 Cr.
Working Capital Pressures: High growth is currently being funded by bank debt and working capital limits rather than organic cash flow. Trade receivables climbed from ₹13.02 Cr to ₹46.30 Cr in two years, and short-term borrowings have accelerated to ₹65.18 Cr. There is also an outstanding GST litigation penalty of ₹8.91 Lakhs under appeal.
Disclaimer: This analysis reflects my personal tracking ledger and individual portfolio intent. It is shared strictly for educational and informational purposes and does not constitute investment advice. SME IPOs carry significant liquidity and volatility risks; please consult a SEBI-registered professional or do your own thorough diligence before investing.
(2/2) #SMEIPO #SusanElectricals #IPOAnalysis #NIFTY #StockMarketIndia #investing
2
155
Jun 12
🧵IPO Deep-Dive: Utkal Speciality Industries India Limited (SME)
My Personal View: I am not applying. While the sharp margin expansion and aggressive deleveraging look impressive on paper, the underlying drivers raise a few core flags that make me cautious about sustainability.
The Vital Numbers & Deal Architecture:
• IPO Window: June 10 – June 12, 2026
• Price Band: ₹62 – ₹66 per share
• Minimum Retail Lot Size: 1 Lot (2,000 shares)
• Total Capital Required: ₹1,32,000
• Listing Gain Potential: Market sources reflect muted grey market activity for this issue. (Note: GMP tracking is completely unofficial, volatile, and does not guarantee actual listing day performance)
1/2
#SMEIPO #UtkalSpeciality #IPOAnalysis #NIFTY #StockMarketIndia #investing
May 30
I've found IPO investing to be one of the most rewarding opportunities in the market, but IPOs are a lot like mining.
Most people focus on the shiny marketing. Few are willing to dig deep enough to find the real gems. Every IPO comes with a compelling story. Not every IPO comes with a compelling business.
I'll be sharing my research and framework on every notable IPO that hits the market.
Expect:
• What the company actually does
• Financials that matter (growth, margins, debt)
• Valuation vs. listed peers
• Key risks & red flags
• Listing gain potential vs. long-term thesis
• Businesses worth owning, and those worth avoiding
The goal isn't to apply for every IPO. The goal is to identify the rare businesses that can create wealth long after the listing day excitement fades.
No hype. No blind subscriptions. Just structured IPO research. If you're serious about IPO investing, follow along. 📌
1
4
94
Jun 12
🧵 Utkal Speciality: Financials, Peers & Red Flags
What the Company Actually Does & Long-Term Thesis:
Utkal Speciality Industries is an Odisha-based manufacturer of specialty food ingredients, paper-based products, and packaging materials. The business model has deep customer stickiness, with repeat clients contributing a substantial 88.57% of revenue in recent months. However, the company has completely stopped exporting products and currently operates exclusively in the domestic market, making its long-term expansion heavily dependent on local demand shifts.
Financials That Matter & Capital Efficiency:
Growth & Margins: Total income rose modestly from ₹46.2 Cr in FY23 to ₹50.3 Cr in FY25, with 9M FY26 coming in at ₹40.9 Cr. However, profitability has grown exponentially: EBITDA more than doubled to ₹10.9 Cr in FY25, driving EBITDA margins up from 9.9% to 22.38%. PAT hit ₹6.68 Cr in FY25.
Return Metrics: Balance sheet quality has improved through significant deleveraging, with Debt/Equity dropping from 2.13x to 0.63x and Net Worth scaling to ₹27.1 Cr. Post-issue RoE stands at an annualized ~35.18%.
Issue Structure: This is a 100% Fresh Issue of up to 52.34 lakh shares raising ₹34.54 Cr to fund new plant capex and working capital. Promoters are not cashing out.
Valuation vs. Listed Peers
At the upper band of ₹66, the stock is being valued at a trailing P/E of ~20.48x on FY25 earnings, which jumps to ~26.31x on annualized 9M FY26 numbers.
It trades at a structural discount to larger packaging and ingredient peers who average higher multiples, leaving a statistical valuation headroom. However, direct comparison is limited as peer companies differ vastly in operational scale, production capacities, and individual segment margins.
Key Risks & Red Flags
Margin Sustainability vs. Volume Growth: The core risk is that value creation has come entirely from margin expansion rather than explosive top-line growth. If high margins normalize due to input cost pressures, the current valuation structure has a tight margin of error.
Governance & Related Party Overlaps: The RHP highlights incomplete historical documentary verification for certain director experiences. Furthermore, there are operational overlaps and related-party transactions with group companies like Shiv Shankar Trading Co. in similar business lines.
Disclaimer: This analysis reflects my personal tracking ledger and individual portfolio intent. It is shared strictly for educational and informational purposes and does not constitute investment advice. SME IPOs carry significant liquidity and volatility risks; please consult a SEBI-registered professional or do your own thorough diligence before investing.
2/2
#SMEIPO #UtkalSpeciality #IPOAnalysis #NIFTY #StockMarketIndia #investing
2
55