
Editor in chief at @GeusBulletin the flagship #openaccess journal by Geological Survey of Denmark and Greenland 🇩🇰 🇬🇱 Tweets are my own etc. #scicomm #climate
Joined February 2016
- Tweets 1,249
- Following 932
- Followers 430
- Likes 3,772
182 Photos and videos


3 Jul 2025
Are you our next Journal Manager?📚👩💻👨💻 GEUS is looking for part-time maternity cover for our flagship open access journal. You'll be supporting the editorial team and acting editor in chief to publish quality regional Earth Science research. Apply here: candidate.hr-manager.net/App…
57
Catherine Jex retweeted

6 Sep 2024
#NewResearch published in GEUS Bulletin: Early Cenomanian ammonites from East and North-East Greenland doi.org/10.34194/geusb.v57.8… #fossils #geology #Greenland #ammonites #palaeobiogeography #Cretaceous #taxonomy #OpenAccess
2
1
99
Catherine Jex retweeted

26 Jul 2023
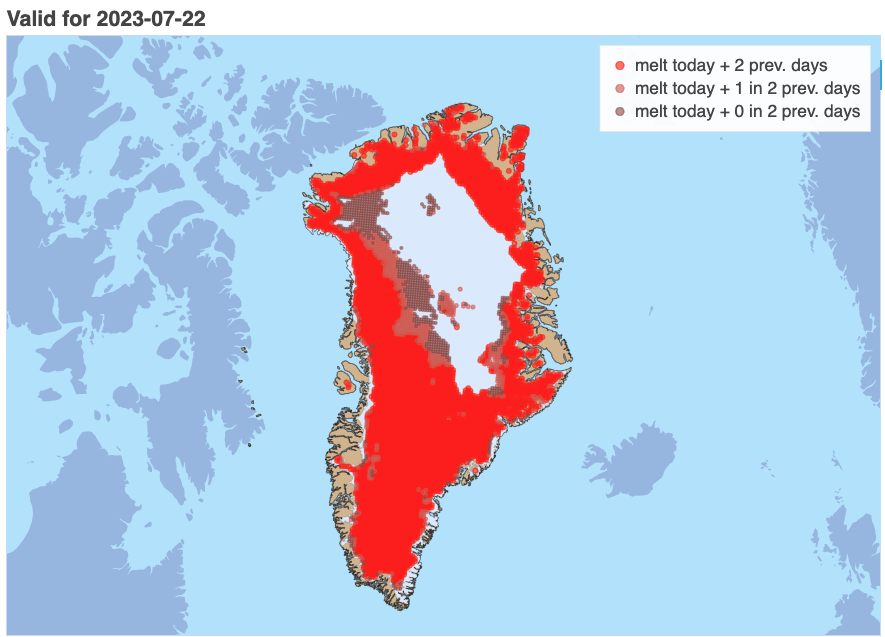
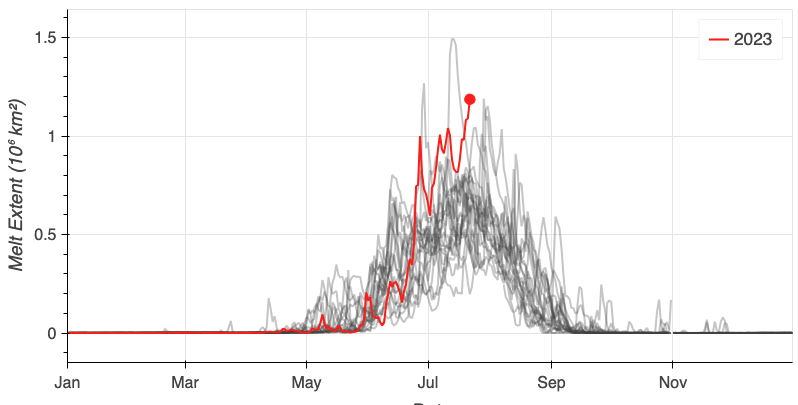
gladly, the heatwave fades in the following days according to @PromiceGL ground measurements...
melting persisting at lower elevations, e.g. at SWC_O
26 Jul 2023

third day in a row of *record high* Greenland wet snow area (20 to 22 July), with melting detected 22 July at the Summit station above 3200 m (10,500 feet) elevation.
HT @gsnowph
3
15
36
4,776
Catherine Jex retweeted

The @DiamasProject has released the first findings from their Institutional Publishing Survey👇
For the full blog post, click here: diamasproject.eu/early-impre…
24 Jul 2023

📊🌐 Early impressions from the DIAMAS Institutional Publishing Survey! 📊🌐
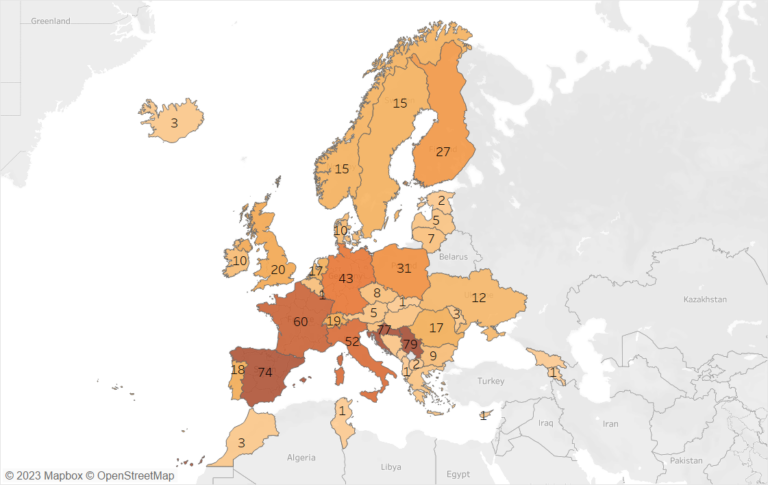
After weeks of data cleaning, we have 685 valid responses from 43 countries in the European Research Area 🧵 1/5
3
6
837
Catherine Jex retweeted

26 Jul 2023
insane flooding rain to Greenland - rapids in an atmospheric river youtu.be/Tua4p9ns2JY via @YouTube
3
3
417
Catherine Jex retweeted

27 Jul 2023
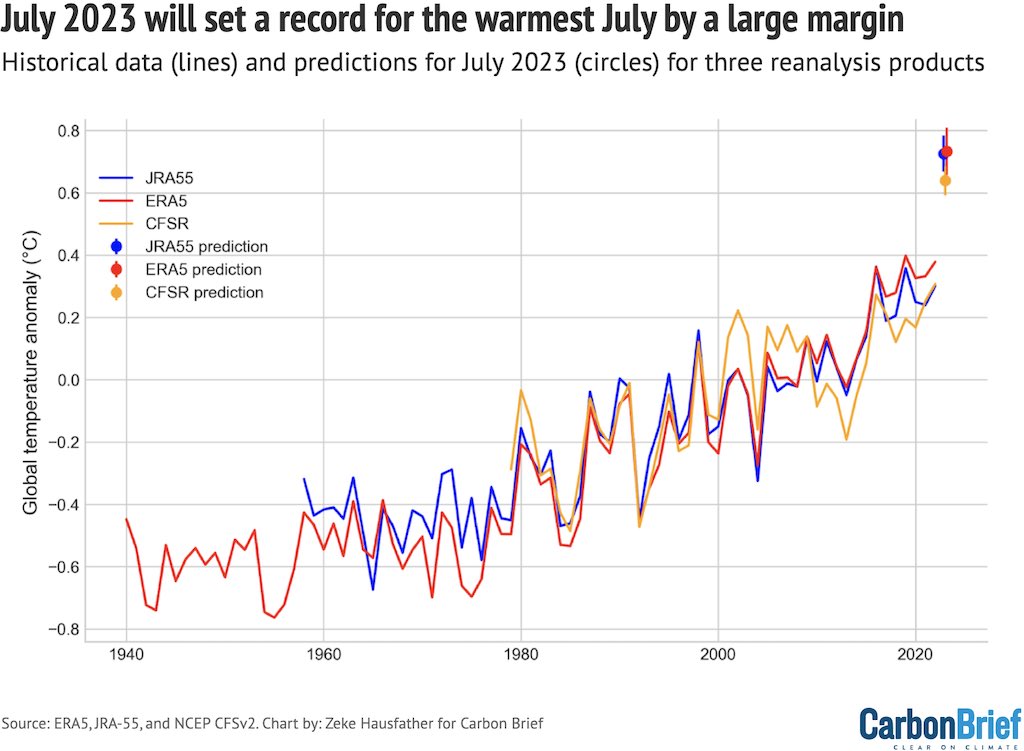
To say that global temperatures in July have been exceptional is an understatement. The monthly is on track to shatter the prior July record by a massive margin, be the warmest month in terms of both absolute temperatures and anomalies.
87
444
926
338,102
1 Jul 2023
👏👏👏👏👏
1 Jul 2023

83
19 Jun 2023
First time at a PKP sprint! #pkpcph2023 Looking forward to seeing what (if anything?!) I can contribute to this community behind the amazing open source journal platform from @pkp 🧐🤓
19 Jun 2023

Our editor in chief @CathJex is looking forward to joining the @pkp Copenhagen Sprint #pkpcph2023 tomorrow! A 2-day meeting of publishers, editors & developers to work on the #openSource #OJS journal platform. Event supported by @CrossrefOrg
2
545
Catherine Jex retweeted
19 Jun 2023
🚨 🚨 Open call for papers to @GEUSBulletin in 2023 🚨 🚨
geusbulletin.org/index.php/g… We invite submissions of papers on any aspect of geoscience research in Denmark, Greenland & the Arctic region. 🧵
1
2
2
352

Are you paying attention? Last month observed the hottest May global sea surface temperatures on record...
[Data from psl.noaa.gov/data/gridded/da…]
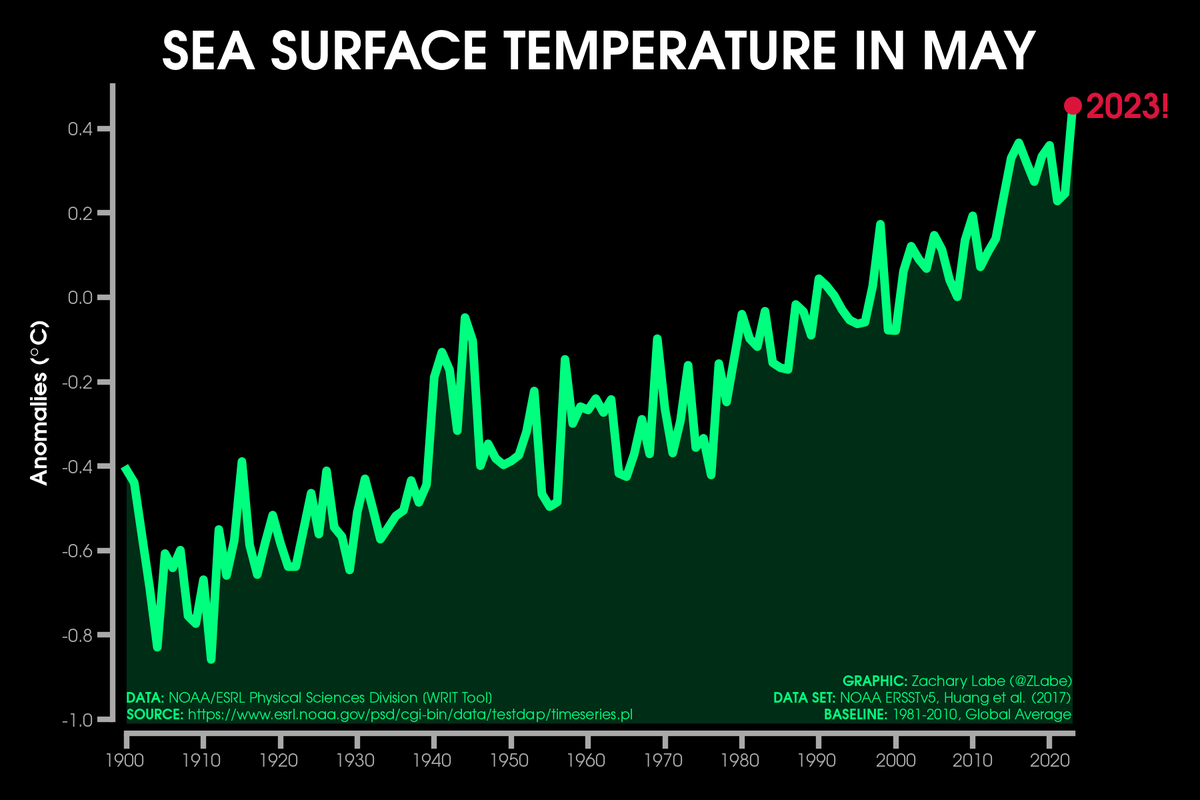
ALT Green line graph time series of average sea surface temperature anomalies for Mays from 1900 through 2023. There is large interannual variability, but an overall long-term increasing trend. Anomalies are computed relative to a 1981-2010 baseline.
98
527
1,236
140,119
Catherine Jex retweeted

2 Jun 2023
📢📢📢 The Department of Geoscience at @AarhusUni_int @NatSci_AU has just announced THREE open #tenuretrack positions!
#quaternarygeology #hydrogeology #petrology
Please share far and wide - it's a great department in an amazing city 🇩🇰
See below for more info:
2
41
36
11,298
Catherine Jex retweeted

2 Jun 2023
More than 90%of the warming from human-caused climate change has occurred in the ocean. Increasing ocean heat content is contributing to sea level rise, ocean heat waves, coral bleaching, and melting of ocean-terminating glaciers and ice sheets.
climate.gov/news-features/un…
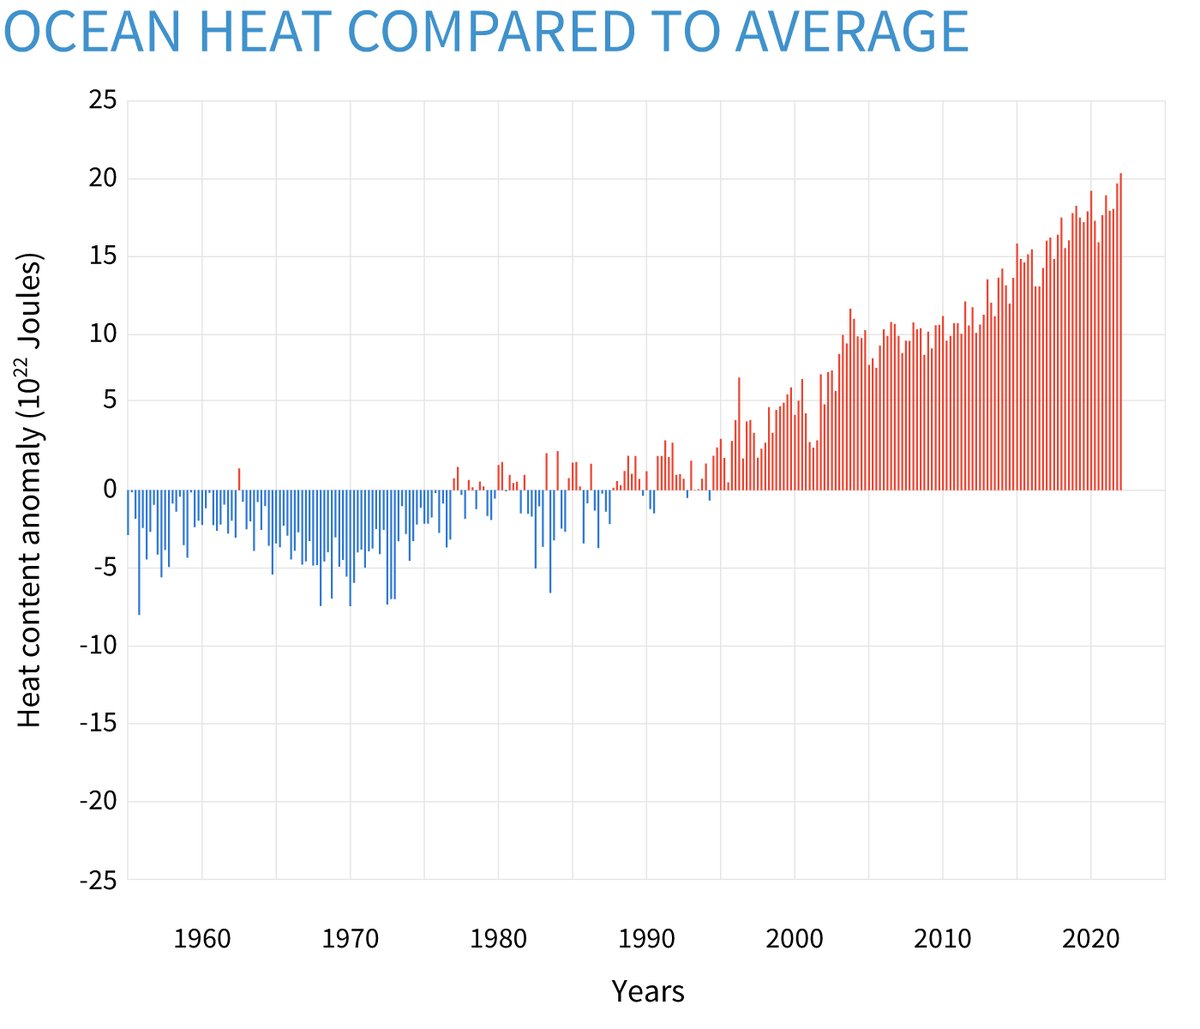
ALT Bar graph from 1950-2022 of Ocean Heat content compared to average. Blue lines from 1950-1970s indicate below-average amounts of ocean heat. Reds from 1990 onward indicate above-average ocean heat content. The most recent year had the highest amount of ocean heat on record.
346
407
691
154,857
Catherine Jex retweeted

3 Jun 2023
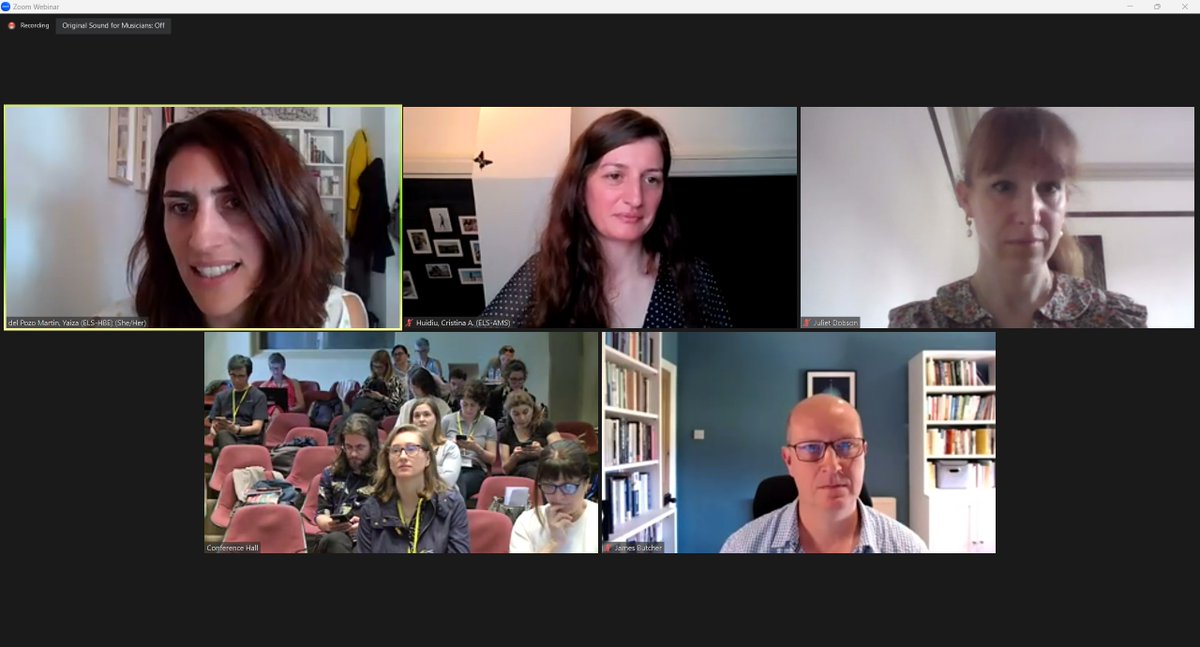
Saturday morning @EASEeditors conference sessions!
Starting with Digital Tools then metrics and journal development.
3 Jun 2023

Yaiza del Pozo Martin introduces our next session on making use of a range of metrics to inform journal development, with @CristinaHuidiu, @Journalologist , and @Juliet_hd
#EASEevents #JournalMetrics
2
4
285
3 Jun 2023
I’m very happy to be associated with 2 excellent diamond 💎 #openaccess journals @GeusBulletin and @Eur_Sci_Ed. Looking forward to contributing to their ongoing growth and success with their dedicated teams of editors, reviewers and authors. 💎💎👍👍
2 Jun 2023
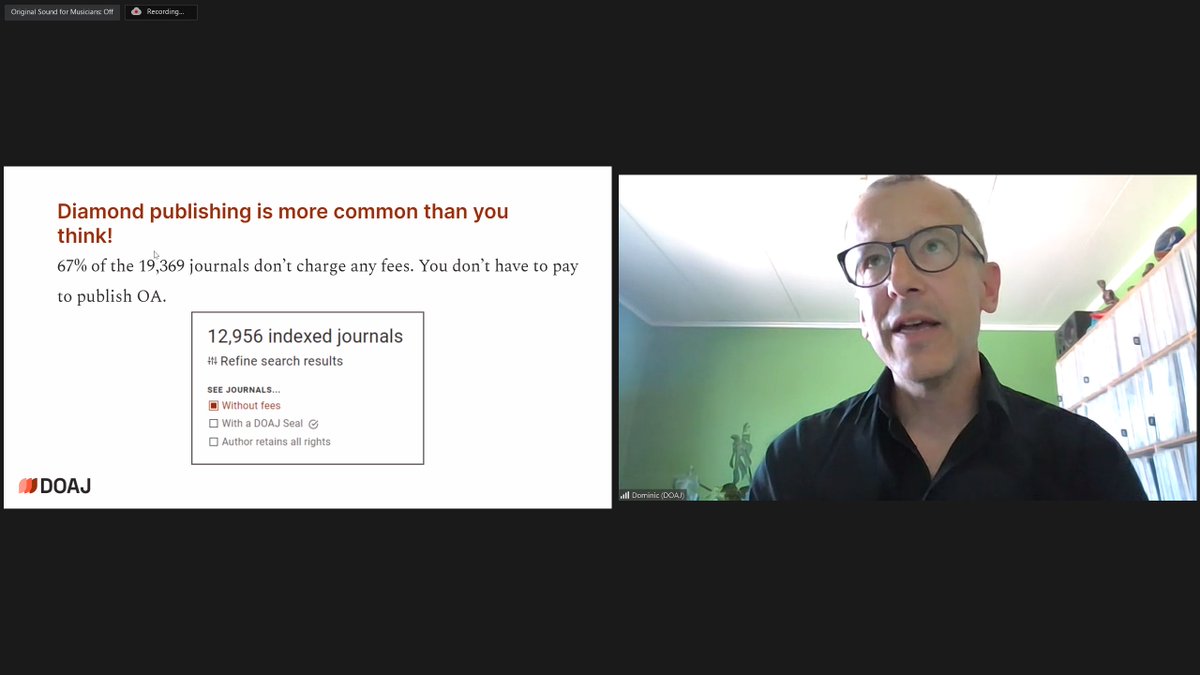
- @dominicm thre is a great misconception that OA = Author Pays. Diamond publishing is more common than people think - 67% of journals indexed in DOAJ are 💎
EASE journal @Eur_Sci_Ed is of course, a diamond open access journal!
ese.arphahub.com/
2
5
424

Catherine Jex retweeted

3 Jun 2023
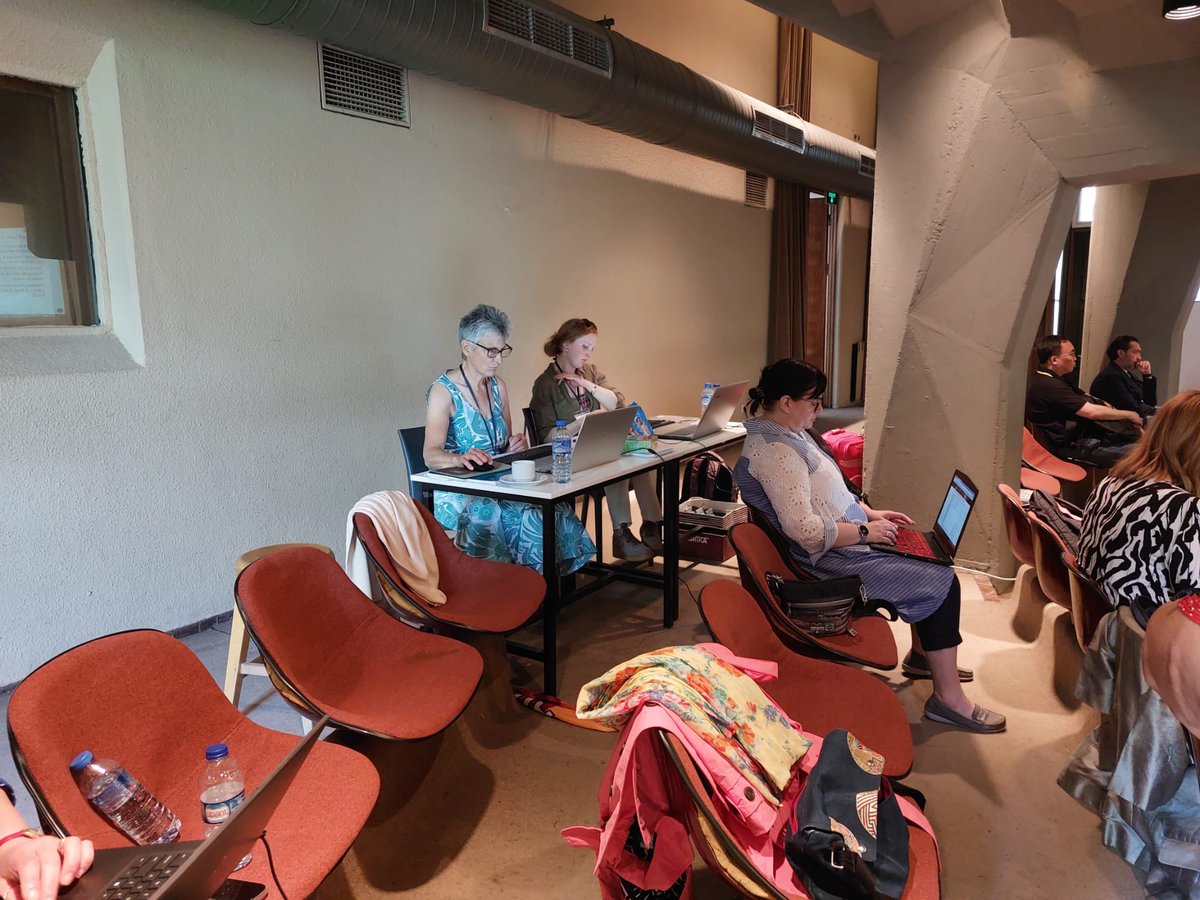
#Day3 backstage 💪
A big shoutout to the incredible backstage team at the conference.
#EASEevents
1
1
3
241
Catherine Jex retweeted
3 Jun 2023
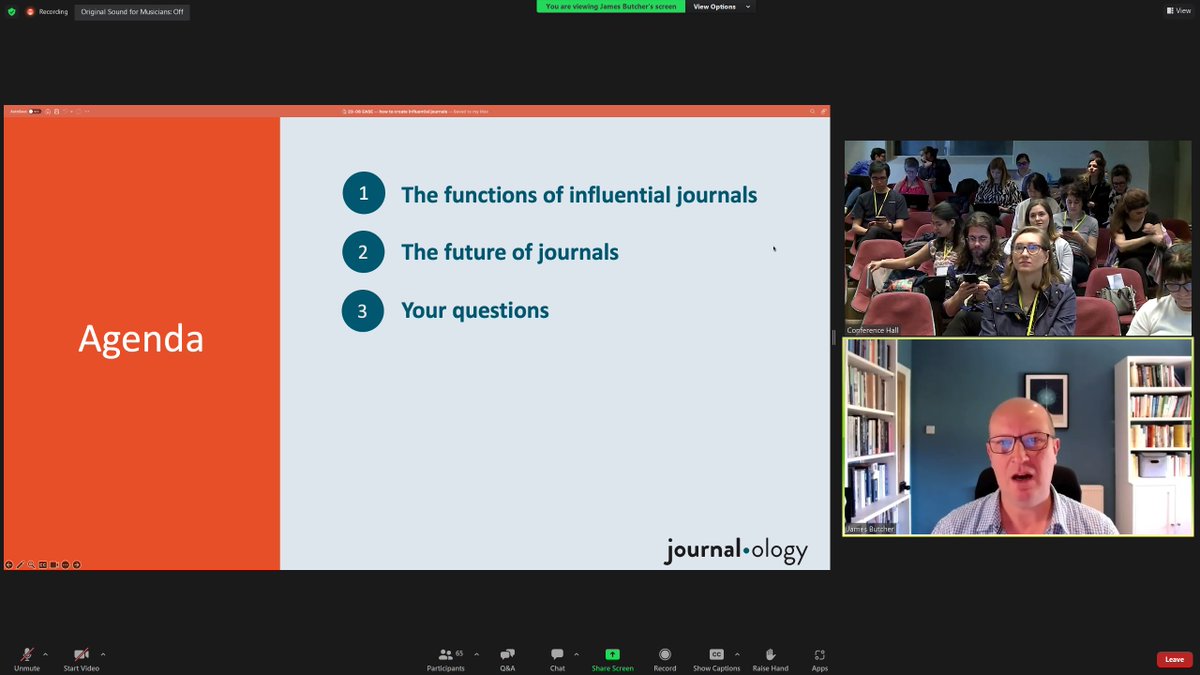
- @journalology – about to deliver a crash course in creating influential journals, and then questioning where we might be heading in the future,
discussing concepts of journals to enhance and amplify research, and provide community leadership, advocacy among other features.
2
1
128
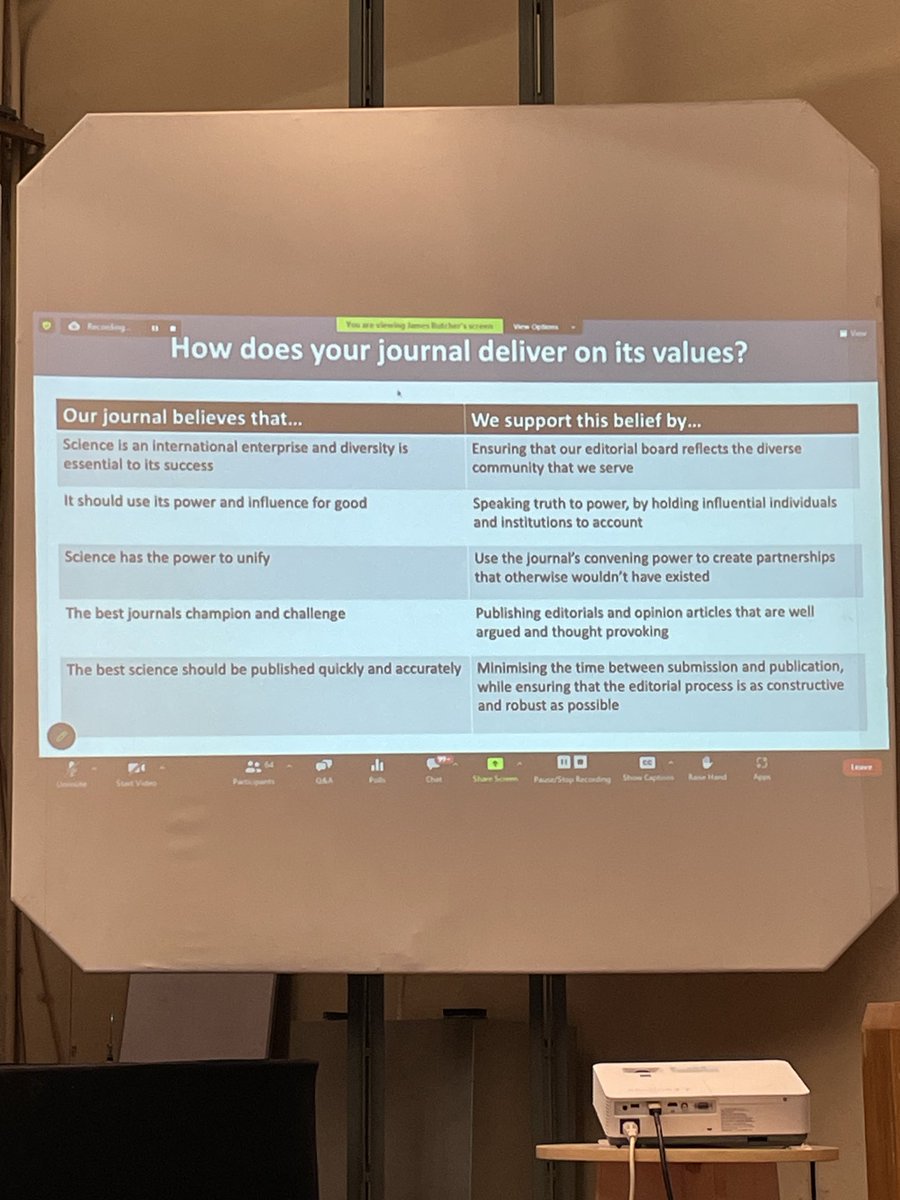
3 Jun 2023
Interesting homework for journals given by James Butcher @EASEeditors conference in Istanbul… something to discuss with the team @GeusBulletin 🧐
3
2
267
Catherine Jex retweeted
3 Jun 2023
Dyke - researchers main job is developing the research and providing us with results. Writing is not easy or everyone's skill, so writing support is needed.
AI tools are helping with more and more of this - but need to be used with caution.
1
1
188