
Market insights and proprietary institutional-grade risk management systems, strategy creation engines, and TradingView indicators. Not financial advice.
Joined January 2026
- Tweets 1,527
- Following 200
- Followers 107
- Likes 1,371
793 Photos and videos


Pinned Tweet

Jun 5
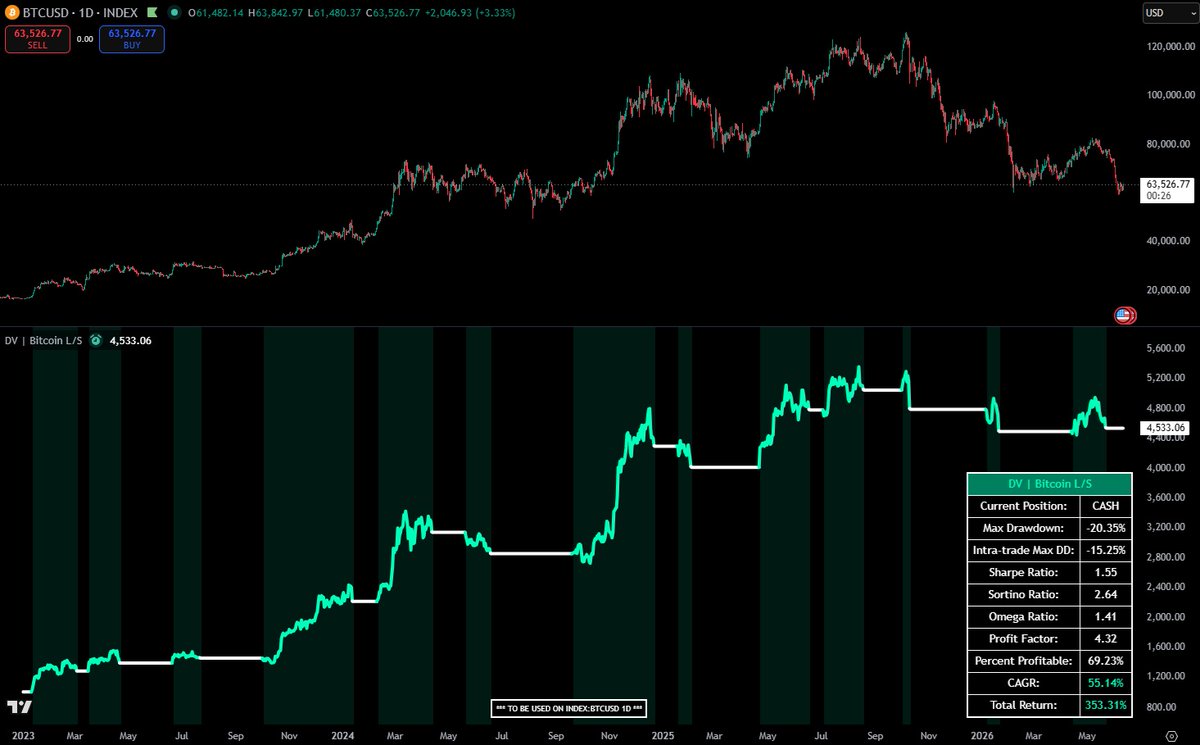
The systems have saved us from this recent 15% drop. In fact, the system is only down 15% from the peak, compared to Bitcoin's 50% drawdown.
Being in cash while Bitcoin continues its decline is a beautiful thing.
It helps us preserve capital but also prevents us from having to go through the emotional turmoil associated with that loss of capital.
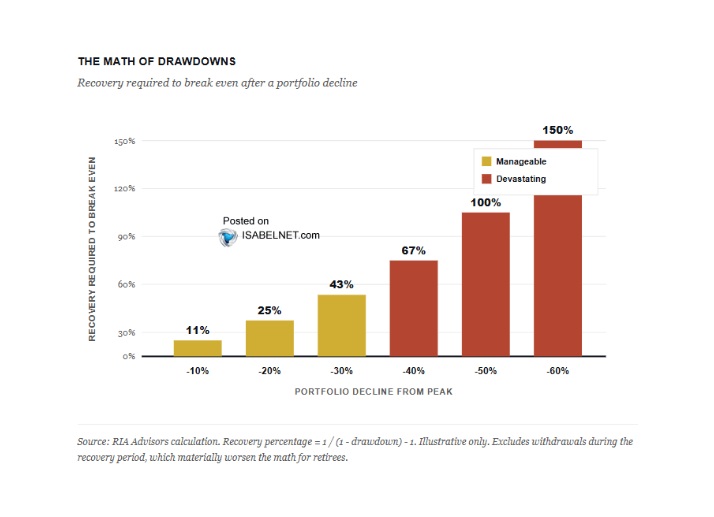
Why is capital preservation so important?
That is because it takes far larger gains to recover whatever you lose.
A 10% loss requires 11% to break even.
A 20% loss requires 25%.
A 50% loss requires 100%.
And a 60% loss requires 150%.
A 10% loss is not so hard to recover from, requiring only 1% more than you lost to get to breakeven. But the bigger your losses, the larger the multiples required to get it back.
By utilizing systems to cut to cash and sidestep these deep distribution tails, we avoid the trap of compounding losses, ensuring we preserve our capital to exploit the next high-probability market cycle.
#Crypto #Bitcoin #Systems #RiskManagement #DontLose
3
94
Jun 12
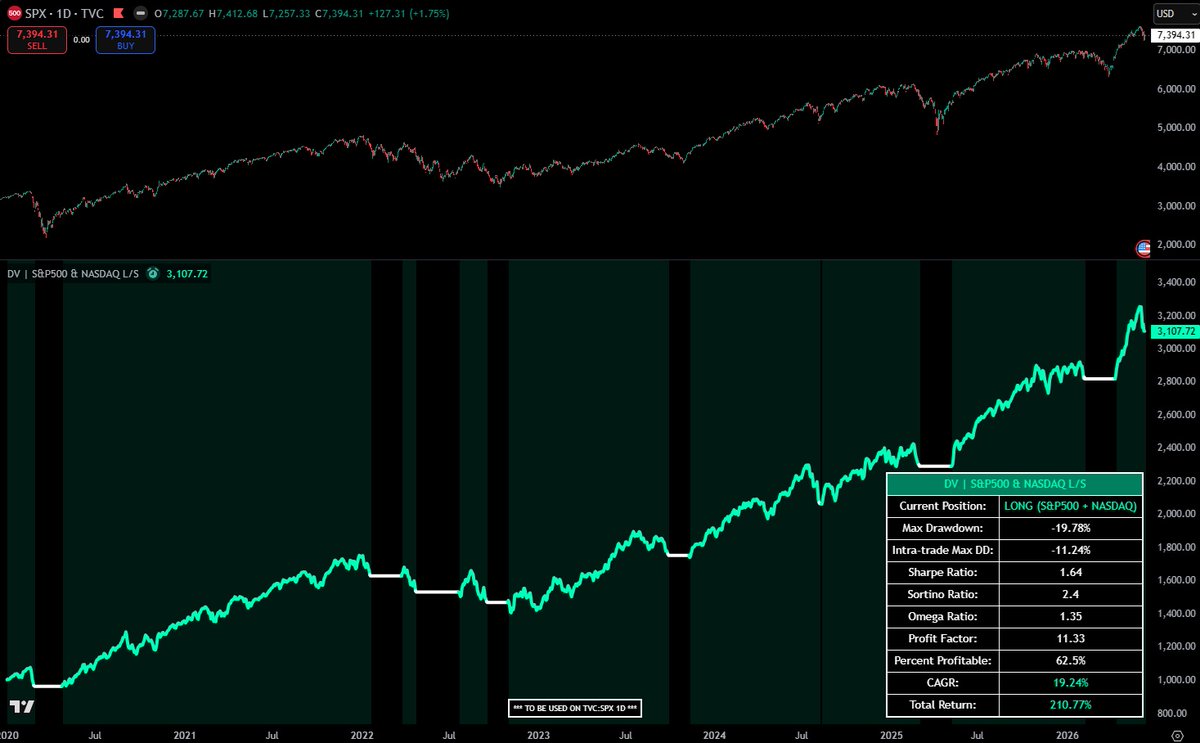
While our crypto portfolio sits in cash, our stock portfolio is doing the lifting.
Our cash positions in crypto have helped us avoid the large drawdowns associated with Bitcoin and the even larger drawdowns in alts.
At the same time our stock positions helped us capture the rebound as the market recovered from the geopolitical shock and energy supply crunch of the Iran war dump.
These systems help us to maximize upside capture in bull markets and minimize downside capture in bear markets. keeping us exposed to extreme left-hand tails while removing right-hand tail risk.
For access, go to: whop.com/dv-analytics
#Stocks #Crypto #SP500 #NASDAQ #Bitcoin #RiskManagement
1
53
Jun 11
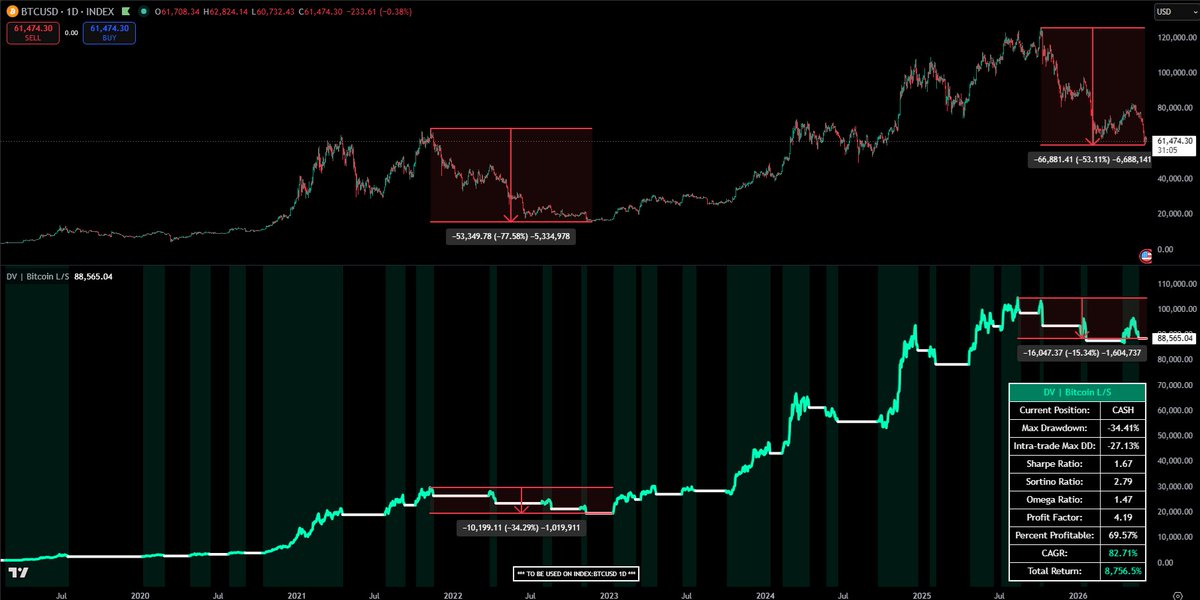
Have you round-tripped the cycle again?
I'll admit, I didn't think the 4-year cycle was going to play out, but it seems to be.
Anyone else who had a similar theory or didn't have the correct risk management systems to follow has likely round-tripped another cycle.
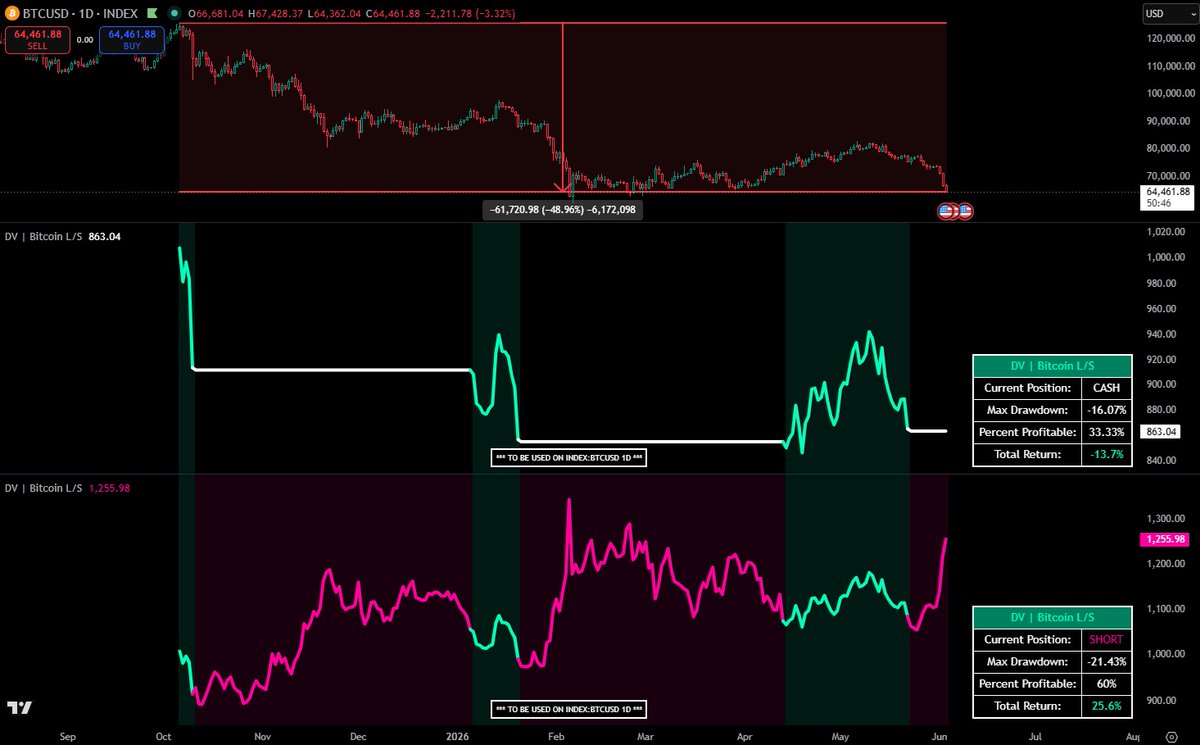
The 2022 bear market had Bitcoin drop more than 75%, while the Bitcoin L/S system sustained a drawdown of less than 35%. That's less than half.
During this drawdown from all-time highs, Bitcoin has gone through a greater than 50% drawdown, while the Bitcoin L/S system has taken a mere 15% drawdown. That's less than one third of Bitcoin's drawdown.
If you round-tripped this cycle, just like the last one, it might be time to find some proper risk management systems.
whop.com/dv-analytics
#Crypto #Bitcoin #RiskManagement
bitcoin:native
2
21
Jun 10
According to our Crowding Model, the majority of tracked cryptocurrencies continue to sit deep within the Oversold: Puking Lows quadrant.
This positioning represents a market state defined by an absence of upward price momentum and sustained, negative fund flows.
Until capital flows shift and assets begin migrating out of this lower quadrant, any short-term price spikes lack the structural backing required for a sustained trend reversal.
#Crypto #Bitcoin #Crowding
2
23
Jun 10
The S&P 500 and NASDAQ are rolling over due to a number of factors.
Valuation Fatigue
Sticky Inflation
Hot Labor Market
We are currently in profit on our equity positions, but underlying breadth and momentum are deteriorating.
If this breakdown continues, the system will lock in our accumulated gains and rotate our exposure to cash.
#Stocks #SP500 #NASDAQ
1
5
129
Jun 10
Is the bottom in?
According to the global liquidity rate of change and seasonality, no.
The global liquidity RoC is a leading indicator of Bitcoin's price direction and is currently suggesting that there is more downside ahead over the next month.
Seasonality is also showing us that we may be able to expect more downside over the coming 2 weeks and should not expect to see some positive price action for another month, in line with the global liquidity RoC.
#Crypto #Bitcoin
bitcoin:native

2
33
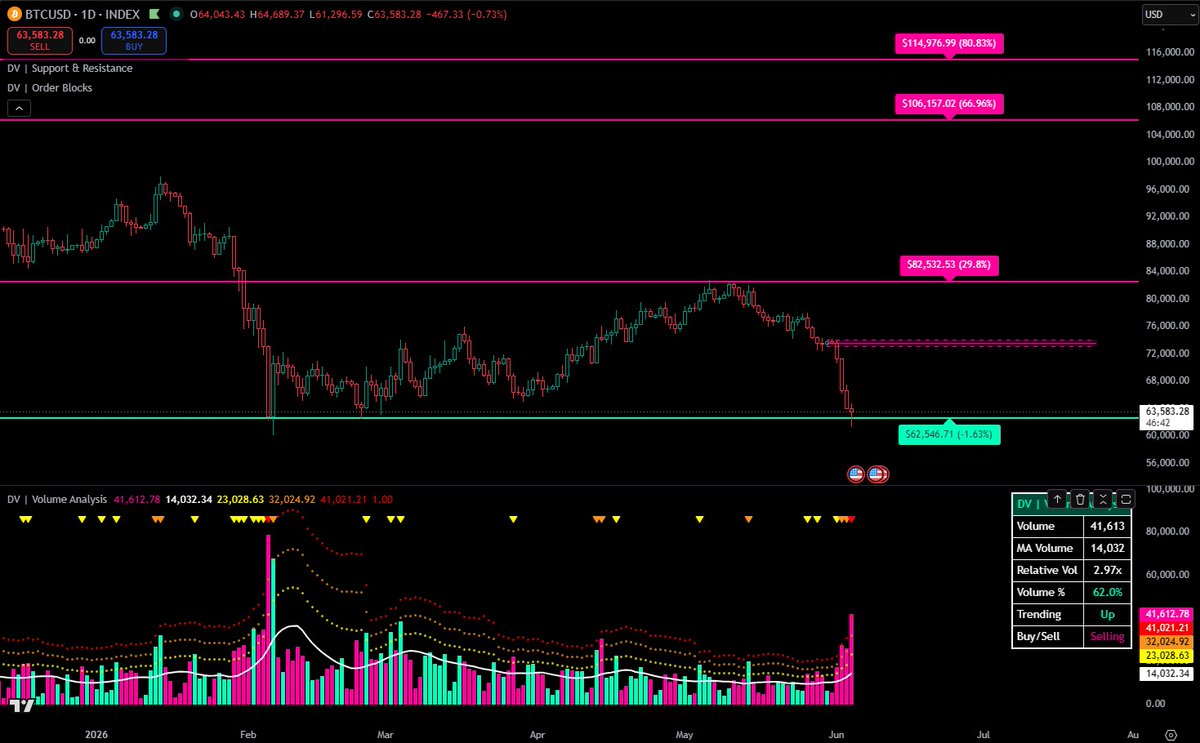
Jun 8
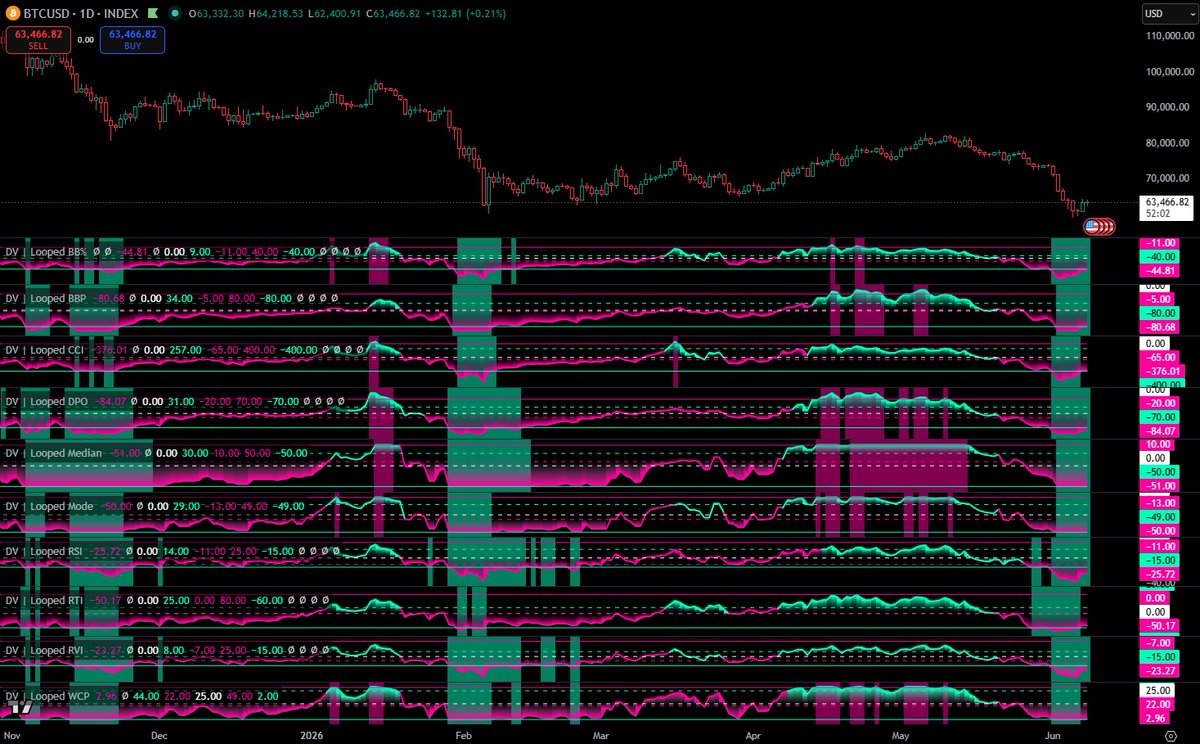
Bitcoin is flashing deeply oversold signals across virtually every technical indicator within both our Master and Looped Series.
Bitcoin dipped below support at $62,500 and has since closed back above the level. This reclaim was driven by the activation of a bullish order block formed after the flush down below $60k, confirming a dense pocket of demand.
While buyers have successfully dominated the aggregate volume profile over the last two days, the move currently lacks meaningful conviction. Total volume remains compressed at less than 80% of its 7-day moving average. However, trading volume expanded by 10% compared to the previous day's session.
It's possible that a bottom is in, but it may take time here to hammer out a floor.
Want access to these indicators?
Visit: whop.com/dv-analytics
#Crypto #Bitcoin #Oversold #Volume
bitcoin:native

5
85
Jun 5
Bitcoin has moved back to being undervalued.
The Valuation Suite suggests that Bitcoin has cooled to the slightly undervalued zone with the majority of Z-scores in the negatives and the aggregate Z-score sitting at -0.74.
The Z-score indicator has it at an even deeper value sitting at -2.15, suggesting that the probability of this level occurring by pure chance is less than 2%, highlighting a significant historical deviation from fair value.
And price has been hugging the lower bound of the Standard Deviation Bands during this decline and currently has it sitting at a Z-score of -2.67.
If we take an average of the three, we get an overall Z-score of -1.85, suggesting that Bitcoin is trading in the bottom 3.2% of its historical distribution.
This points to a statistically oversold market state that has historically preceded high-probability relief periods or trend reversals once selling exhaustion confirms.
The probabilities of a reversion to the mean are in our favor.
#Crypto #Bitcoin #Zscore #Statistics
bitcoin:native
5
258
Jun 5
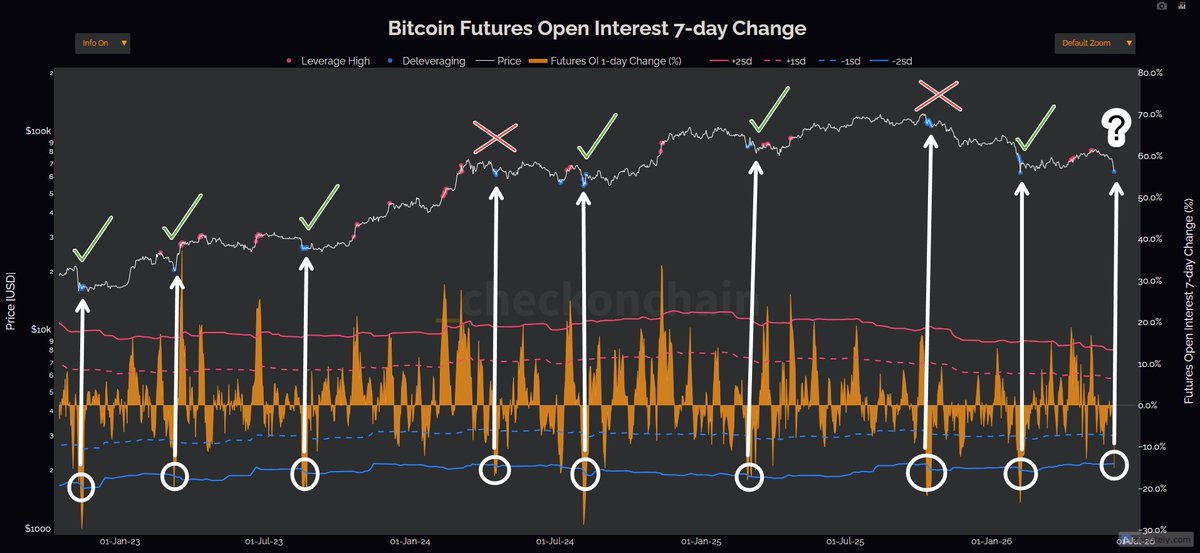
The Bitcoin futures open interest 7D change model is below its -2 standard deviation band.
Historically, this has been a good bottom indicator with a 75% hit rate over the course of this bull market.
2 out of 8 times prices continued to decline following this signal, but 6 out of 8 were at or near bottoms prior to a reversal.
With price as low as it is and a signal like this, you have to ask yourself, is this likely to go lower again, or is this a bottom signal?
#Crypto #Bitcoin #OI #BottomSignal
2
43
Jun 5
Selling has been increasing over the past week, led by forced selling due to longs being liquidated.
Volume has been dominated by sellers and is almost 3x above its average and has increased over the last 5 days with a 1 sigma event, two 2 sigma events, and culminating in a 3 sigma event over the past 24 hours.
This has brought Bitcoin down to its current support level at $62,500, and price has been bouncing around there for the past 24 hours as buyers step in to arrest this recent decline and try to put in a floor.
Let's see if support can remain as support.
#Crypto #Bitcoin #Volume #Support #Resistance
3
38
Jun 5
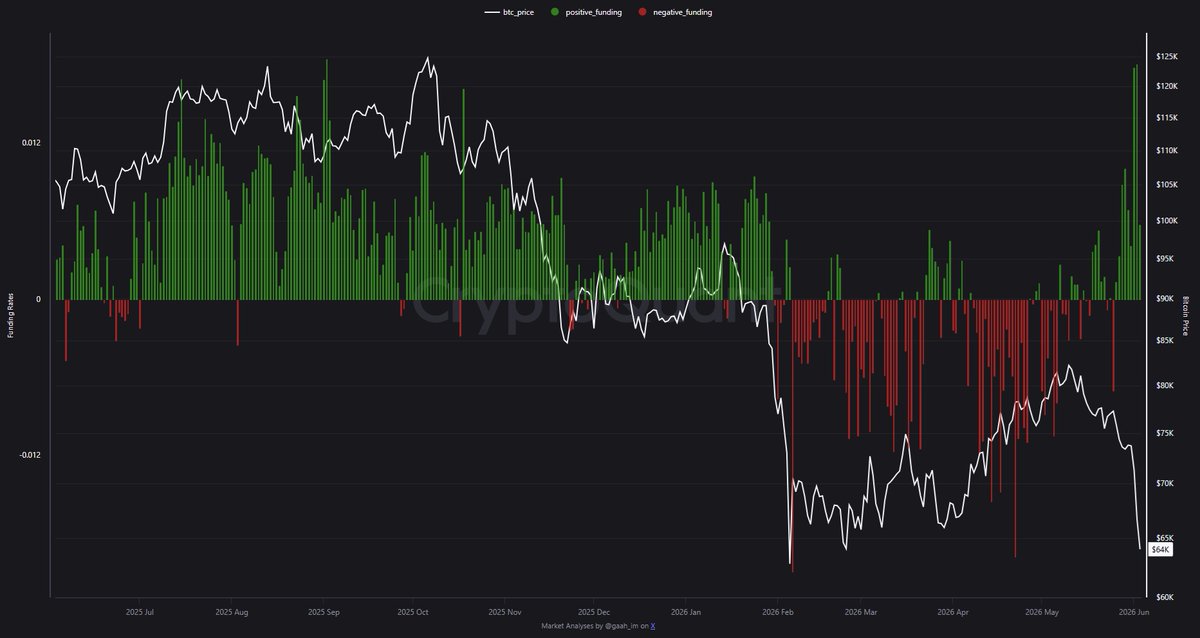
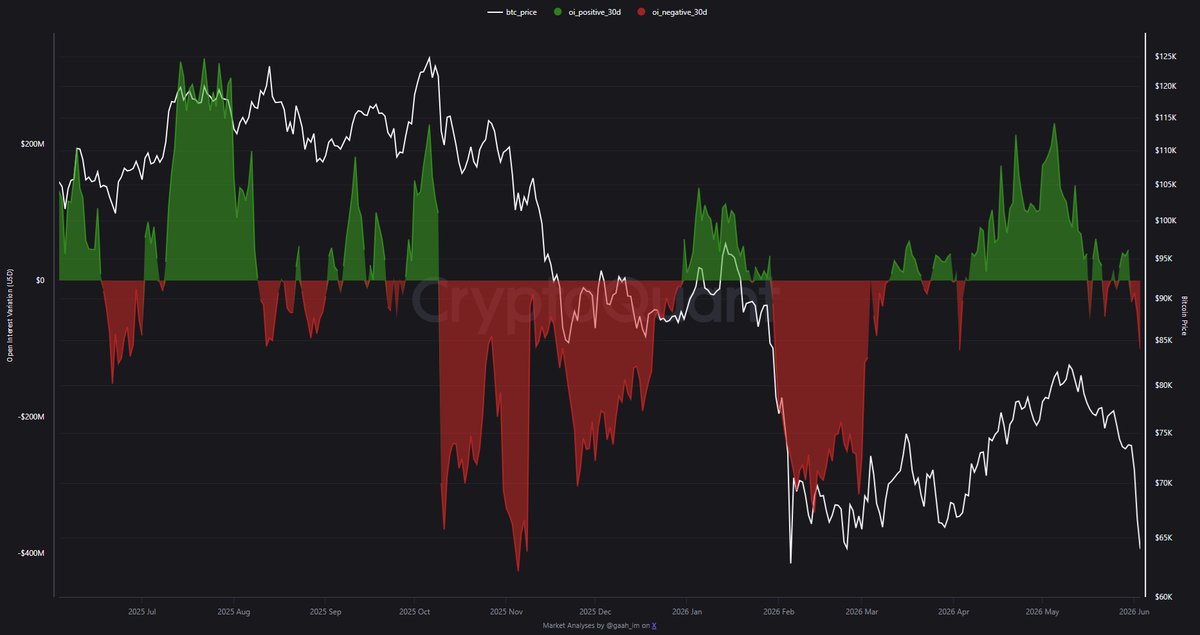
Funding rates (FR) are starting to cool.
At the same time open interest (OI) is dropping off.
FR dropping means leveraged long traders aren't willing to pay a premium in order to keep their positions open anymore.
OI dropping means fewer new positions are being opened in the futures market.
What does this tell me?
The data indicates that the large number of long positions that were opening up and fueling this recent decline are starting to subside.
Leveraged long traders have been hammered and are starting to lick their wounds rather than come back for more pain.
Does this mean the pain is over?
Unlikely.
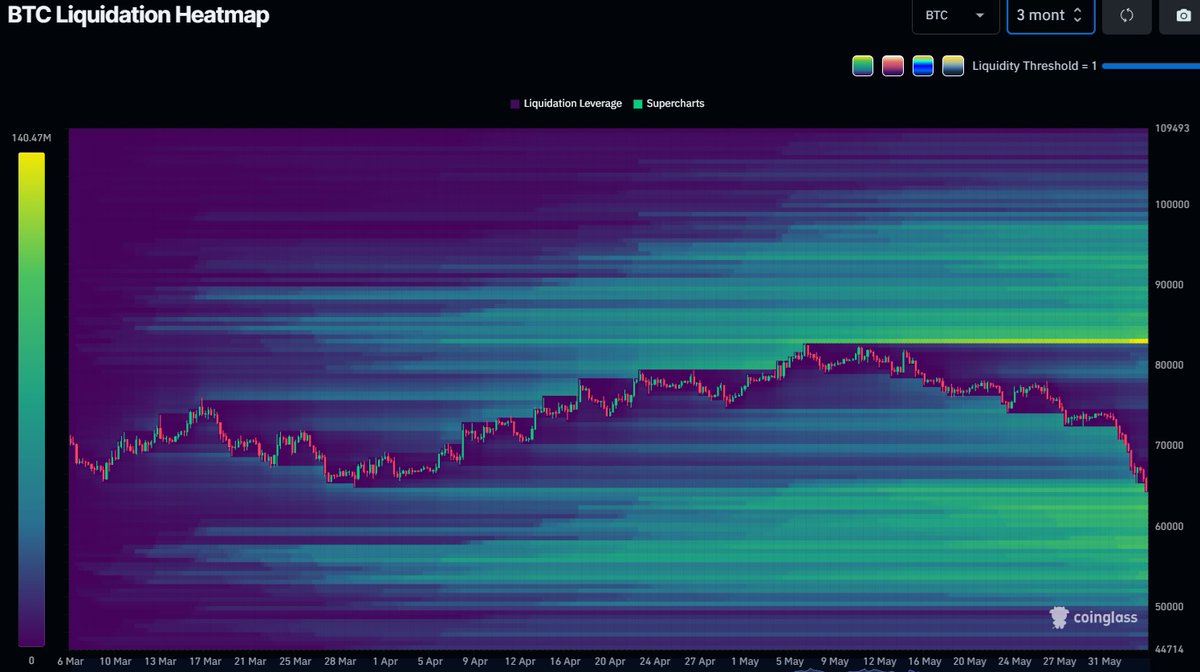
While fewer positions are being opened, of the positions that are, we can see on the liquidation maps posted in an earlier post that there are still a lot of leveraged traders attempting to long the bottom.
And the higher timeframe liquidation maps are still heavily stacked to the downside.
This means we could have some sideways chop, or perhaps even another drop, before the market has put in its floor.
#Crypto #Bitcoin #OnChain #Funding #oilmassage
bitcoin:native
2
26
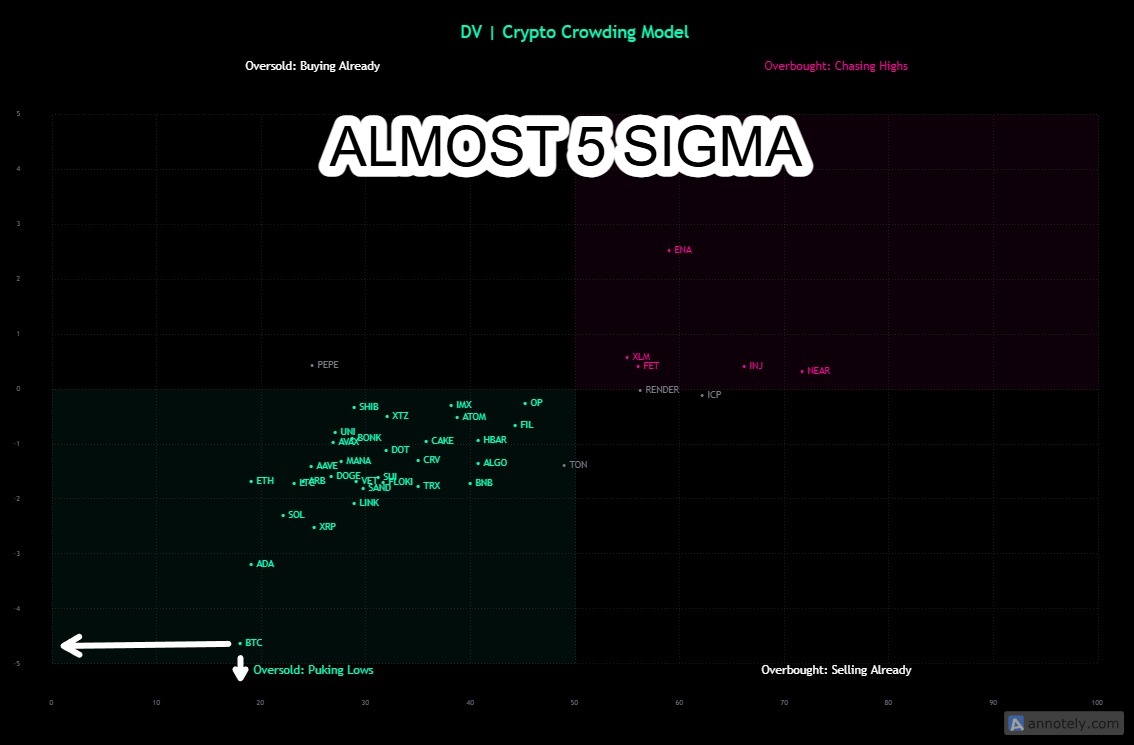
Jun 4
An almost 5 sigma event!
The crowding model plots the RSI and the Z-score of fund flows for an asset.
Currently the amount of funds flowing out of Bitcoin is an almost 5 standard deviation (sigma) event.
In a standard normal distribution, this kind of event is a 1-in-a-million event.
This means it should mark the end of this recent nuke, and the majority of sellers exiting the market have already done so.
This doesn't mean that we are going to V-reverse from here. Momentum could cause price to drag sideways while the market hammers out a floor.
But the probabilities of a floor are in our favor.
#Crypto #Bitcoin #Crowding #5Sigma
2
43
Jun 4
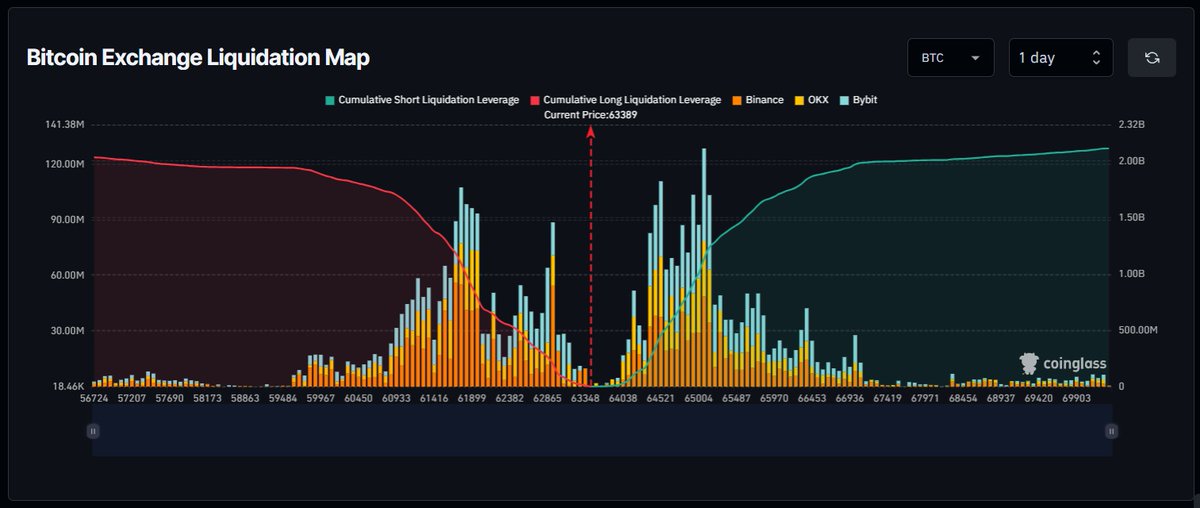
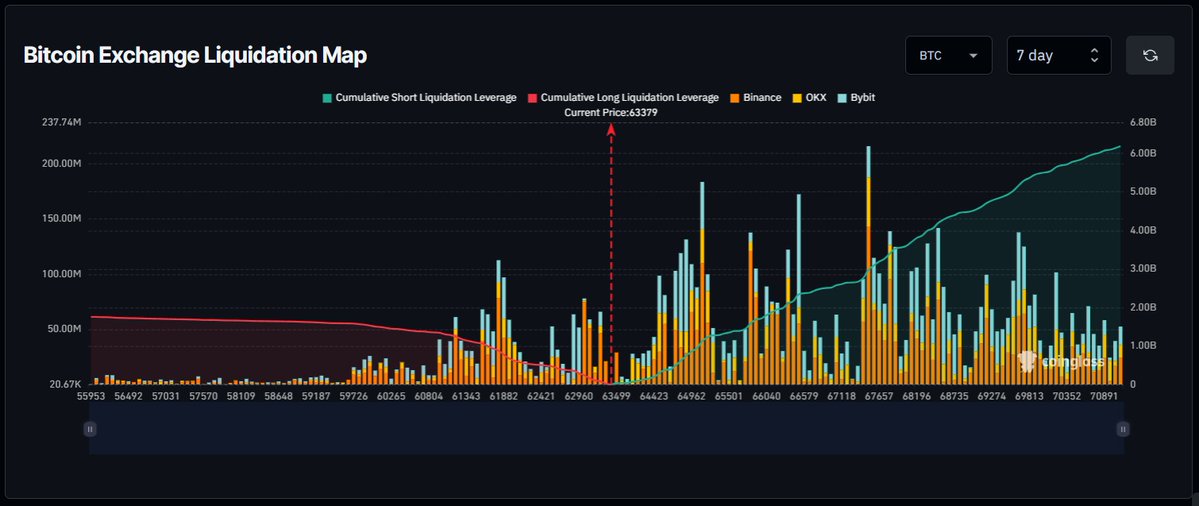
These longs just love getting wrecked.
Price has yo-yo'd between $61k and $65k for the past 24 hours as buyers are beginning to step in to buy at these lower prices and futures traders attempt to long the bottom and catch the falling knife.
We can see that on the 1D the shorts are starting to stack up, but we can also see that the longs continue to stack up also.
The 1W maps look a bit better than the 1D, but we may have more yo-yoing ahead of us as the market attempts to find a floor.
#Crypto #Bitcoin #Liquidations
bitcoin:native
1
25
Jun 4
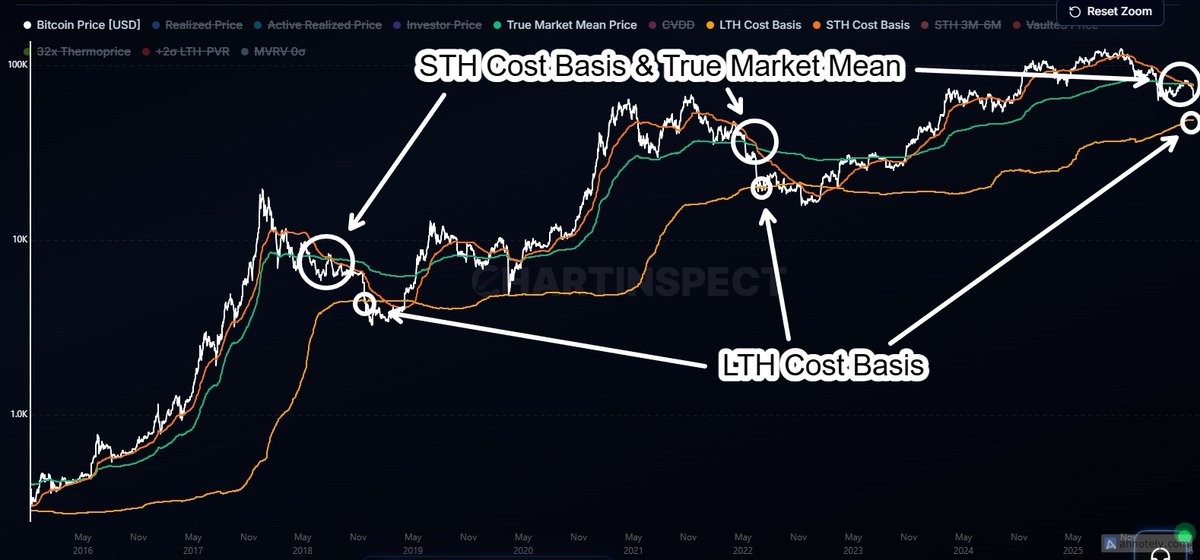
A lot more downside!
If the 4-year cycle bros are right, we may still have quite a way to go.
Past bear markets have not finished near the intersection of the STH cost basis and true market mean (TMM), but when price crossed below the LTH cost basis.
We have only just passed that intersection, which typically is about halfway through the bear market.
If this does play out like a typical 4-year cycle, it could mean that Bitcoin is due to make a move down below $48k if it were to pass the LTH cost basis as it has done in previous bear markets.
Of course, this all depends on IF the 4-year cycle thesis plays out.
#Crypto #Bitcoin #4YearCycle #OnChain
bitcoin:native
1
27
Jun 4
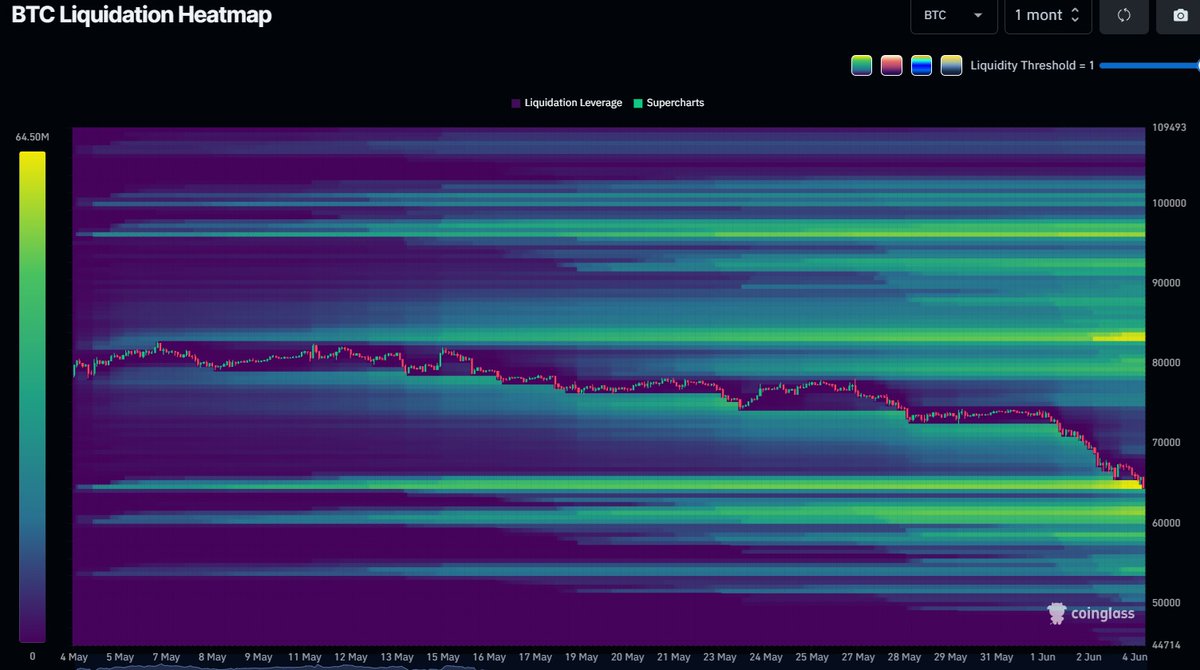
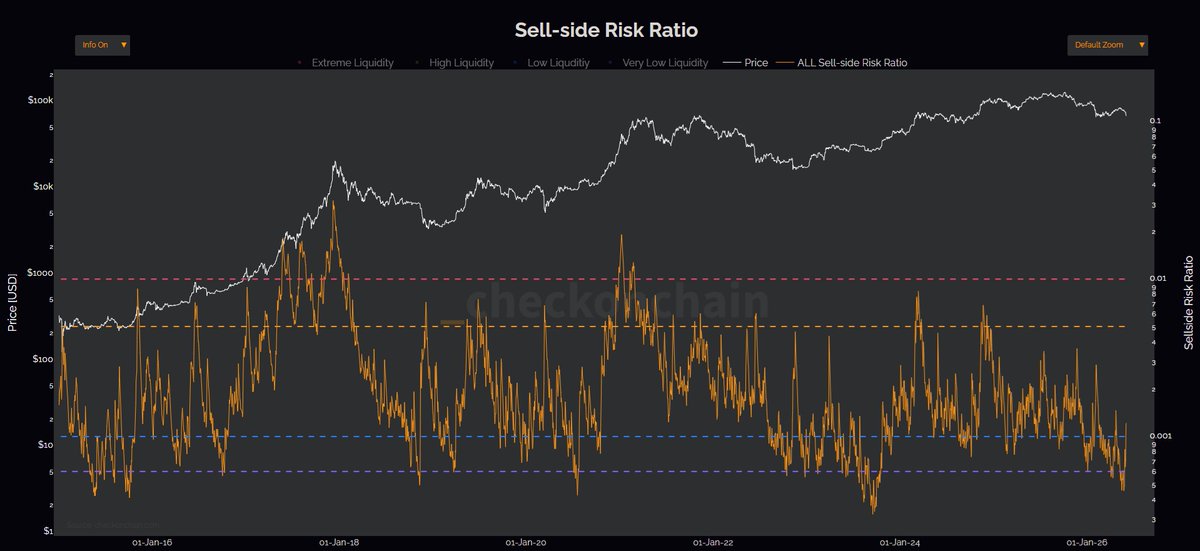
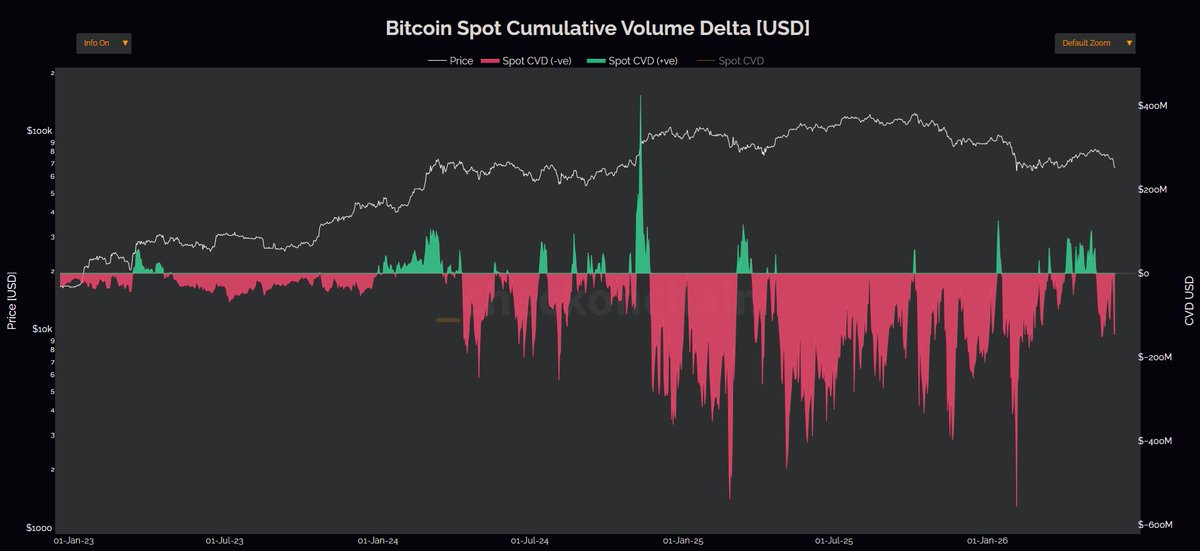
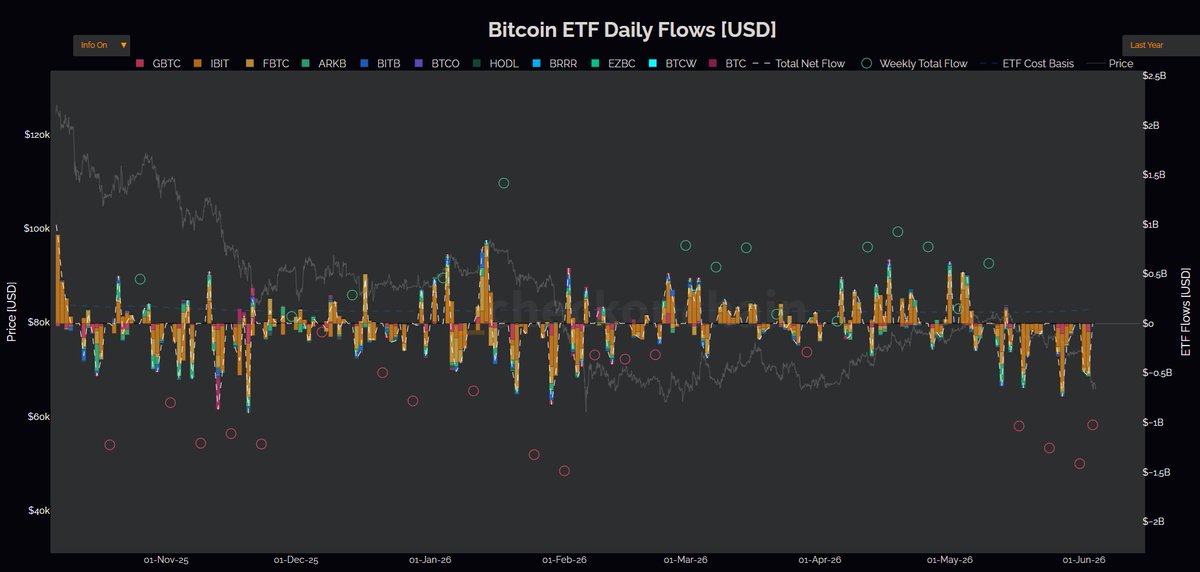
This recent nuke has been led by longs getting liquidated, but what is happening in the spot markets?
The sell-side risk ratio has come up off of its lows led by short-term holders (STH).
We can see that the spot cumulative volume delta (CVD) is currently dominated by sellers.
And ETFs have had another billion dollars of outflows so far this week, and we still have 2 days to go.
What is all this telling us?
While leveraged longs continue to open positions, fueling this decline, it has spooked spot and ETF sellers who are beginning to panic sell into this decline, further fueling the price decline and liquidation cascade.
This may not be over yet.
#Crypto #Bitcoin #OnChain #RiskManagement
bitcoin:native
1
40
Jun 4
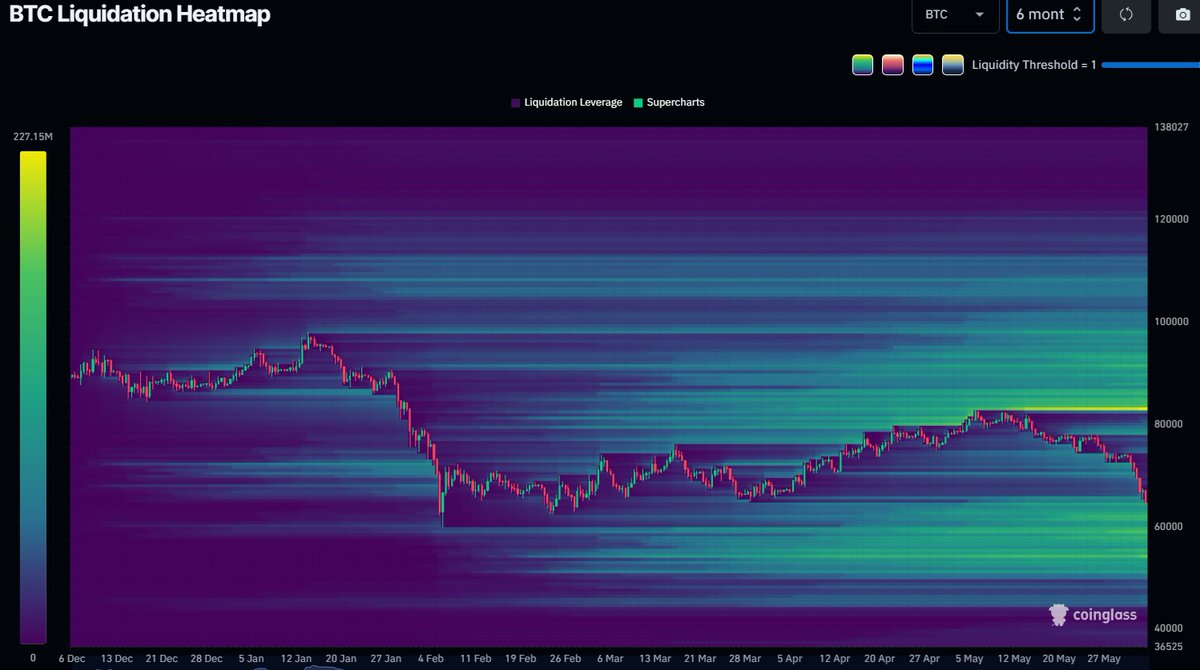
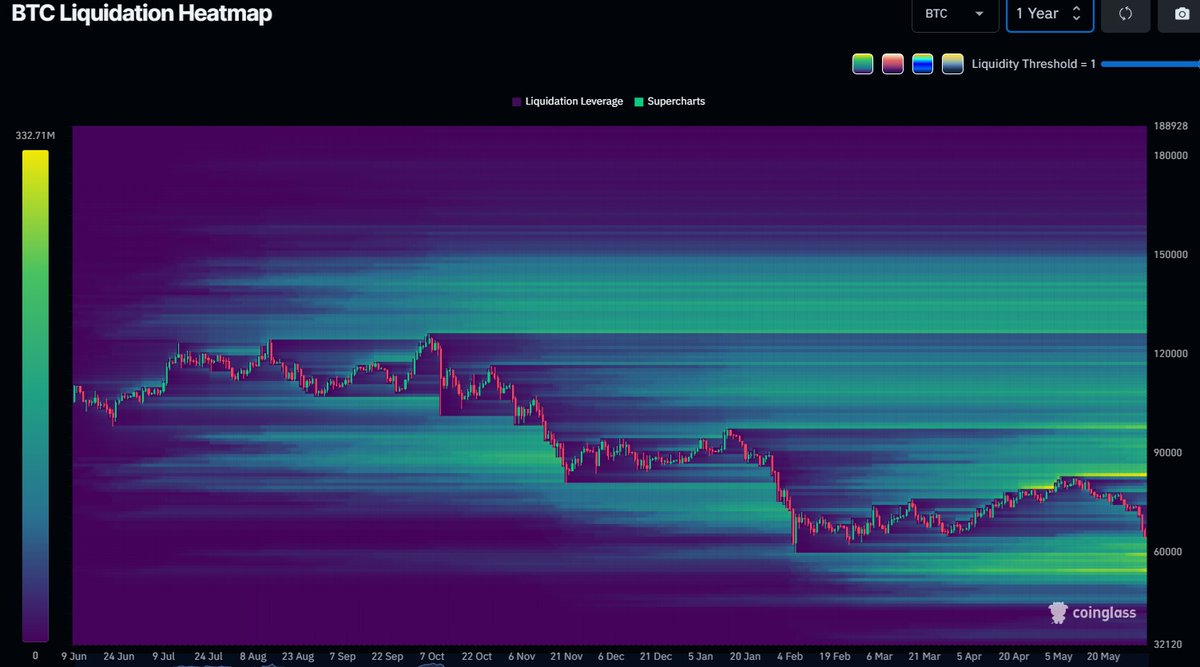
The higher-timeframe liquidation heatmaps suggest that this move may not yet be over.
The 1M heatmaps and above show large clusterings of long positions below price, reaching down towards the $50-$55k range.
At the same time, we see very few shorts above and a serious lack of spot and ETF buyers.
It seems that lower is the more likely scenario.
#Crypto #Bitcoin #OnChain #RiskManagement #Liquidations
bitcoin:native
1
24
Jun 4
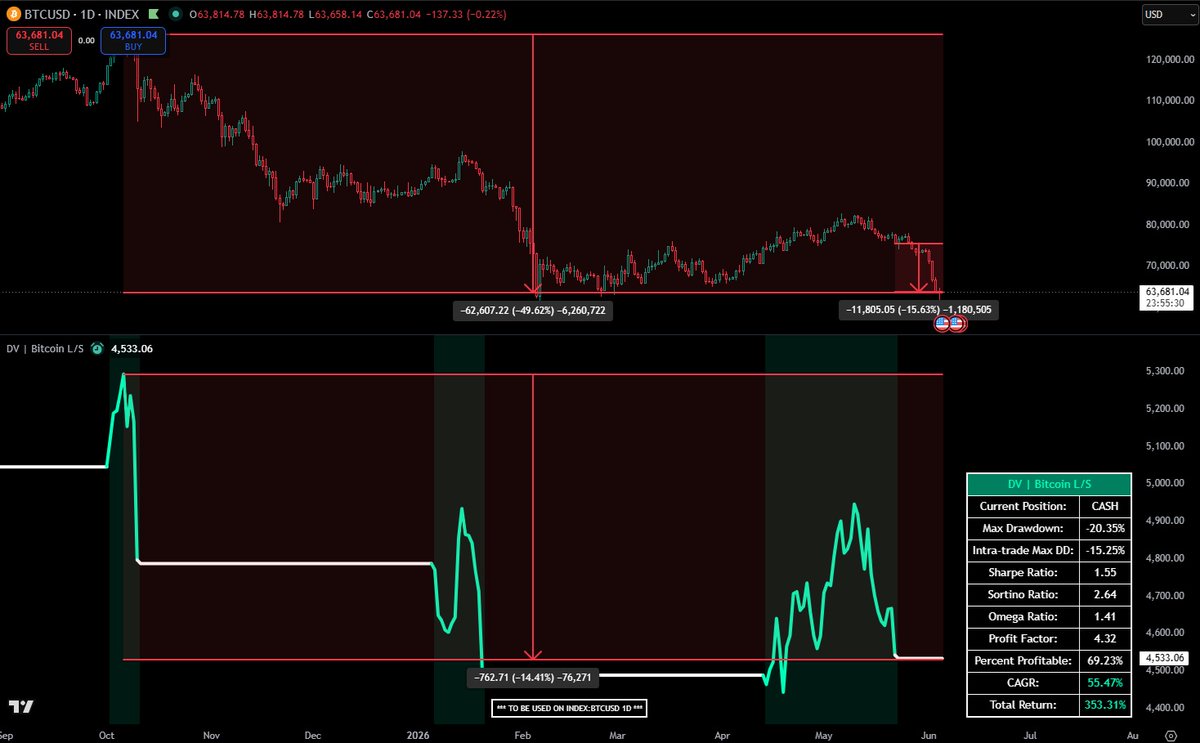
The System Wins Again
Our Bitcoin L/S system has helped protect us from Bitcoin's massive drawdown since its all-time high and also from this most recent nuking.
Bitcoin is down almost 50% from its all-time high in October.
If you were following the long only on the Bitcoin L/S system, you would be down less than 15%.
If you were using both trade directions during this time, you would be up 25% during this period.
Whether you want lower risk or higher risk, the system is still outperforming Bitcoin during this bear market.
Want access to proper risk management tools?
Visit: whop.com/dv-analytics
#Crypto #Bitcoin #Systems #RiskManagement
1
21
Jun 4
Crowding Model Update
The crowding model is showing that the majority of cryptocurrencies it tracks are in the Oversold: Puking Lows quadrant.
This specific quadrant indicates a market state where both directional momentum and active capital inflows have diminished.
While a select handful of assets have managed to buck the trend and push higher, the broader market remains locked in a systematic sell-off.
This overwhelming concentration of assets in the lower quadrant highlights that the current correction is a highly correlated, market-wide flushing event rather than an asset-specific decline.
Want access to this model?
Visit: whop.com/dv-analytics
#Crypto #Bitcoin #OnChain #RiskManagement #Crowding

2
72