
779 Photos and videos


Sebastian Gutierrez retweeted

5 Jan 2024
Hi #EconTwitter!
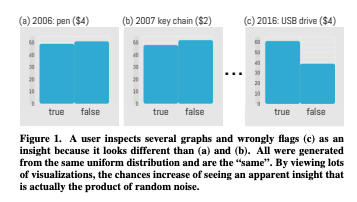
Are you an applied economist who loves data visualization and binscatters? 📊📈
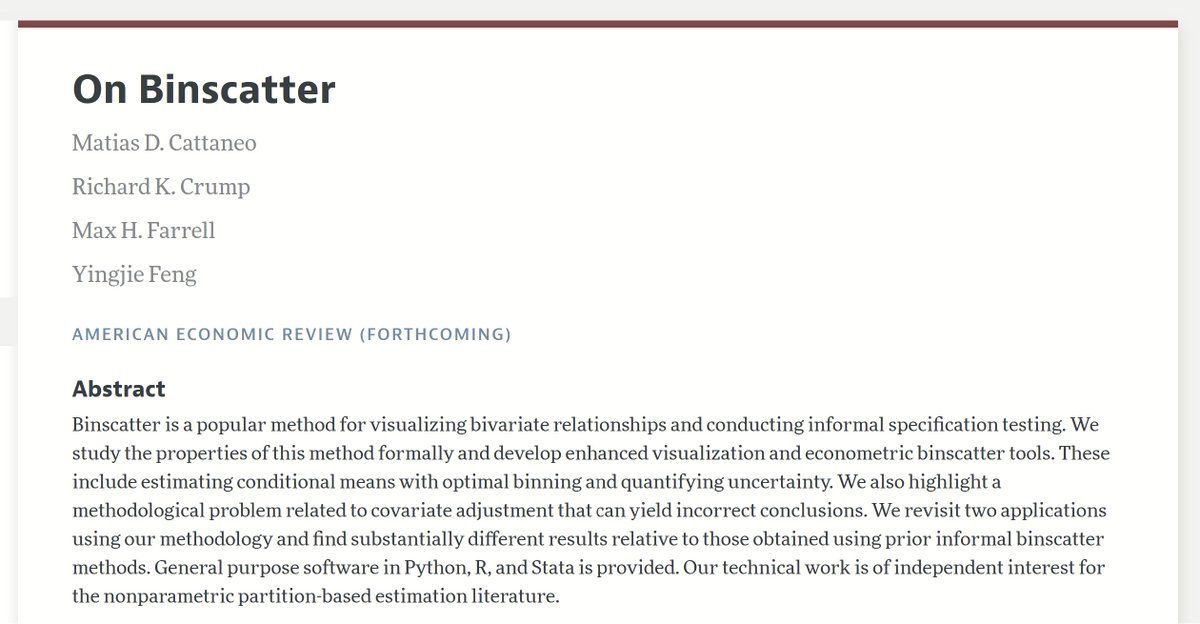
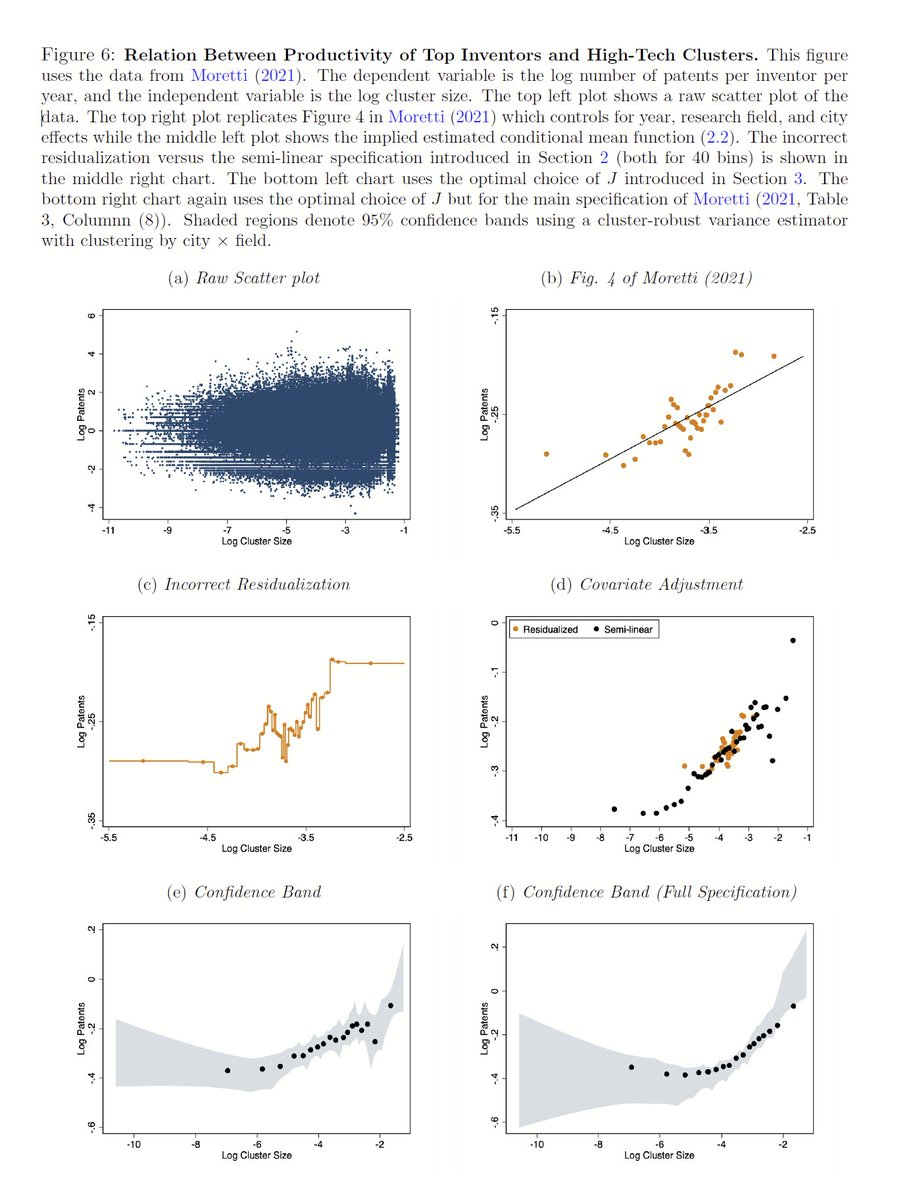
Don't miss👇this newly accepted paper in the American Economic Review by Cattaneo (@princeton), Crump (@NewYorkFed), Farrell (@UCSB) & Feng (Tsinghua U)!
They provide a lot of stuff, including novel visualization tools, principled covariate adjustment, estimation of conditional mean functions, and much more.
Super cool #econometrics paper - highly recommended! ⭐️⭐️⭐️
Links:
1⃣ aeaweb.org/articles?id=10.12…
2⃣ mdcattaneo.github.io/papers/…
1
98
382
58,886
Sebastian Gutierrez retweeted

2 Dec 2023
🆕blog post summarizing Tim Harshbarger, Darrell Hilliker, @jcmankoff, and my recent work on designing more accessible dashboards for screen reader users.
We also presented the paper @sigaccess where it was🏅nominated for the best paper award: tableau.com/sites/default/fi…

What if there was an easier way to design dashboards for accessibility?
Tableau Research @10_arjun explores techniques to make dashboards more accessible to screen reader users.
Learn the latest on the blog. ⬇️ tabsoft.co/3t14RIS
1
2
19
2,984
Sebastian Gutierrez retweeted

2 Dec 2023
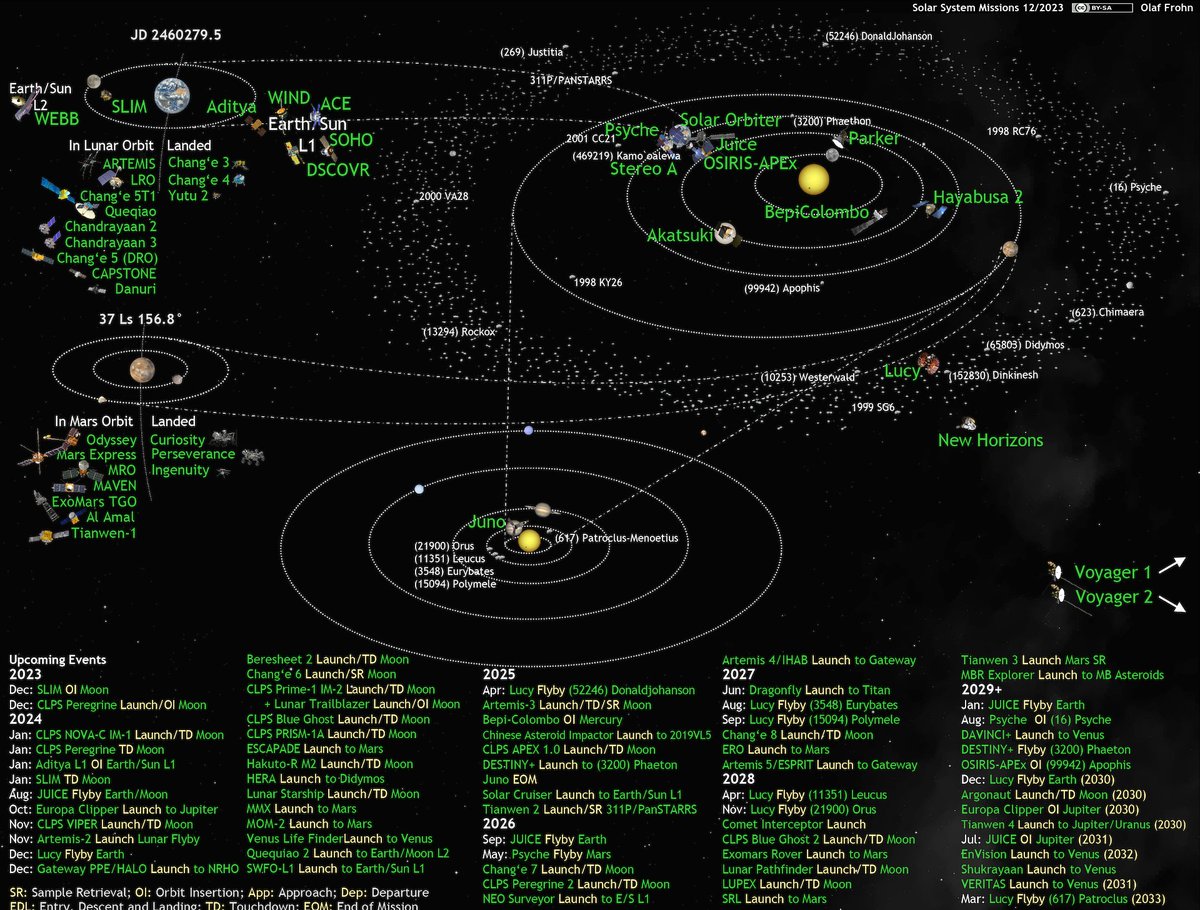
Map of all active and planned Solar System missions and their destinations as of December 1st 2023. @SLIM_JAXA Moon OI, @astrobotic Peregrine launch, @NASASun Parker perihelion, @NASAJuno perijove close Io flyby! armchairastronautics.blogspo… #KeepExploring
1
6
16
2,385
Sebastian Gutierrez retweeted

30 Nov 2023
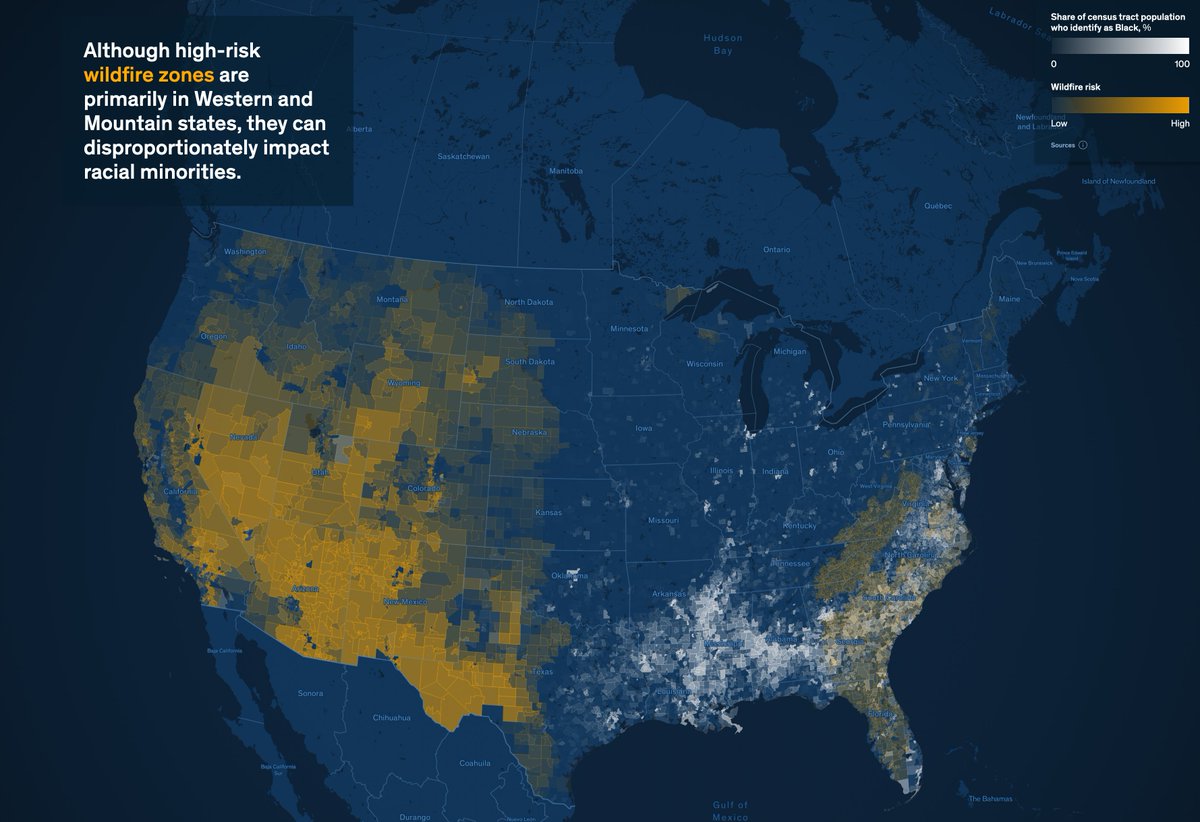
Nice data mapping in our new interactive: The impact of climate change on Black populations in the US. In conjunction with McKinsey's Institute for Black Economic Mobility. Congratulations to all my talented new colleagues!
mckinsey.com/bem/our-insight…
3
15
1,823
Sebastian Gutierrez retweeted

27 Oct 2023
The HCI and Visualization group at Autodesk Research (@ADSKResearch) is looking for graduate interns and postdocs to host in Toronto for 2024. We have a focus on HCI AI, but also software learning, visualization, AR/VR, novel interaction techniques, creativity support, and more!
2
75
214
54,051
Sebastian Gutierrez retweeted

5 Nov 2023
Thanks! Part 2 is here -> dianaow.com/blog/pixijs-d3-g…
1
1
479
Sebastian Gutierrez retweeted

2 Nov 2023
Wow! I didn't imagine how much fun I'd have with #DataPhysicalization. You're still in time to participate in the project run by @VizFSG. Just let your imagination fly! In my case, I chose to use leaves 🍃🍂 to create a heat map of global temperatures. 🤓
vizforsocialgood.com/join-a-…
10
15
77
6,941
Sebastian Gutierrez retweeted

2 Nov 2023
A while ago @Reyfenberg and I made a tutorial on how to create 3D data visualizations with svelte...
He just took it to a whole new level!
Tutorial: datavizcubed.com
2 Nov 2023

First #webxr experiment using the @Meta #quest3. @DataVizStefan I literally walked around our #dataviz in my kitchen. @godisacomputer threlte-xr is amazing @threlte @SvelteSociety
1
8
1,375
Sebastian Gutierrez retweeted
29 Oct 2023
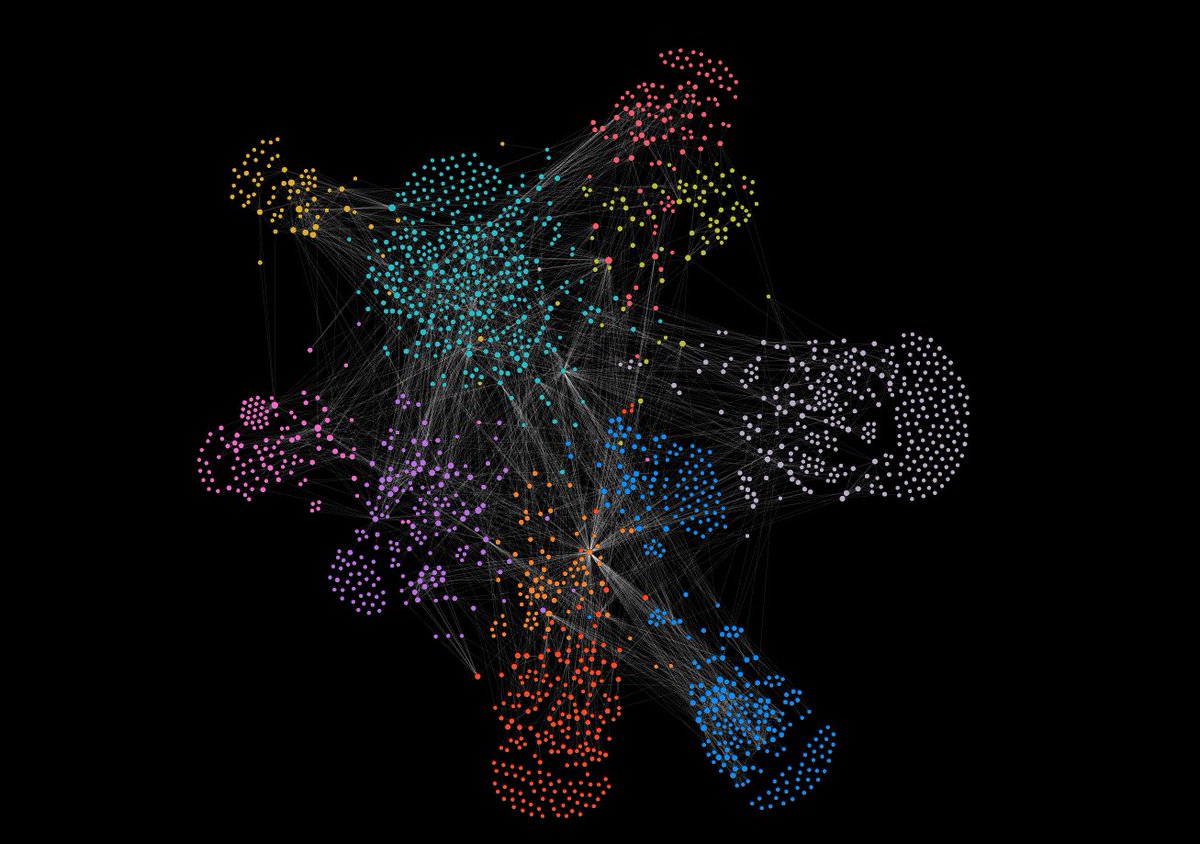
I've written a blog post on creating large-scale interactive force-directed graphs, with PIXI.js v7 handling the rendering and D3.js for the force simulation abilities.
I also compared rendering between PIXI and D3.
dianaow.com/blog/pixijs-d3-g…
#dataviz #networkviz #pixijs @PixiJS
3
12
45
4,661
Sebastian Gutierrez retweeted
3 Nov 2023
I’m happy to share that I’m starting a new position as Senior Data Visualization Editor, Global Publishing at McKinsey & Company. Very excited about this new journey @McKinsey
7
1
45
3,564
Sebastian Gutierrez retweeted

9 Oct 2023
New Blog Post! My Publishing Checklist #DataFam
domoorewithdata.com/2023/10/…
2
16
57
7,224
Sebastian Gutierrez retweeted

5 Oct 2023
Why should stories be visualized as storylines? How else might stories be visualized? Narrative-time vs. world-time, StoryPrint, and text-heavy historical narrative visualizations. richardbrath.wordpress.com/2…
1
4
18
1,852
Sebastian Gutierrez retweeted

4 Oct 2023
Our research group @apple is recruiting PhD student interns working in #visualization #machinelearning. Past interns have published award-winning papers and deployed interactive tools that impact billions.
DMs open. Come work with me!
→ apple.box.com/v/hcmi-interns…
7
45
234
45,370
Sebastian Gutierrez retweeted

When I'm thinking about HCI implications for LLMs, I keep coming back to David Kirsh's work. Here is a great paper about how tools influence thinking and work. adrenaline.ucsd.edu/kirsh/Ar…
14
68
7,035
Sebastian Gutierrez retweeted

3 Oct 2023
These decisions are hard to make, and you'll be happiest/most-effective in a place that best aligns with you, so I would also encourage you to look at all my wonderful vis colleagues who are also recruiting PhD students: vis-phd-positions.netlify.ap…
1
4
883
Sebastian Gutierrez retweeted
3 Oct 2023
Interested in vis society? I'm looking for new PhD students next year!
Read through my new FAQ on mission, projects, advising philosophy, expected background, why infoscience, etc: evanpeck.github.io/group/new…
I'd love to hear from interested folk - please share widely!
ALT Some stylistic visualizations (not informative) with high-level questions: 1. How do we design visualizations to serve more diverse communities of people? 2. How do we change visualization education to stop prioritizing such a narrow band of people?
1
26
56
14,446
Sebastian Gutierrez retweeted

20 Sep 2020
Five months ago I started experimenting with self-tracking in a text file. And it is still going on. Here I describe the syntax that I developed to keep the log machine readable, yet easy to write.
gibney.de/a_syntax_for_self-…
4
2
19