
Joined November 2012
- Tweets 615
- Following 670
- Followers 601
- Likes 2,921
159 Photos and videos


May 20
Wip: I recently found out that you can download your @YouTube watch history.
Streamgraph seems like the obvious choice to visualize the data.
Here are my top 30 channels from 2012 until today. Made with @sveltejs and #d3js
@sveltesociety #datavisualization
1
56
May 19
just shipped satview.space a real-time 3D satellite tracker
thousands of satellites rendered live on an interactive Earth globe. filter by LEO/MEO/GEO, category (Starlink, GPS ...), get flyover predictions and more built with #r3f, #threejs
1
9
1,017
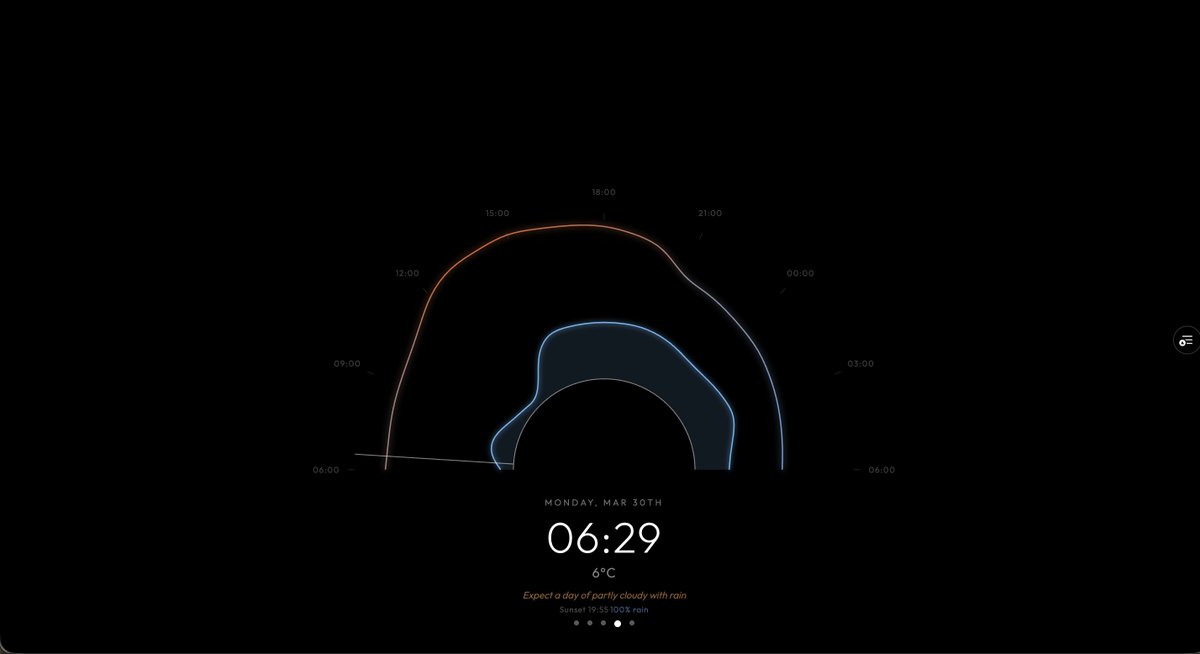
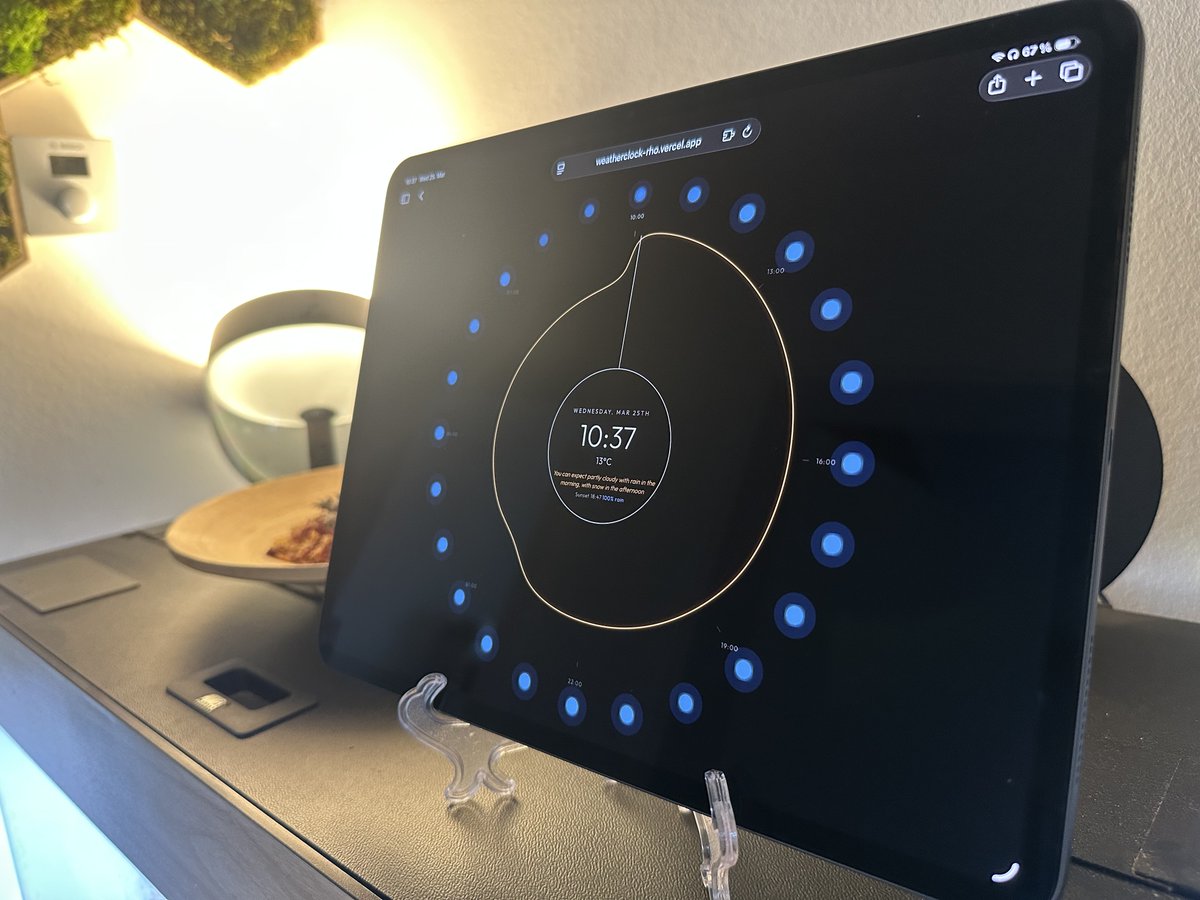
Mar 31
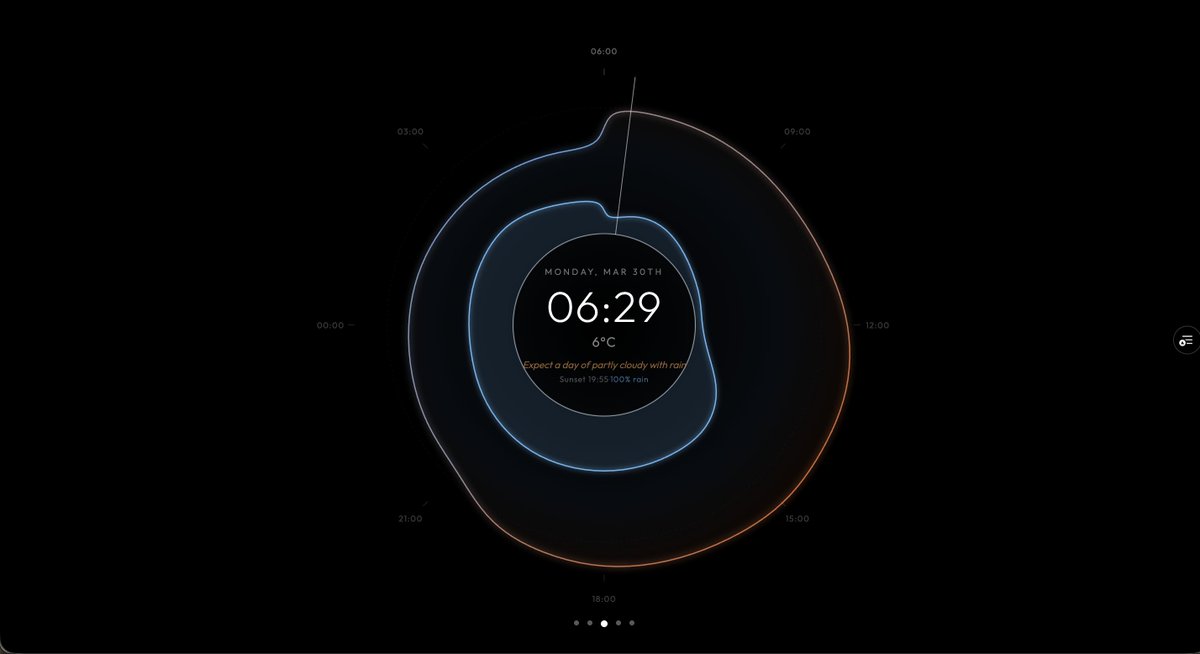
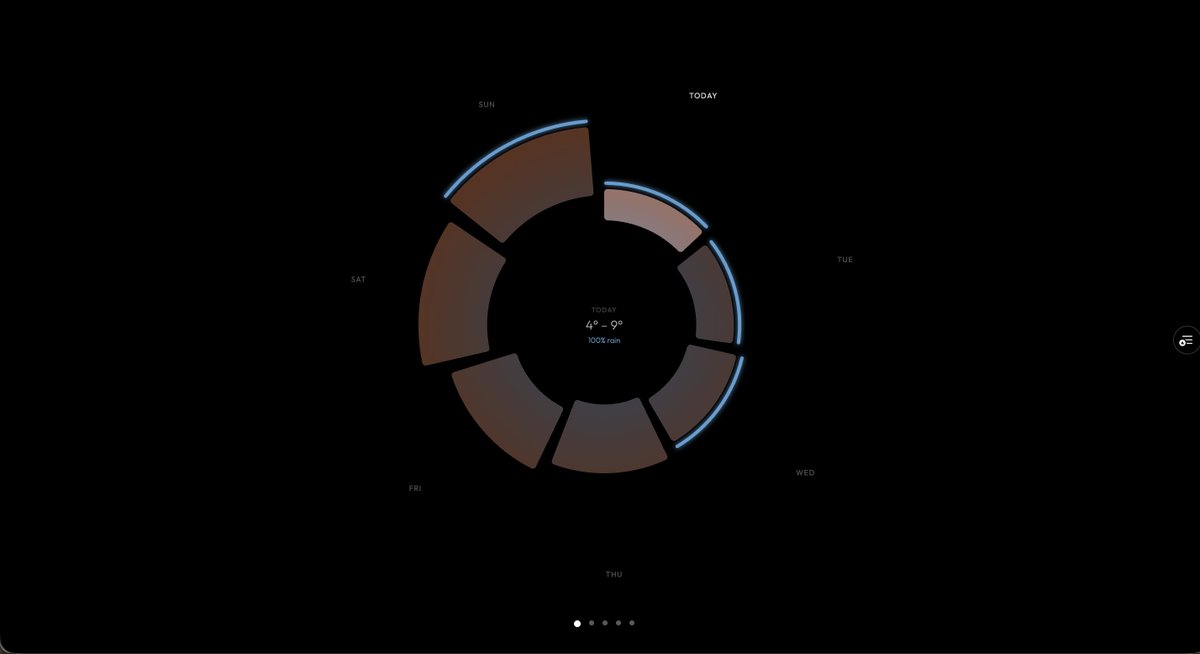
Did some more tinkering on my Weatherclock.
Added a forecast screen as well as different watch faces.
Live link: weatherclock-rho.vercel.app
Accepting the location will pull data from your nearest station.
#DataViz #InformationDesign #Svelte #D3js
1
1
114
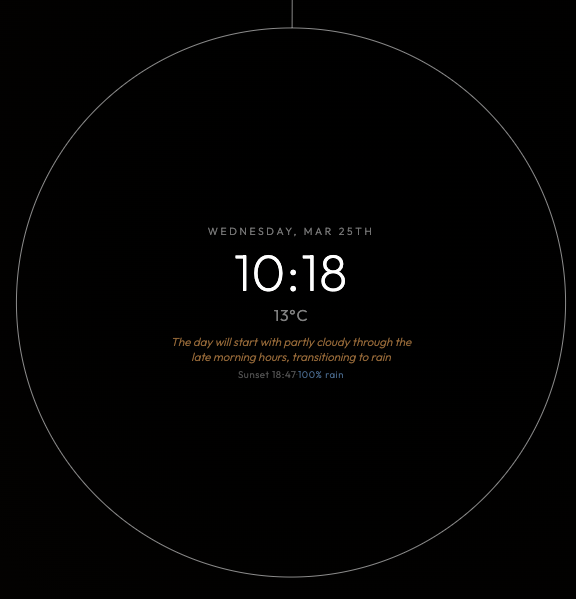
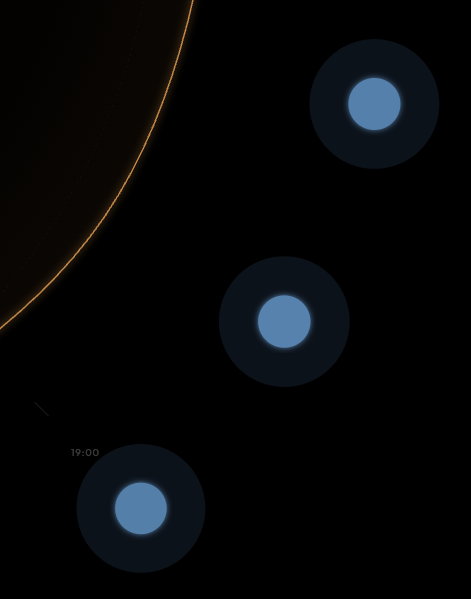
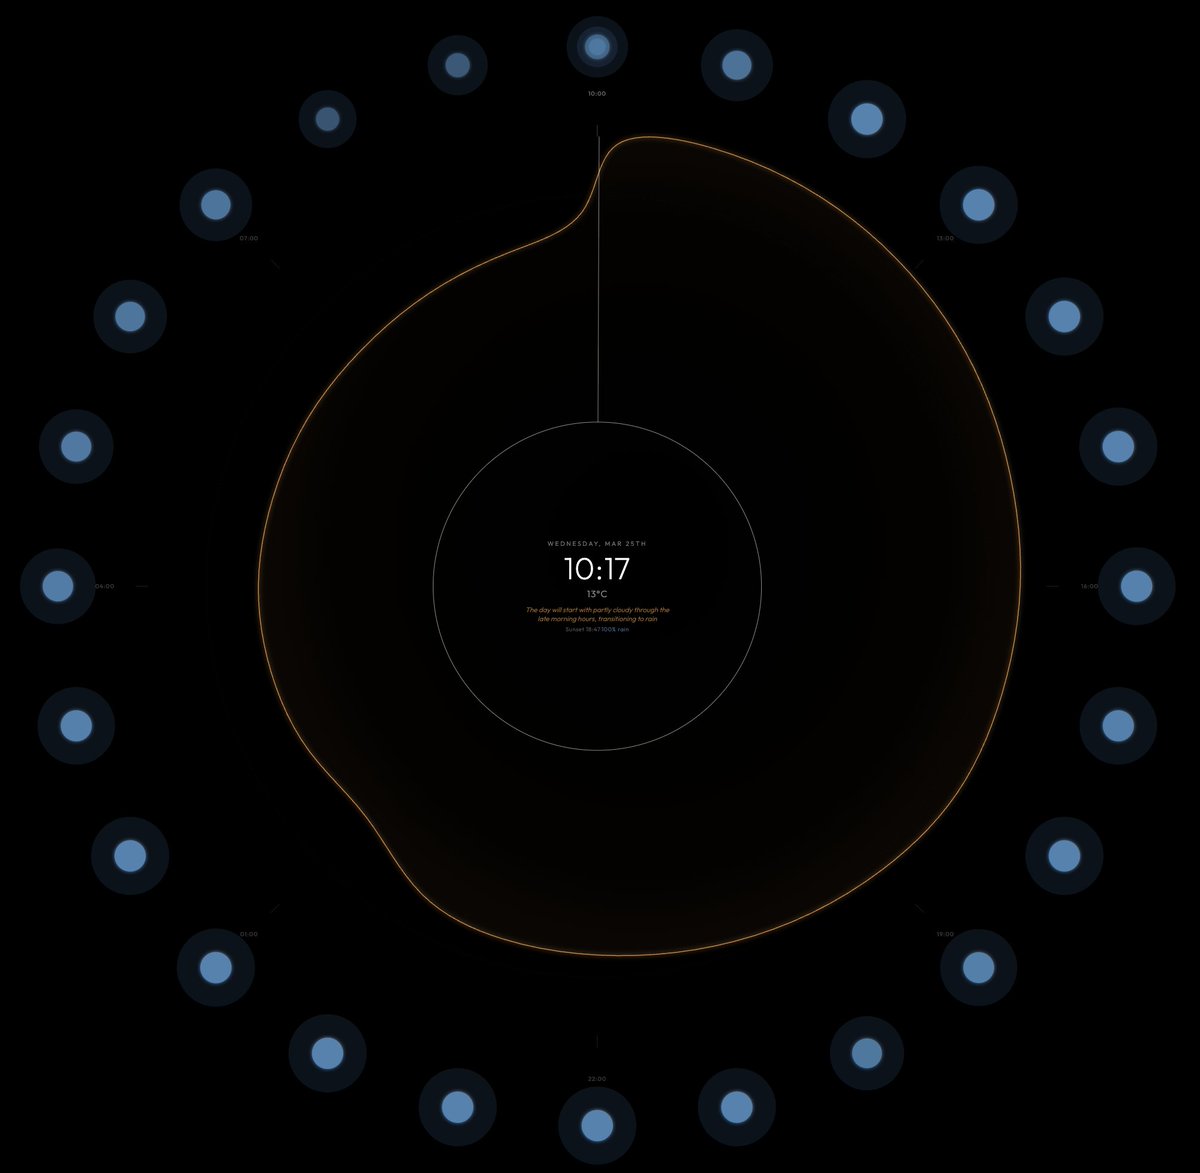
Mar 25
Minimalist Weatherclock weekend project
Made myself a Weatherclock that fetches data from the openweathermap api every hour. It shows the temperature as a line and precipitation as dots around the edge.
#DataViz #InformationDesign #CreativeCoding #Svelte #D3js
1
73
Mar 11
Freiburg im Breisgau: 45,005 Trees. One City. 🌳
I turned Freiburg’s 2025 official tree registry into an interactive 3D visualization!
Explore all 45k city-maintained trees and fly through the urban forest here: 🔗 freiburg-trees.vercel.app #DataViz #SmartCity #ThreeJS #Svelte
1
11
312
25 Nov 2025
#30DayMapChallenge Day 8: Urban
Inspired by the Morphocode Explorer, I’m building a Freiburg-focused remix using open data.
Tech: OSM, Freiburg Open Data · #Svelte · MapLibre · Turf.js · Tileserver-GL
#Urban #UrbanData #WebMapping #Geospatial #GIS #DataViz
3
180
10 Nov 2025
Gave geo-projections.com a long overdue refresh
Tooltips showing area distortion
Tissot circles for visualization
City search & map dragging
Dark/Light mode
Many more fixes
Originally built it in 2021 while learning #d3js
#cartography #gischat #maps
2
88
17 Mar 2025
Just wrapped up my interactive fitness visualization with Svelte 5 and D3.js. Feeling fit and creative! 🏋️📊
fitness-viz-ov5k.vercel.app/
#Svelte #D3js #FitnessViz #CreativeCoding #threejs #threejsJourney #DataVisualization
12
1,040
12 Feb 2025
I am working on a #datavisualization to better understand my fitness trends over the past year, combining gym visit logs and Apple Health data.
Sneak peek to the hero section done with #svelte and the freshly released #threlte v8.
#D3js #FitnessAnalytics #WebDev #threejs
1
15
22
2,367
6 Feb 2025
Created a new REM map of the Neches River, Texas! 🌊🎨
This one was tricky—huge data size caused endless crashes in QGIS and Blender, but the result looks like a painting! Lidar data from the USGS Explorer.
#GIS #Blender3D #DataViz #NechesRiver #Mapping #Geospatial
14
534
30 Jan 2025
Created this REM of the Snake River meanders! 🐍🌊
Processed with QGIS, rendered in Blender using lidar data from the USGS Explorer. Inspired by the amazing @milos_agathon!
#GIS #DataViz #Blender3D #SnakeRiver #Mapping #Geospatial
2
1
30
7,578
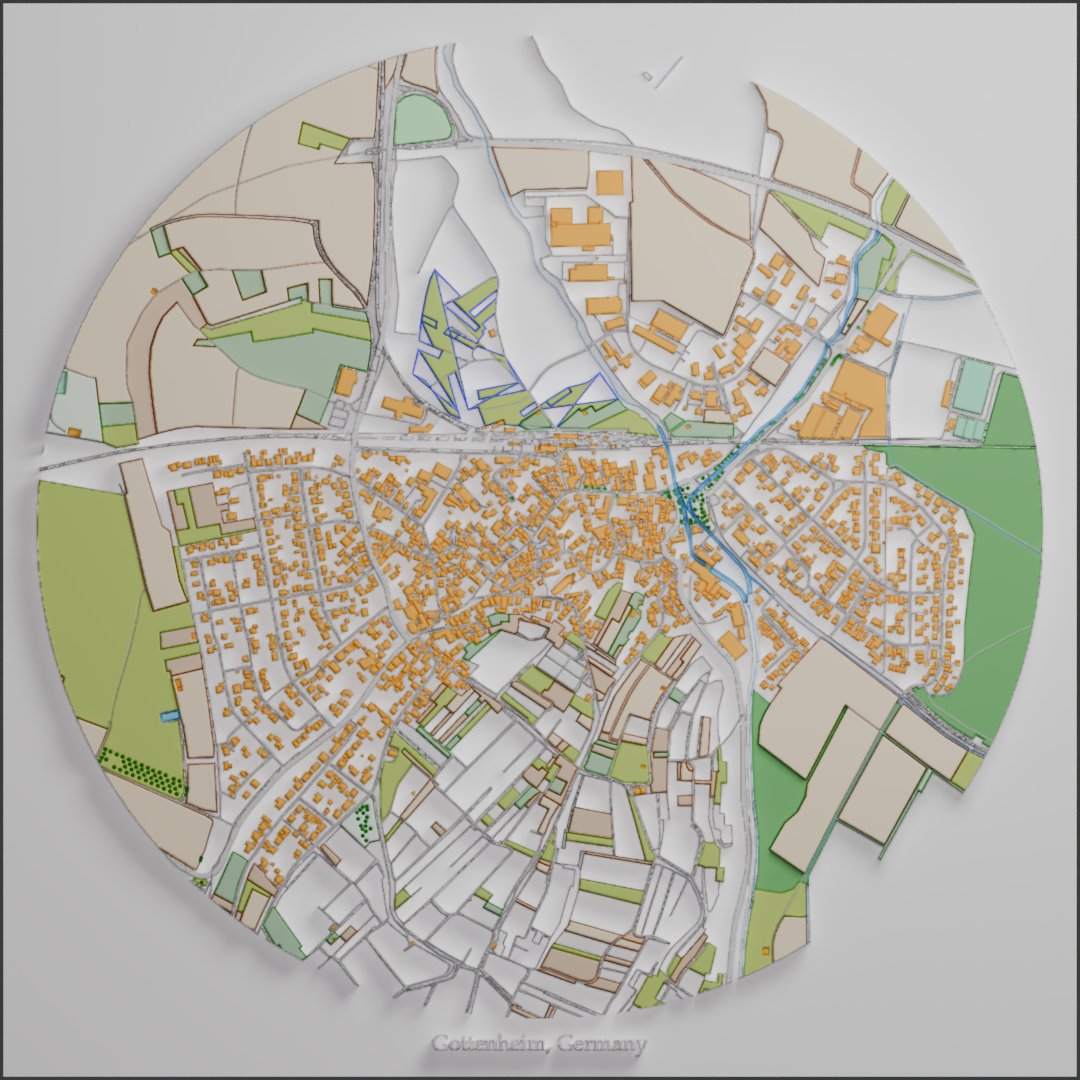
26 Jan 2025
Made this 3D map of Gottenheim, my home village in southern Germany! 🏡✨
Rendered in Blender using data from OpenStreetMap. Love blending technology and creativity to visualize local places!
#Blender3D #GIS #Mapping #DataViz #cartography
1
3
69
3,342
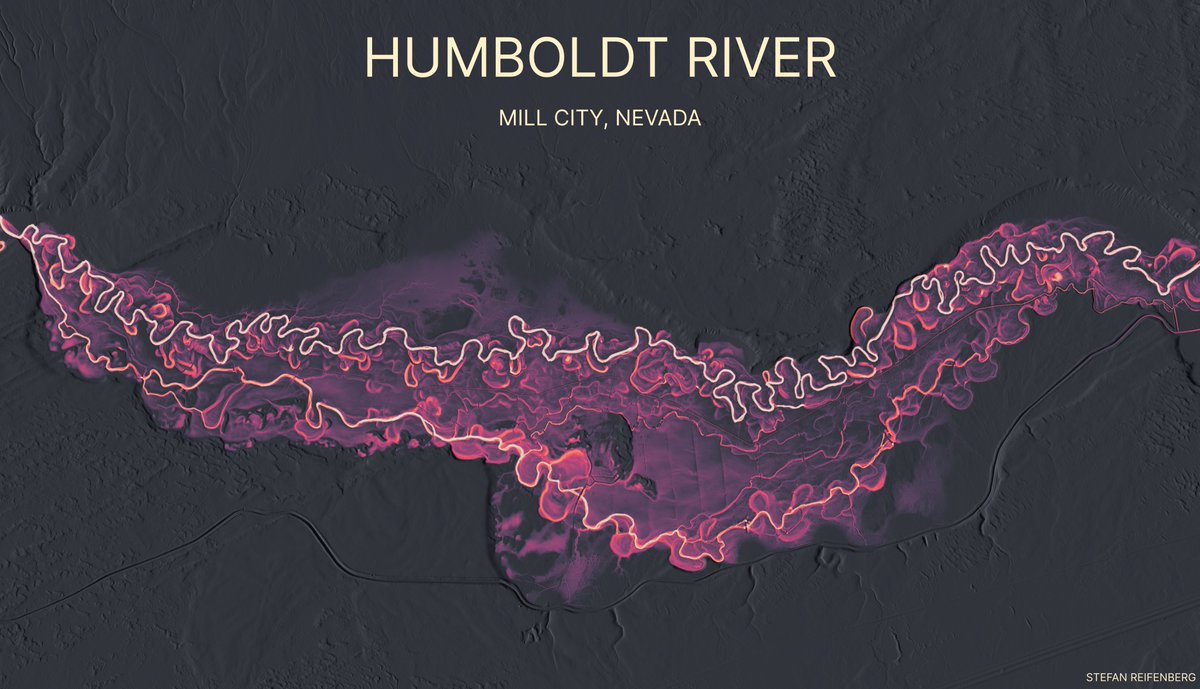
20 Jan 2025
Meanders are nature’s art, reshaping entire landscapes. 🌊✨ This REM of the Humboldt River was made using lidar data from the USGS, processed in QGIS, and rendered in Blender.
#GIS
#Blender3D
#LidarData
#HumboldtRiver
#DataViz
#Map
#Mapping
1
14
2,352
13 Jan 2025
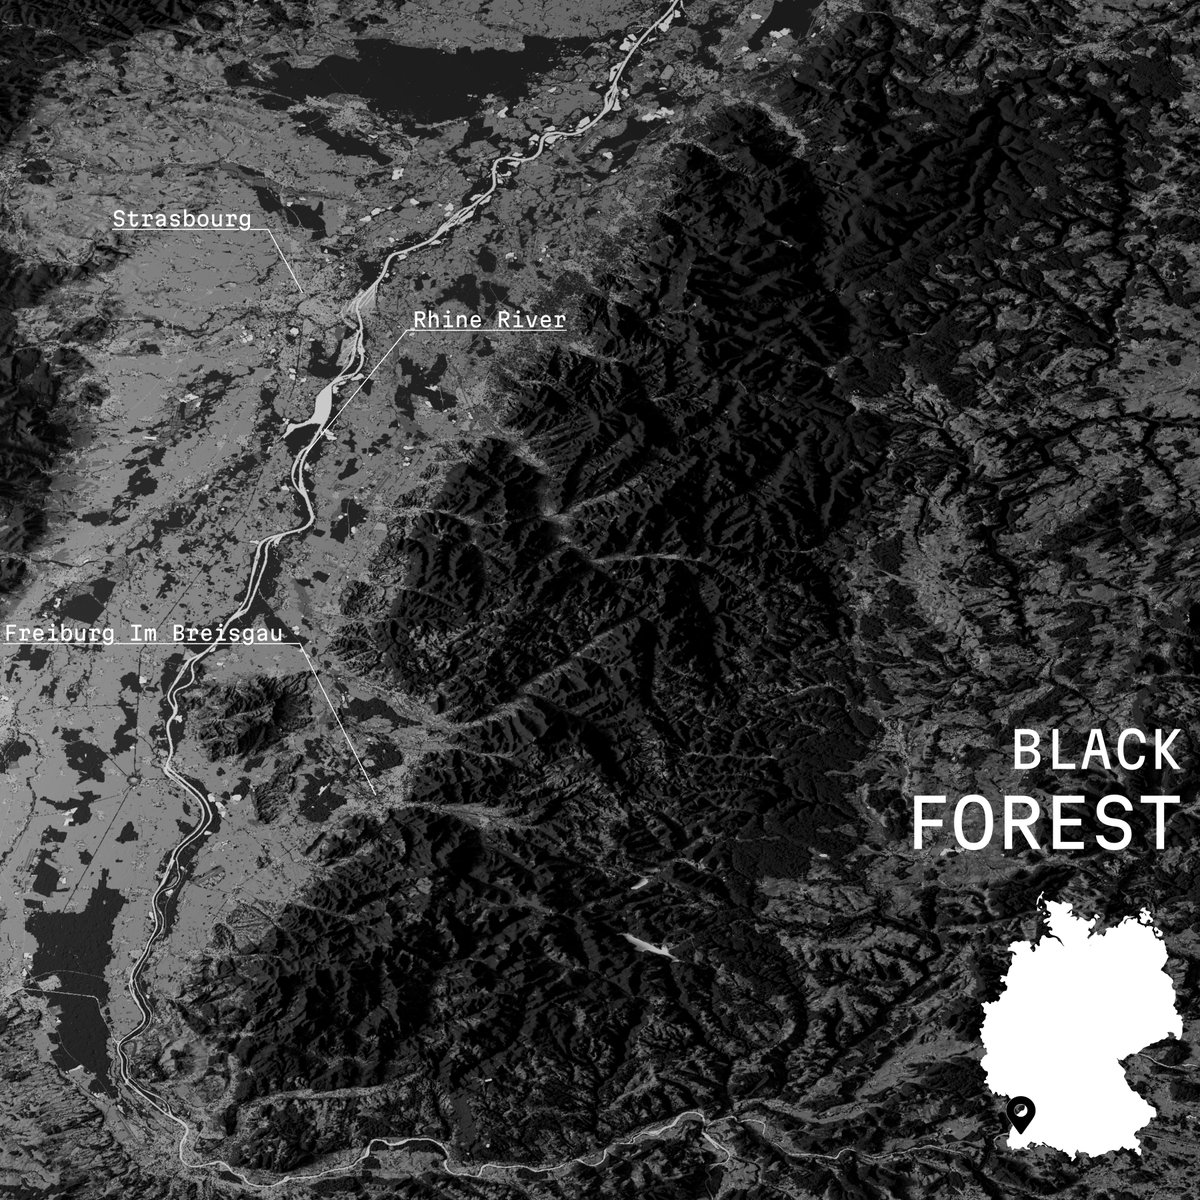
Just finished this 3D map of the Black Forest! 🌲
Created using QGIS for data processing and Blender for rendering. Loving the blend of data and design!
#QGIS #Blender3D #DataViz #GIS #Mapping #BlackForest #DigitalArt
6
391
4 Jan 2025
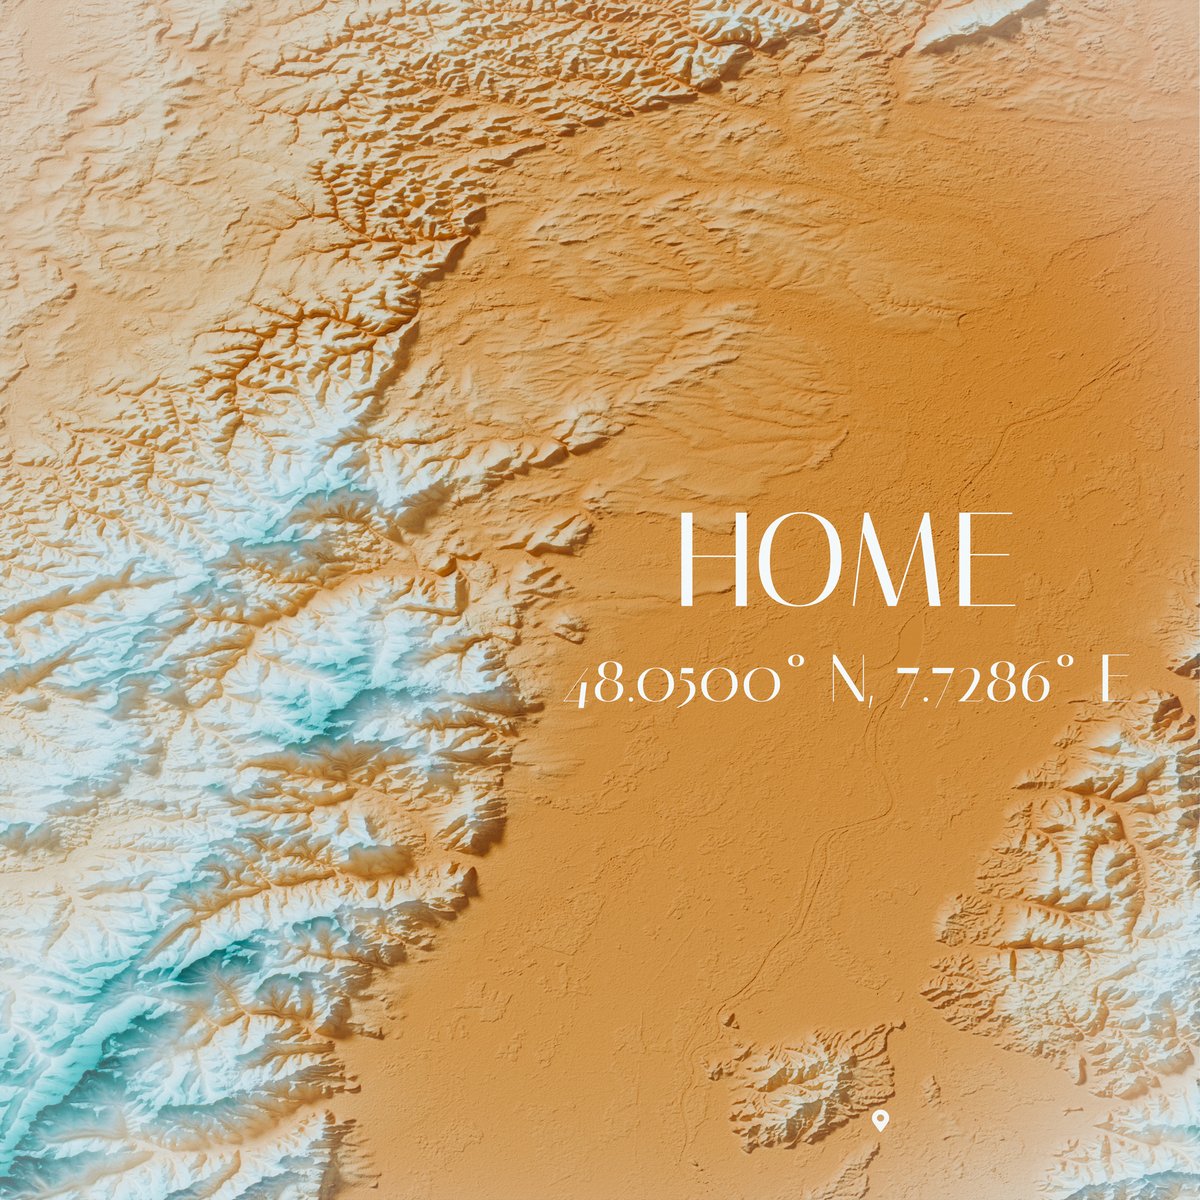
Inspired by the incredible work of Florent Lavergne, I created my own version of his “Home” map! 🌍
Processed raster data in QGIS, rendered with Blender, and added final touches in Lightroom.
Loving the blend of data art!
#DataViz #GIS #Blender #Mapping #DigitalArt
7
441
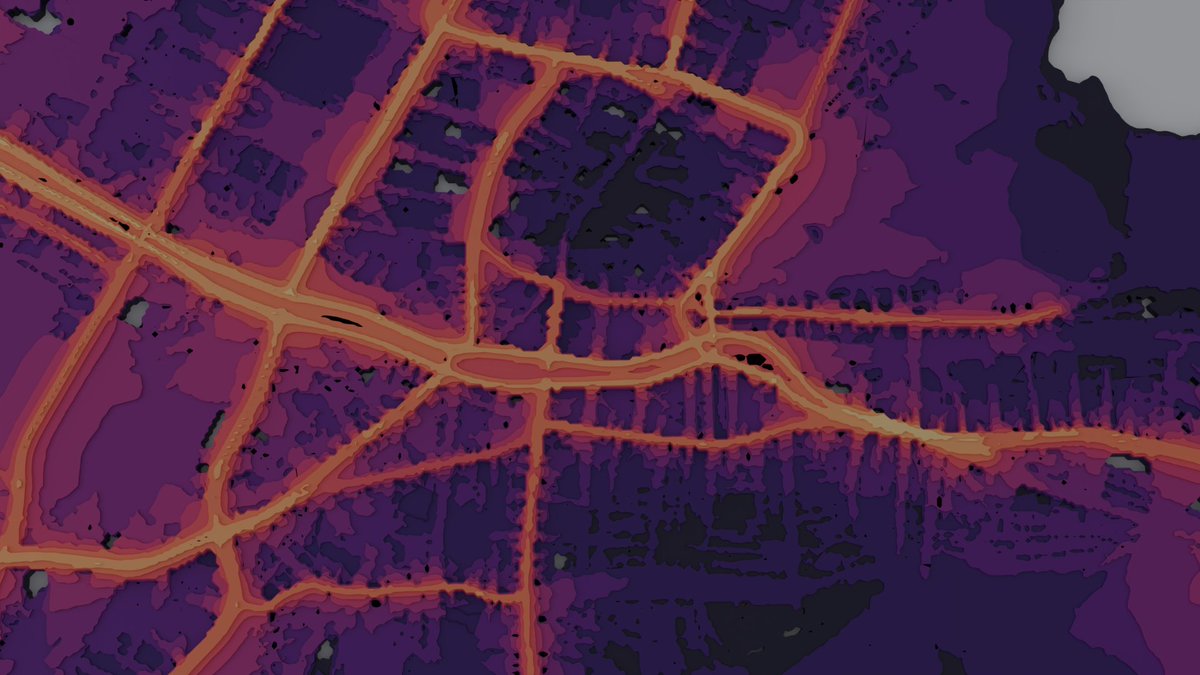
29 Dec 2024
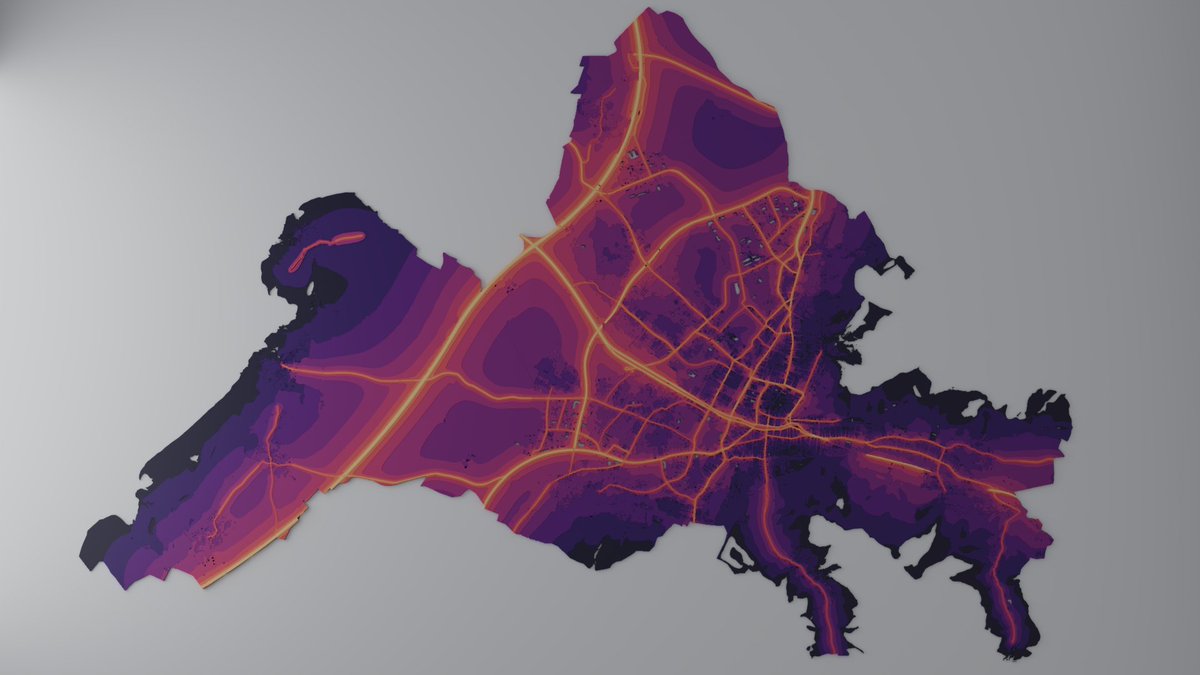
#DataisBeautiful Traffic noise pollution in Freiburg im Breisgau, Germany. @freiburg
#maps #dataviz
Made with #QGIS and #Blender
Data from @OGD_Freiburg
2
266
19 Nov 2024
I've been exploring #archviz using #blender recently and it's so relaxing and satisfying at the same time.
Obvious next step will be to create a #threejs application that uses the model.
#threejsJourney
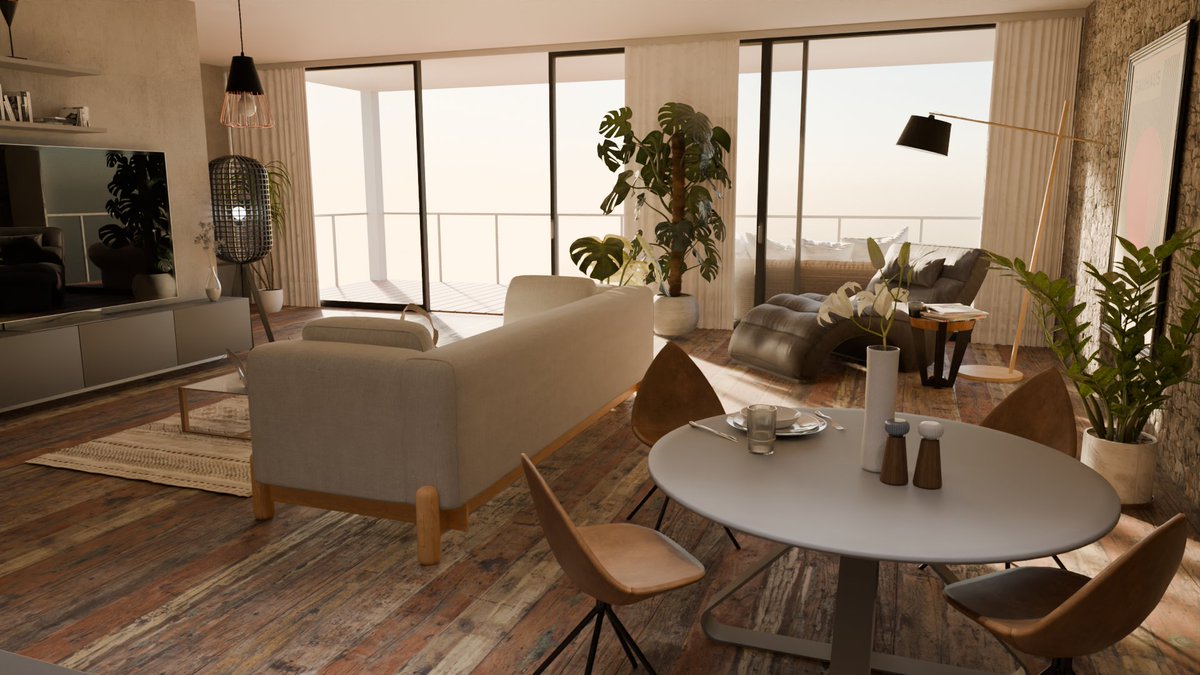
ALT A 3d render of a apartment living room
1
7
300
27 Jun 2024
Been revisiting #threejsJourney and made this scene with @threlte based on the shaders lesson. Also added a subtle cursor interaction with the vertex shader
Enjoy some yummy ramen 🍜
#threejs @SvelteSociety
2
2
19
1,020
26 May 2024
I have been working a lot with #webxr using @threlte over the last couple of months and want to share some of my test projects.
This one shows a model of the destruction of @Stadt_Trier during WWII by @sven_s8, captured on the Quest 3
#threejs #threejsJourney
Link below👇
3
2
12
592