Tech Talk is a free stock market letter service available at TimingTheMarkets.com and EquityClock.com. Ask us about the Seasonal Advantage Portfolio.
Joined December 2009
- Tweets 13,901
- Following 420
- Followers 9,758
- Likes 387
8,170 Photos and videos


Pinned Tweet
Jun 2
Just Released…
Our monthly report for June is out, providing insights, analysis, and trade ideas to navigate the market through the month(s)/year ahead.
Subscribe now to receive this 91-page report: charts.equityclock.com/subsc…
#Stocks #Bonds #Commodities

648
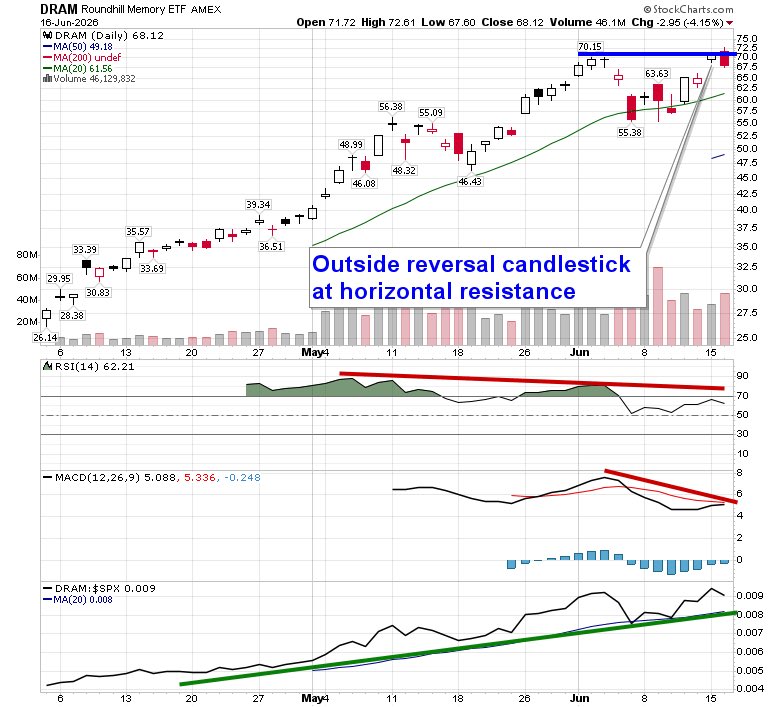
Outside reversal candlesticks in a key Technology subsector highlight upside exhaustion. equityclock.com/2026/06/16/s… $DRAM $MU $SNDK
1
10
543
Our mean reversion thesis, away from YTD leaders (eg. $XLK) and towards laggards, for the final weeks of the second quarter continues to work beautifully. Segments of the market that have less of a weight to the hot technology trade have been holding up much better (eg. $IWD $EWC ) since the end of May.
The window to this end of quarter phenomenon is narrowing and the time has come to consider the rotation candidates on the flip side for the summer rally period.
1
367
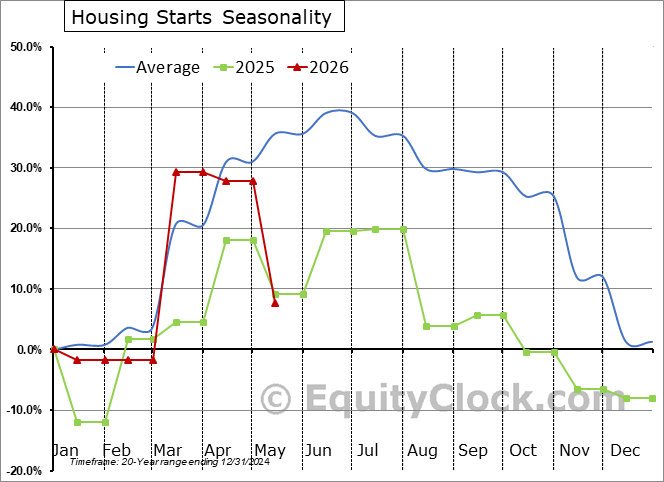
The weakest May performance on record for Housing Starts emphasizes the strains that the housing market continues to endure. US Housing Starts fell by 15.7% (NSA) last month, presenting a highly abnormal drawdown for this spring month that normally sees a gain of 4.3%. The year-to-date change is showing the weakest performance (outside of the pandemic) since the early 1980's. $STUDY $MACRO $ITB #Economy #Housing
2
8
1,803
Jun 16
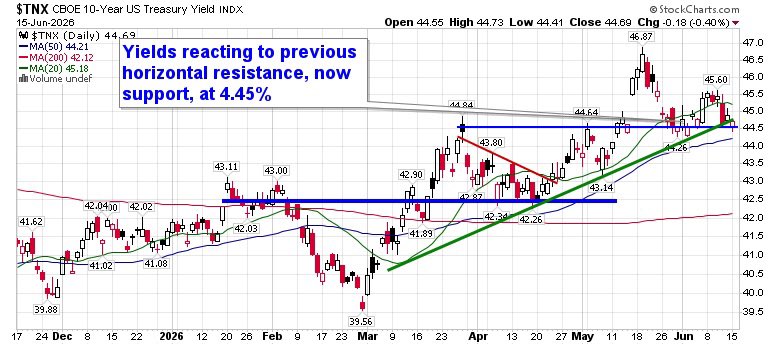
Stocks jump, Oil drops, and Treasury Yields …. unchanged? equityclock.com/2026/06/15/s… $TNX $SPX $USO
3
517
Jun 15
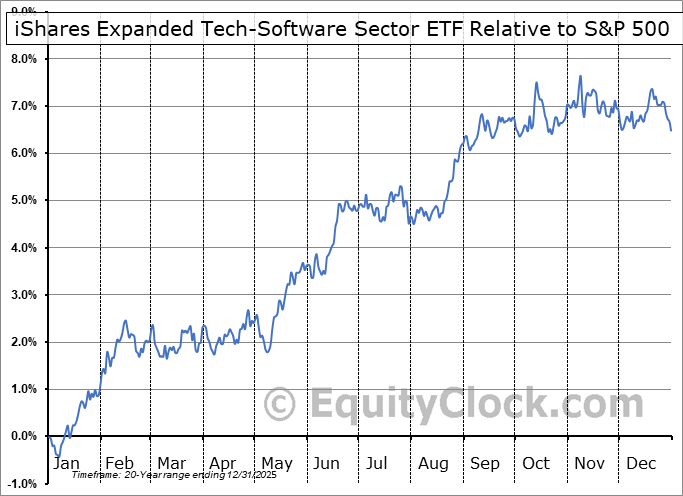
Software stocks showing positive reaction to levels of logical support following their brief retracement; $IGV bouncing strongly from support at the 50-day moving average (~89). Still in the early days of the optimal holding period of the Software ETF, which runs from June 1st to September 12th. $PLTR $ORCL $SHOP
2
10
477
Jun 15
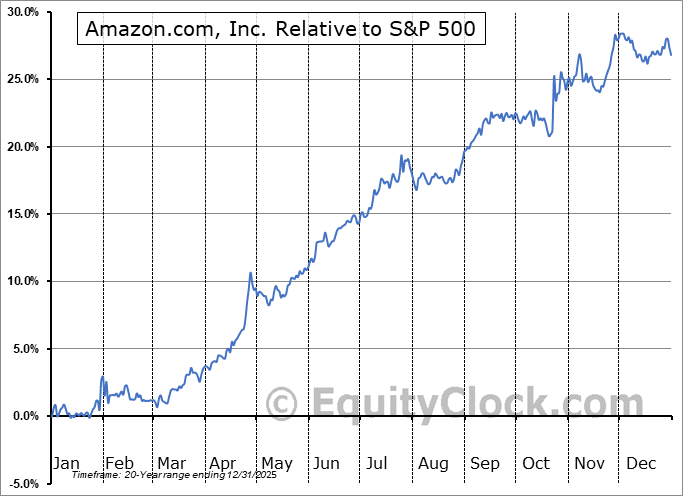
Nice bounce from the 200-day moving average (~232) for Amazon today. Around a month remains in the stock's optimal holding period that runs between February 28th and July 14th (up 17% so far since this period began). $AMZN
3
455
Jun 15
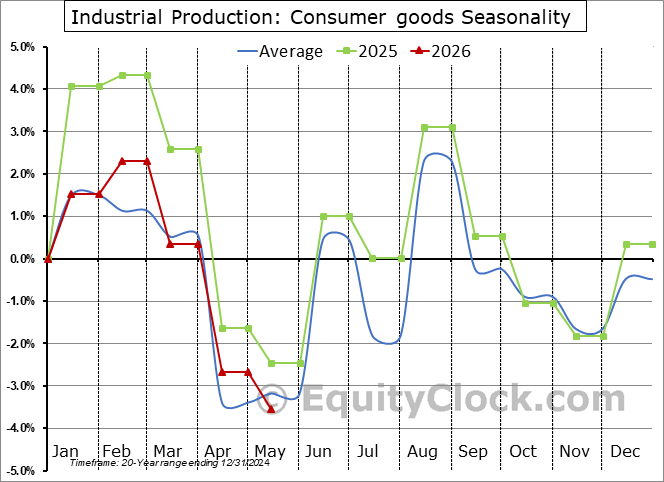
The report on industrial production highlights the bifurcated state of the economy with defense/space and AI components flourishing, while consumer segments struggle amidst a discerning consumer mentality. US Consumer Goods Production was down by 0.9% last month, which is among the weakest May performances in the past three decades and a divergence compared to the 0.2% increase that is normal for the spring month. $STUDY $MACRO $XLY #Economy #Manufacturing
1
3
373
Jun 15
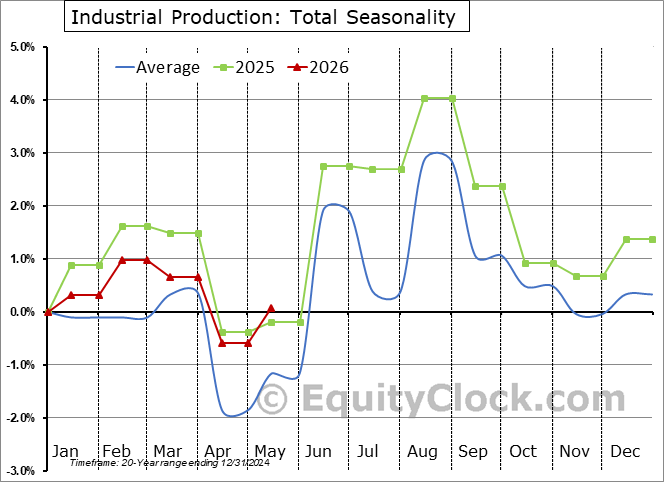
Strength in defense/space equipment and AI related manufacturing worked to support Industrial Production in May. US Industrial Production increased by 0.7% last month, inline with the average change for this time of year. $STUDY $MACRO $ITA #Economy #Manufacturing
3
347
Jun 15
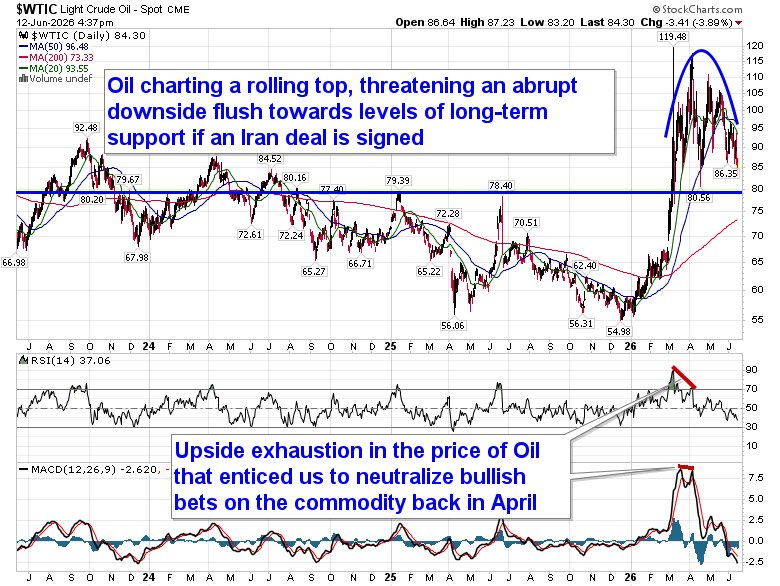
In our last report to subscribers, we highlighted the rolling top on the price of oil, threatening a downside flush to levels of long-term support should an Iran deal be reached.
While near-term downside risks are obvious, this rise in the price of oil since February is unlikely to be a one-and-done event with the high demand summer driving season upon us. #OIL
2
1
16
1,092
Jun 14
Historical blockbuster IPOs have typically experienced substantial post-IPO drawdowns. equityclock.com/2026/06/13/s… $SPCX $AMZN $META $BABA
5
589
Jun 11
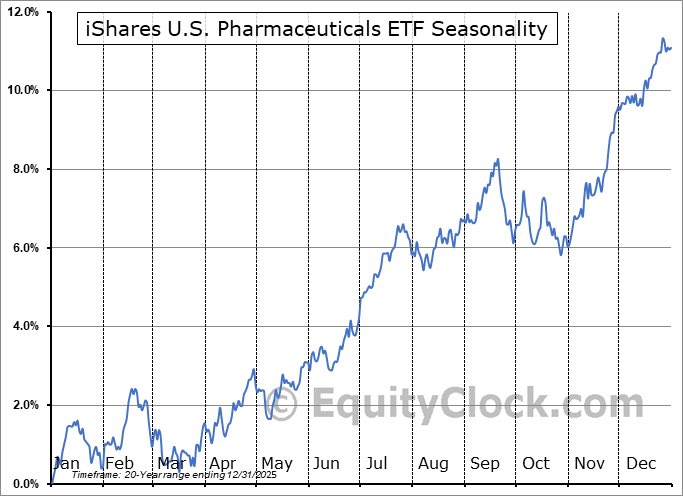
Generating healthy returns in our pharmaceutical holdings today: optimal holding period between May 8th and September 6th. Pharma holdings have been the ideal offset to Tech volatility in recent days, keeping our return profile positive in both up and down market sessions so far this month. $IHE $PFE
1
7
433
Jun 11
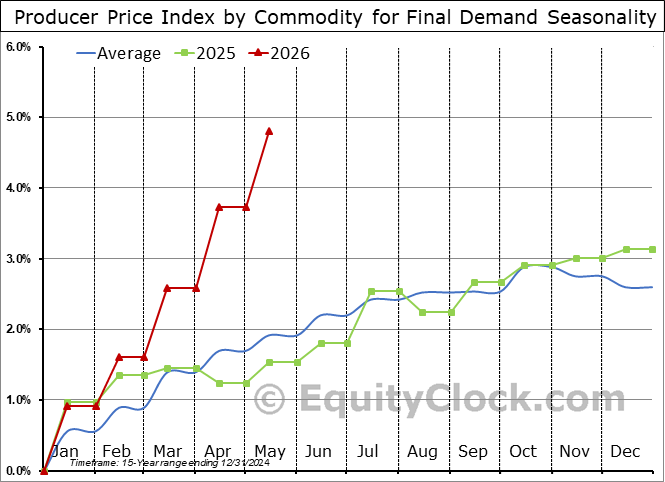
It is not just the rise in energy prices that is imposing a burden producers; durable goods/capital equipment, services, transportation/warehousing, in addition to energy, are showing increases in prices through the first five months of the year that are among the largest on record. The Producer Price Index for Final Demand is up by 4.8% (NSA) year-to-date, more than double the 1.9% increase that is average for this timeframe. The need for inflation hedges in portfolios is essential. $MACRO $STUDY $TIP #Economy #PPI
1
2
357
Jun 11
Following the cues provided by the Consumer Price Index (CPI) report to position portfolios for the summer. equityclock.com/2026/06/10/s… $XLY $XLE $XLRE
2
442
Jun 10
Can you spot the point on this chart of CPI compared to the seasonal norm when the conflict in Iran began? US CPI is higher by 3.4% (NSA) year-to-date, remaining derailed from its average pattern as the energy disruption inflates the cost of fuel. The average increase five months into the year is 2.2%. $STUDY $MACRO #Economy #Consumer
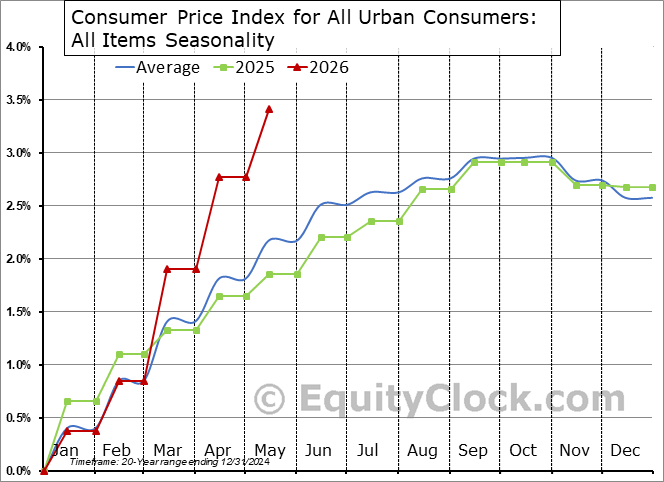
1
6
508
Jun 10
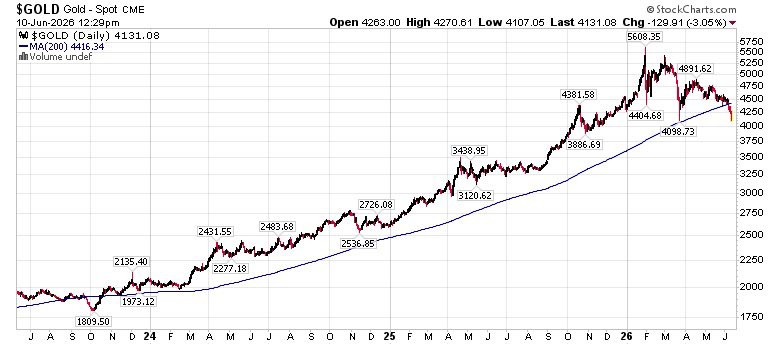
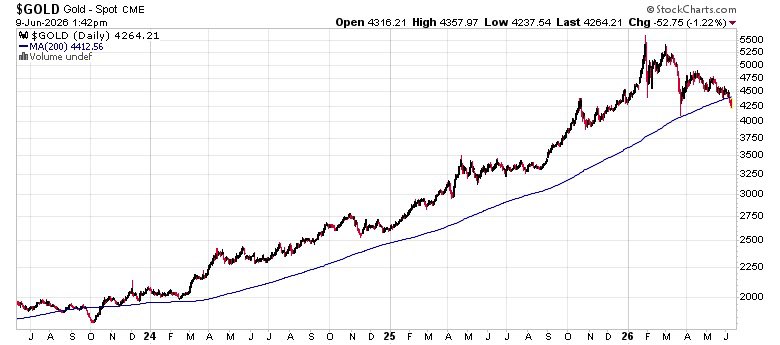
Gold below its 200-day moving average for the first time since 2023; We break down when and where to look to pickup exposure. equityclock.com/2026/06/09/s… $GLD $GC_F $GDX #Gold
3
508
Jun 9
A surge in energy and fertilizer exports, amidst the impact of supply disruptions from the closure of the Strait of Hormuz, is promoting a healthy trade surplus for Canada in the month of April. Exports from Canada slipped by a mere 1.3% (NSA), which is among the better April performances in the past two decades and well ahead of the 7.7% decline that is average. $STUDY $MACRO #CDNecon #CAD
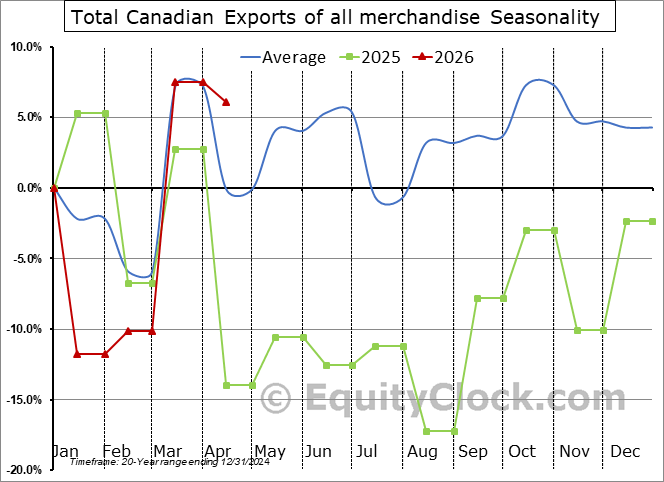
1
2
433
Jun 9
Price of Gold below its 200-day moving average for the first time since 2023, but it is unlikely that the long-term rising trajectory has come to an end.
We have been all over this digestive move from the strength of the past couple of years with our leveraged inverse bet on Gold Miners $DUST, a position that is up well over 40% in the past few weeks.
We have been keeping subscribers abreast of when to be short this precious metal play and when we expect to book profits and flip back to the long side. $GLD $GC_F $GDX
1
2
9
772
Jun 9
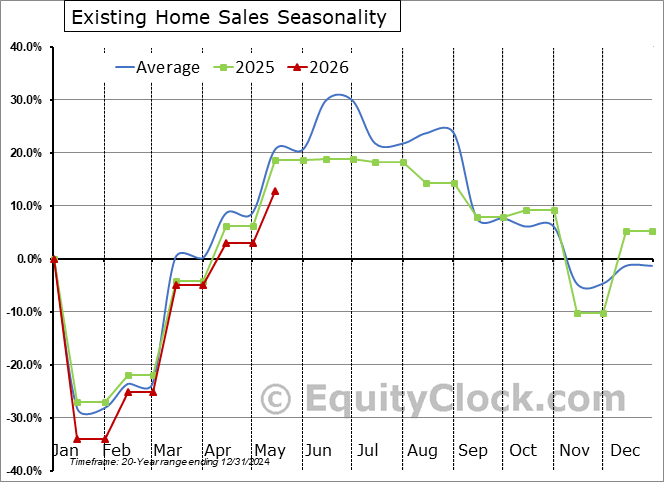
While headlines appear to be praising the better than expected increase in existing home sales for May, one of the weakest increases for this time of year in the past two decades is not exactly a statistic to get enthusiastic over.
Sales of existing homes in the US increased by 9.6% (NSA) last month, which is firmly weaker than the 11.2% rise that is average for May.
The 12.7% year-to-date rise in activity is the weakest performance outside of a recession (pandemic included) in the past 25 years.
Prices are similarly showing below average performance.
$STUDY $MACRO #Economy #Housing
2
5
401