
We investigate non-coding RNA, circRNA, Gene-regulation and epigenetics in cancer with a translational focus.
Joined November 2019
- Tweets 99
- Following 246
- Followers 344
- Likes 1,784
5 Photos and videos

Pinned Tweet

28 Aug 2021
A huge thanks to the Danish Cancer Society @cancer_dk for this very prestigious research prize. I am truly honored! Also a huge thanks to all of my current and former collaborators- this prize belongs to all of us! #DKD2021 #dkforsk
27 Aug 2021

Stort tillykke 🏆 til Anders Rosendal Korshøj og Lasse Sommer Kristensen med @cancer_dk Juniorforskerpriser 2021 for fremragende forskning i hhv hjernekræftkirurgi og epigenetik @HelenBernt
@AarhusUni @AUHdk #DKD2021 #dkforsl #forskpol
8
41
Lasse Sommer Kristensen retweeted

8 Jul 2024
Which stage II #coloncancer patients should receive #chemotherapy after surgery? A ground-breaking study in @AJPathology found #RNAbiomarkers have great potential to identify patients who may benefit. spkl.io/6012479a8
@ASIPath
@chhavic
@kristensen_Lab
3
6
622
Lasse Sommer Kristensen retweeted

6 Jun 2024
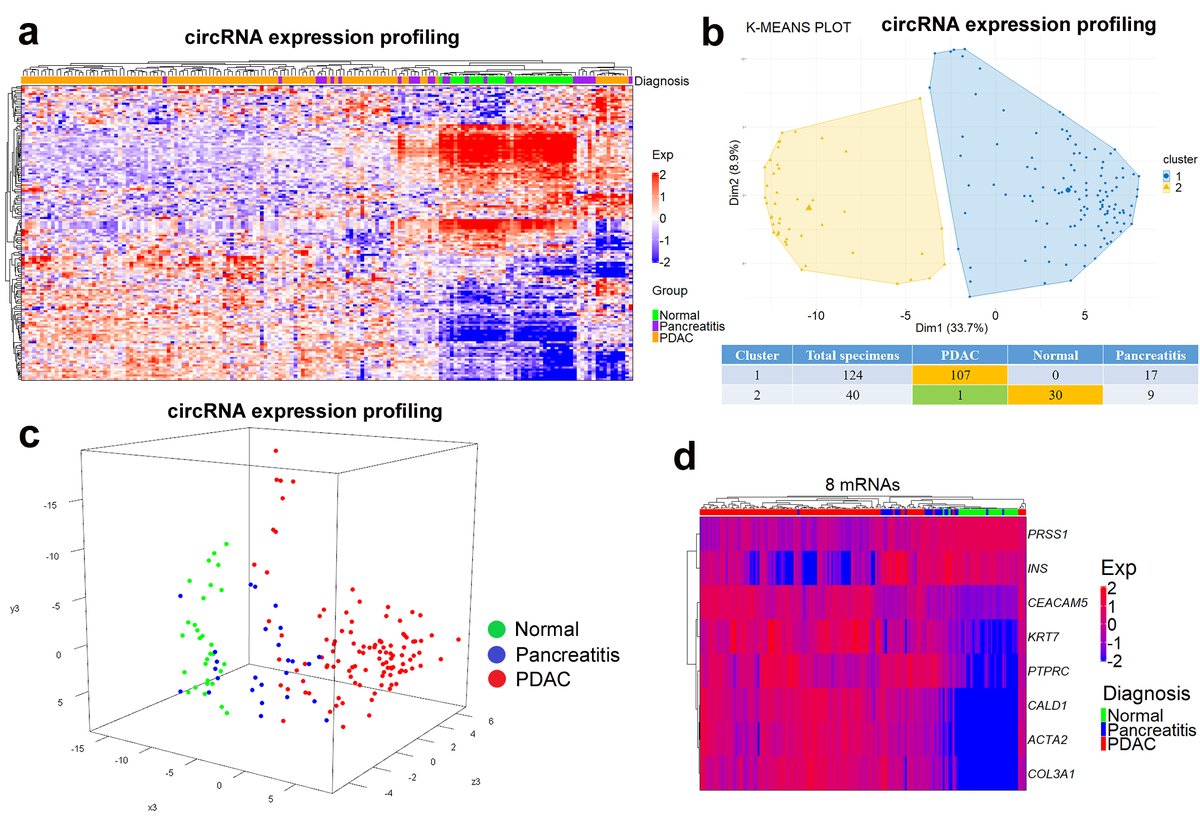
- What about prognostic role of circRNAs in pancreatic cancer (PC)?
- RNAseq identified 20,440 unique circRNAs
- Evaluated 152 circular RNAs in 108 specimens
👉 Three cirRNAs held isolated prognostic value in resected PC @Kristensen_Lab @DetlefsenSoenke
👉 bit.ly/3WRIRNd
2
3
240
Lasse Sommer Kristensen retweeted

21 Nov 2023
We are looking for a postdoc to join our growing lab in Denmark! If you are interested in pancreatic cancer metabolism and interactions with the TME, check this out 👇🏻. Deadline: 17 Dec. Please spread the word.
health.au.dk/en/about-health…
1
23
35
6,939
Lasse Sommer Kristensen retweeted

21 Nov 2023
We’re all wondering what the future of #spatialtranscriptomics (ST) has in store. Well, I think the near future will look a lot like the new 6000-plex dataset reviewed here (link to the original source at the end of this post).
SAMPLE
An entire 100 mm² intact 5 µm FFPE section from a skin squamous cell carcinoma was profiled for 6,000 unique RNA targets plus four protein markers (CD298/B2M, CD45, PanCK, CD68) and DAPI for nuclear staining using the NanoString CosMx Spatial Molecular Imager. Altogether, over half a million cells were profiled, segmented, and analysed from billions of mapped molecule coordinates.
With this particular cancer sample, the skin surface looked normal but the underlying tumour structure was complex. See Figure 1A for imagery and further detail.
Note in Figure 1B how protein markers are critical to defining accurate cell boundaries for segmentation and plotted transcripts underscore the super density of this dataset.
OPTICAL CROWDING
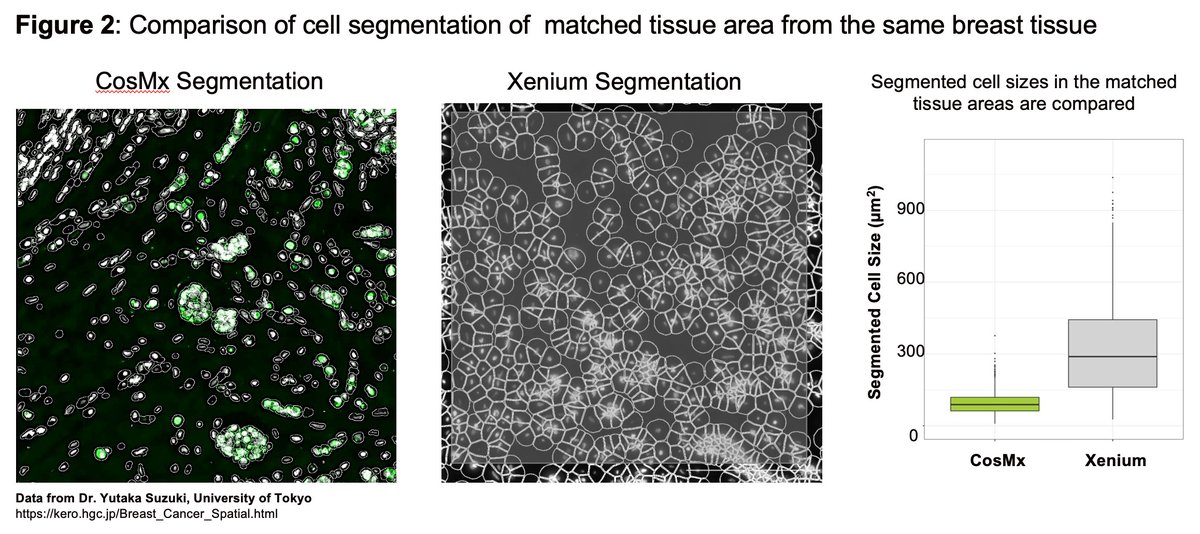
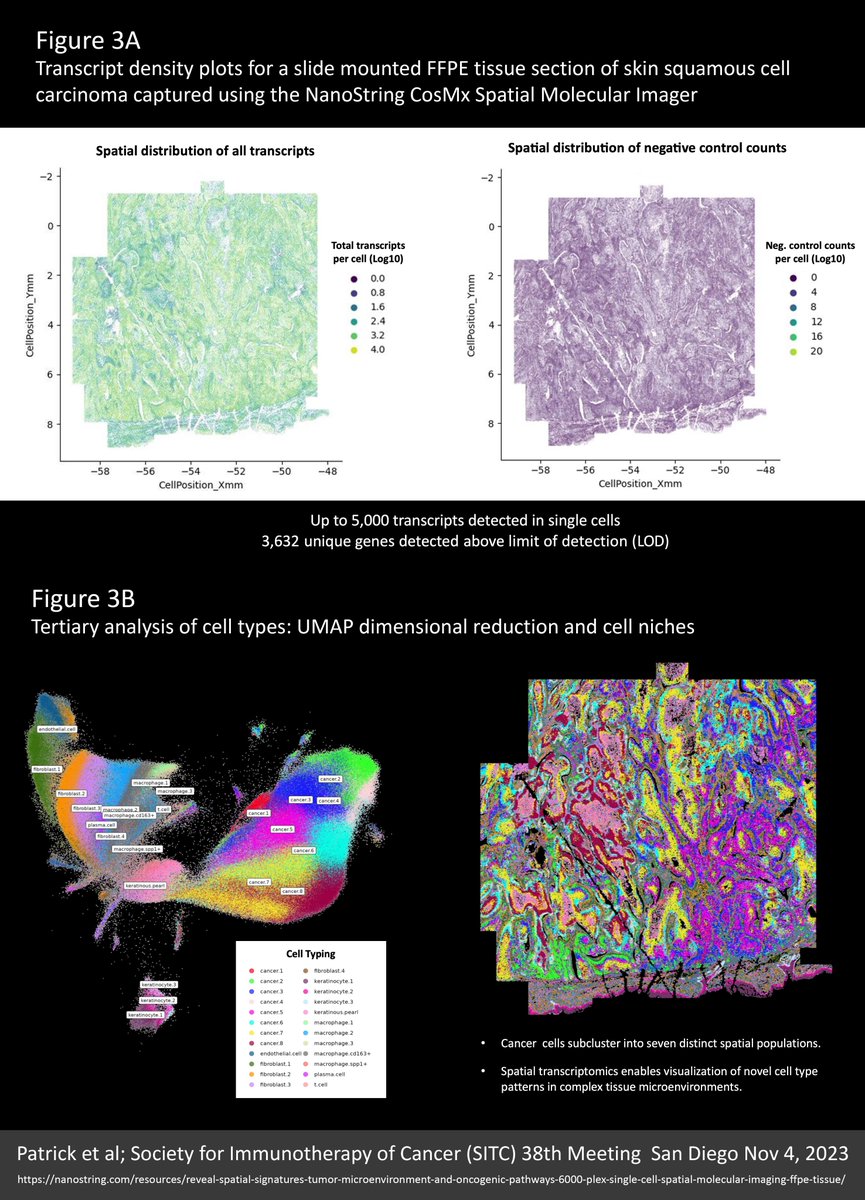
A common pain-point in the ongoing debate over the relative merits of the $NSTG NanoString CosMx and $TXG 10X Genomics Xenium molecule-mapping ST platforms, is the anguish in avoiding “optical crowding” and saturating the “signal space” with either too many targets, higher expressing targets, or both. I only discovered these terms following 10x Xenium discussions; they were never part of the NanoString lexicon. With this dataset we see why: Most of the cells surveyed contained over 2,500 transcripts and some mapped up to 5,000 transcripts per cell, yet there is no evidence of overcrowding. What’s more, these very high counts were obtained from accurately segmented cells that are typically 300-400% smaller than you obtain when similar cells are segmented using the Xenium “expansion” method, detailed in my recent X post reviewing data from the lab of Dr Yutaka Suzuki at University of Tokyo. Figure 2 from that previous X post is reproduced below. This only makes this 6000-plex dataset 300-400% more impressive! See Figure 3A for transcript density plots cor this skin carcinoma sample.
NEGATIVE CONTROLS
Another discussion point is negative controls and the smoke and mirrors of “false discovery”. Note that negative controls vary across the tissue relative to the density of the cellular matrix (Figure 3A). This is simply because individual molecules are “sticky” and the more cellular matrix available the more get stuck, such that a distribution plot of negative control counts/cell (in Figure 3A) recapitulates a detailed image of the tissue structure. That said, counts are very low (less than a total of 4 per cell from the 10 separate negative controls included in the assay).
CELL TYPING
A UMAP dimensional reduction plot of cell types shows a predominance of fibroblasts, keratinocytes, and macrophages. On the cancer side, a distinctive “keratinous pearl” cell type and at least eight separate but interrelated cancer subtypes are evident (Figure 3B). A niche analysis beautifully resolves seven intricately detailed spatial population clusters, emphasizing the complexity of this carcinoma (Figure 3B).
CELL TYPE VERIFICATION
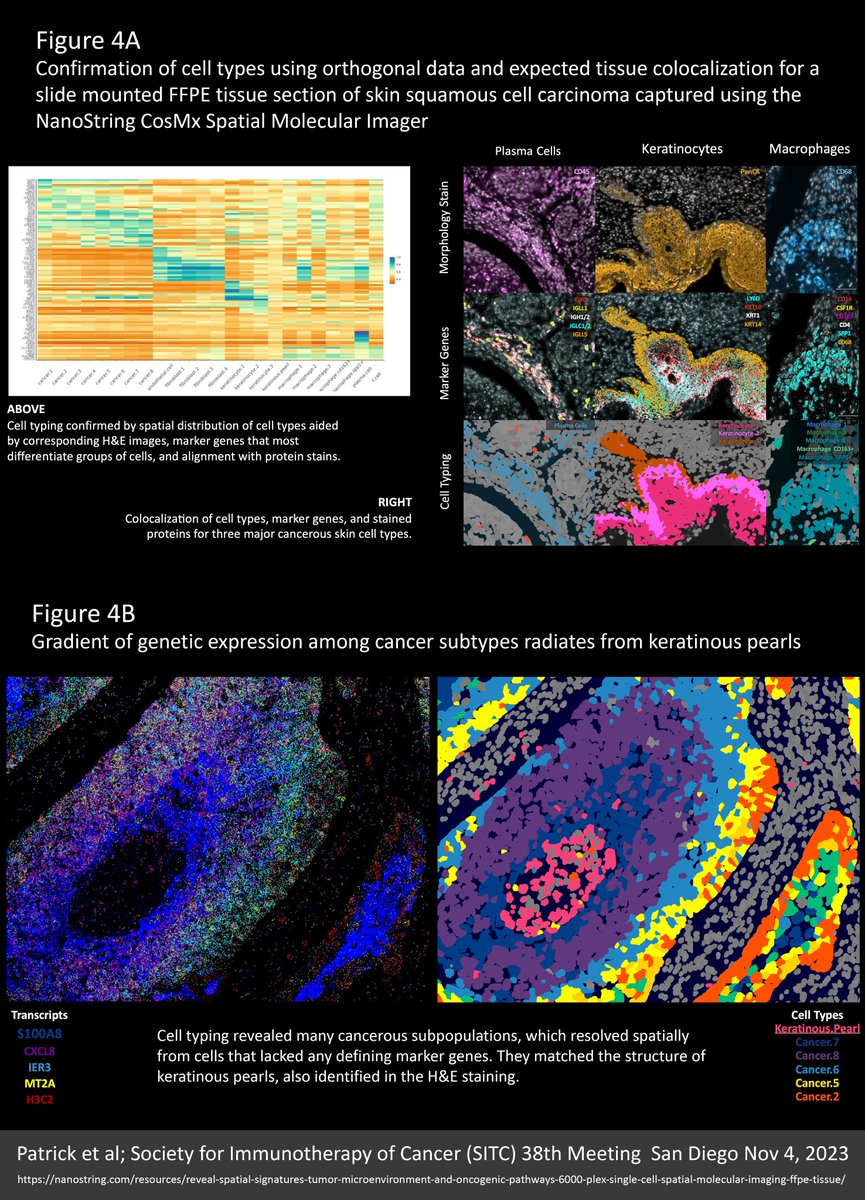
Super density ST data (thousands of targets and thousands of transcripts per cell) allows for greater certainty and nuance in cell typing. This is underlined by the multitude of cancer type variants and the fine gradation between them. Accurate cell typing was confirmed by how well the spatial distribution of cell types corresponded with orthogonal data from H&E images, marker genes that most differentiate groups of cells, and alignment with protein stains. Figure 4A demonstrates colocalization of cell types, marker genes, and stained proteins for three major cell types.
NEW BIOLOGY
Interestingly, a gradation of cancer cell types was found to radiate in clearly defined rings around keratinous pearl cell core structures. These cancer subpopulations resolved from cells that lack any defining marker gene (Figure 4B).
CONCLUSIONS
Unsurprisingly, higher plex assays generate more biological insight and greater spatial detail. Kilo-plex assays will be an expectation.
Assays need a protein information layer. This also will be an expectation. Not only is this critical for accurate cell segmentation (where inaccuracies contribute the most noise and obfuscation of results) but also for biological insight and orthogonal multiomic validation. The trend will be to higher and higher plex same-cell protein data that digitally overlays the RNA layer.
I’m so very excited by this new wave of spatial transcriptomics (ST) technologies. They will not only massively expand biological insight but also our appreciation for the exquisite beauty of multicellular organisation.
Find the original Poster publication for this NanoString 6000-plex dataset here:
nanostring.com/resources/rev…
@AlbertVilella @BlauerPlums @lee_spraggon @NeBanovich @ArpitaBKulkarni @GenomicsCow @aruthak @GESTALT_sp @HumphreysLab @DavidPCook @DrJasPlummer @TheGregoryLab @m_mohenska @kirkbjensen @nikhil_seq @Kellieiswise @pinkney_holly @ioavlachos @rkhyip @LGMartelotto

5
30
147
30,708
21 Jul 2023
A must-read for all that do bulk analyses👉Spatial circular RNA expression patterns vary systematically in different compartments of tumors and adjacent normal tissues. Published in Cancer Research @CR_AACR. Great work by @JuanLGaRod and all co-authors doi.org/10.1158/0008-5472.CA…
1
5
12
1,076
Lasse Sommer Kristensen retweeted

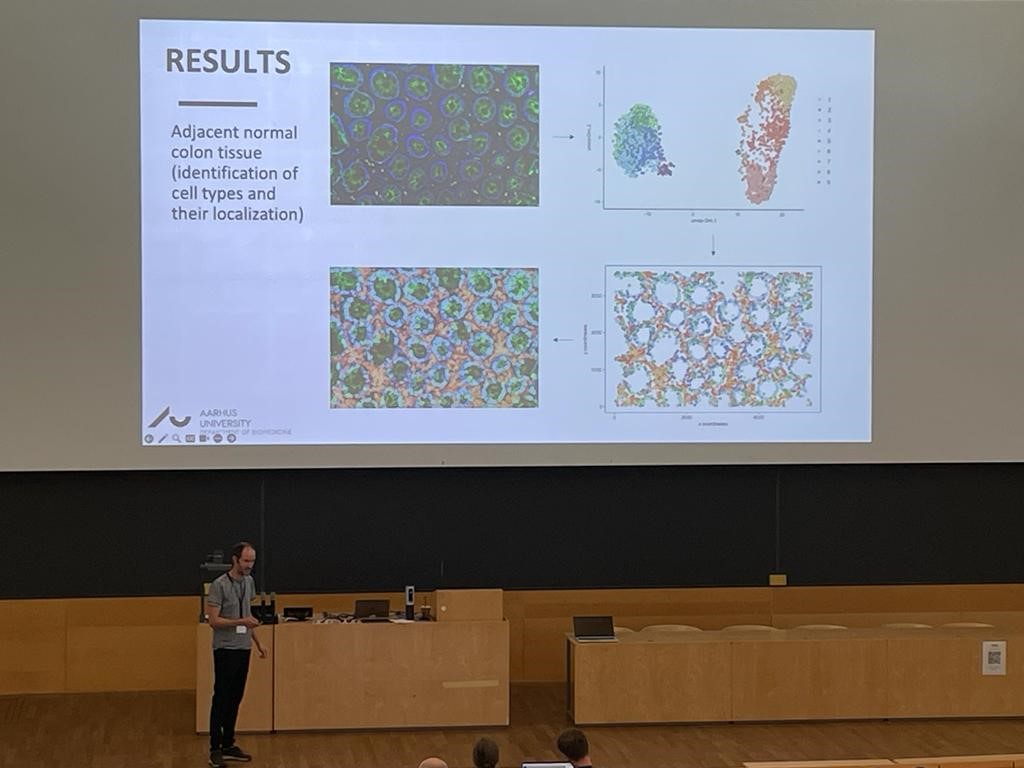
23 Jun 2023
Thrilled to see Lasse Sommer Kristensen from @Kristensen_Lab sharing his groundbreaking spatial #singlecell data insights generated with CosMx SMI at the CellX meeting in Aarhus, Denmark.
Curious about what CosMx can do?
👉bit.ly/42XPQTU
1
10
875
Lasse Sommer Kristensen retweeted
16 Jun 2023
WE ARE HIRING! We are looking for a motivated postdoc to work on a fully-funded project studying the role of iron metabolism in drug resistance in pancreatic cancer. 3 weeks left to apply. Please spread the word.
au.dk/om/stillinger/job/post…
lnkd.in/eNgDM74z
27
26
3,720
Lasse Sommer Kristensen retweeted

14 Jun 2023
📢 #bioinformatics job openings! 🎓
Come join my group and help me push the boundaries of omics analysis. I have exciting opportunities for both a Ph.D. and Post-doc position.
More info 👇
Retweets are really appreciated 🙏 !
#AcademicJobs #PhDOpening #PostDocPosition
5
34
64
16,176
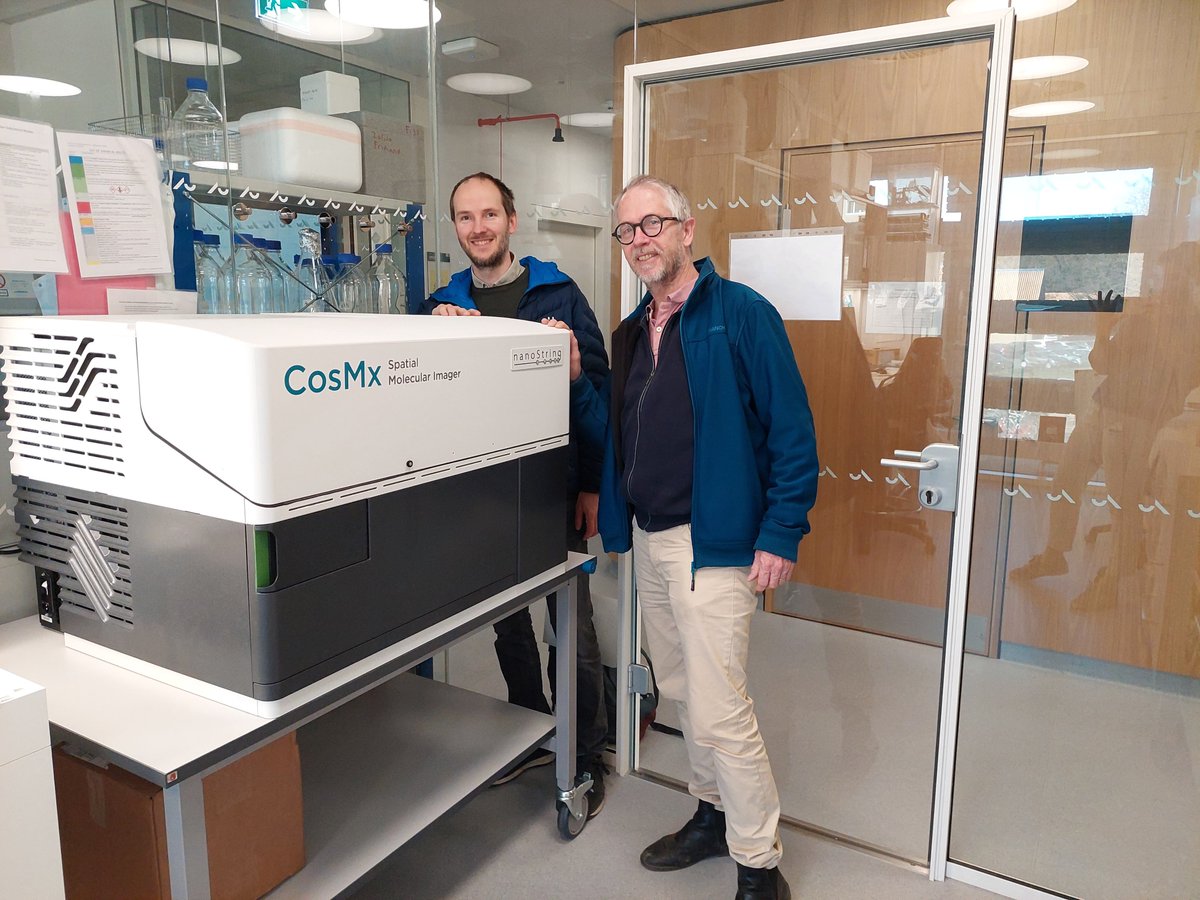
13 Apr 2023
As part of CellX, we finally got this incredible piece of equipment from @nanostringtech. #spatial #singlecell #transcriptomics #CosMx here we come😆 @kjems_rgen
3
4
54
3,497
15 Mar 2023
I am very happy to share that our work describing how U2AF1 mutations impact circular RNA expression in myelodysplastic neoplasms has been published in Leukemia @LeukemiaJnl Huge thanks to Eileen Wedge, @Ahmadov_Ulvi and all our collaborators! rdcu.be/c7FoP
5
300
6 Mar 2023
I am delighted to share our latest work together with @kjems_rgen, @N_Rajewsky, @MarkSDenham, and @JeroenPasterk spearheaded by @SabineSeeler and Maria Andersen on #circRNA in Neural Development published in Molecular Neurobiology link.springer.com/article/10…
1
1
13
1,451
Lasse Sommer Kristensen retweeted

4 Feb 2023
Second call for a postdoctoral position in 'Nuclear RNA Sorting' in the Heick Jensen lab, Aarhus, Denmark. Apply here: mbg.au.dk/en/news-and-events…
38
37
10,577
Lasse Sommer Kristensen retweeted

1 Feb 2023
Interested in evolution, single-cell analysis, spermatogenesis and speciation in primates? Two ERC-funded postdoc positions (2 and 4 years) are available in the group, see tinyurl.com/44emdevp and tinyurl.com/2xss84b9. Deadline March 1. Please RT.
11
7
2,135
27 Oct 2022
Only three days left to apply!!! - is this your chance to join a vibrant and social lab with many ongoing exciting research projects?🤓😄
11 Oct 2022

We are looking for motivated Ph.D. students to join our lab biomed.au.dk/kristensen-lab. Please apply here: health.au.dk/om-health/ledig… and spread the word 😀
4
11 Oct 2022
We are looking for motivated Ph.D. students to join our lab biomed.au.dk/kristensen-lab. Please apply here: health.au.dk/om-health/ledig… and spread the word 😀
8
9
1 Oct 2022
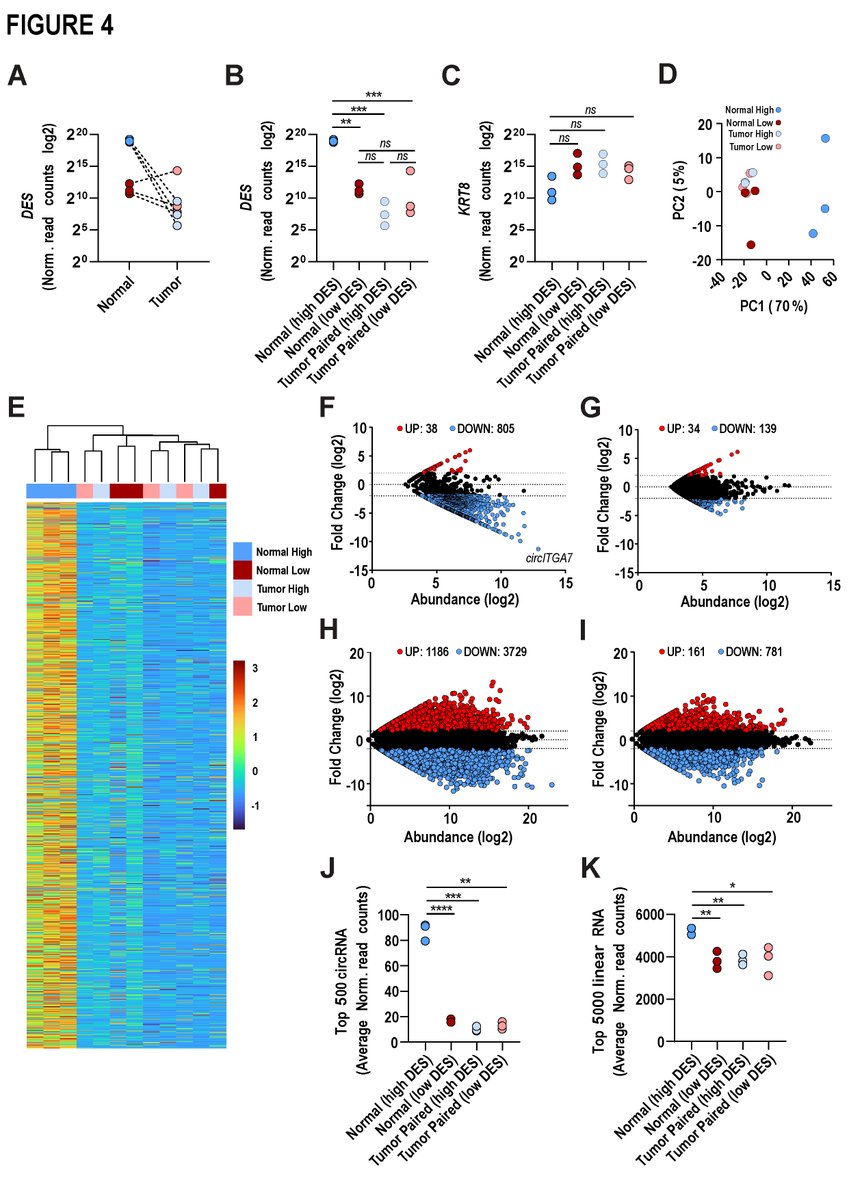
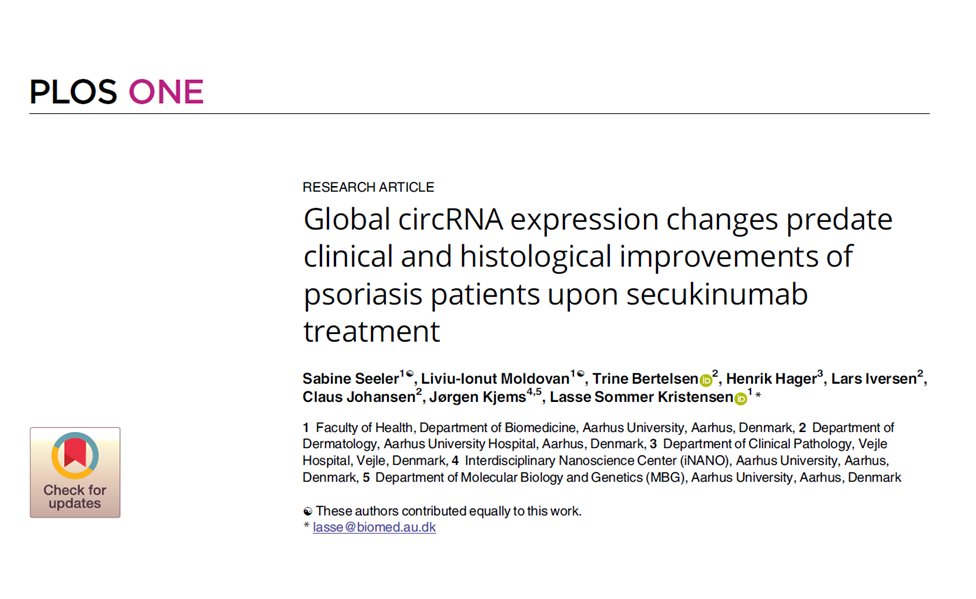
I am delighted to share our latest work spearheaded by @SabineSeeler on #circRNA in #psoriasis published in @PLOSONE where we uncovered a rapid shift in global circRNA abundance upon anti-IL-17A treatment predating clinical and histological improvements: journals.plos.org/plosone/ar…
1
13

Lasse Sommer Kristensen retweeted

Online! 🎯
#NoncodingRNAs and epithelial mesenchymal transition in cancer: molecular mechanisms and clinical implications
Read here 👇
jeccr.biomedcentral.com/arti…
#Metastasis
@IREISGufficiale
@Kristensen_Lab
3
4
17 Sep 2022
Interested in #RNA, #cancer, and #metastasis? Give our new review published in Journal of Experimental & Clinical Cancer Research @JournalofExper1 describing the role of #ncRNA in EMT a read: rdcu.be/cVKPe
1
4
Lasse Sommer Kristensen retweeted

2 Sep 2022
@Kristensen_Lab is playing hide-and-seek with metastatic cancer cells. Or mostly just 'seek'.
If you want to know what's actually going on, you can read more about the game on our website: projects.au.dk/odin/newsande…
#OpenInnovationInScience
1
3