
/ 16 / Election Mapping 🗺️ / Neoliberal / Political Analysis 📊 / Redistricting🦎 / Main @ModRightPatriot
Joined January 2026
- Tweets 383
- Following 613
- Followers 628
- Likes 531
121 Photos and videos


Pinned Tweet

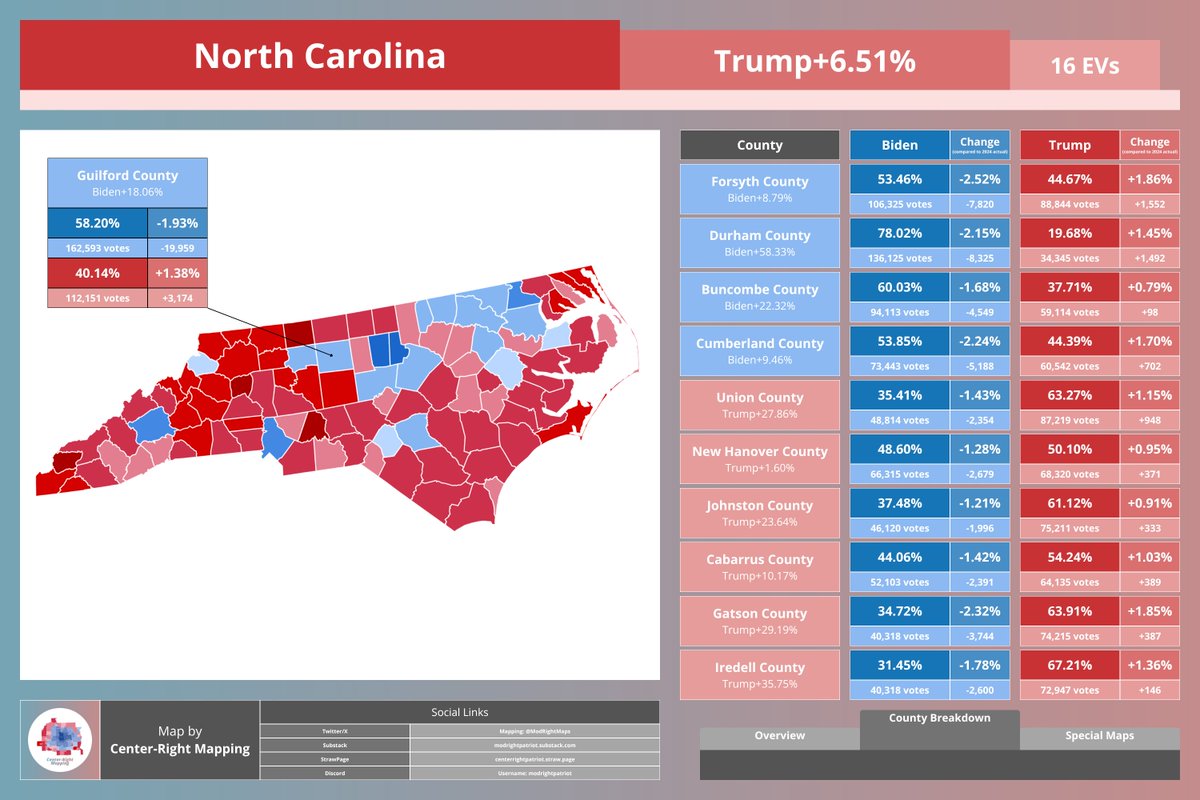
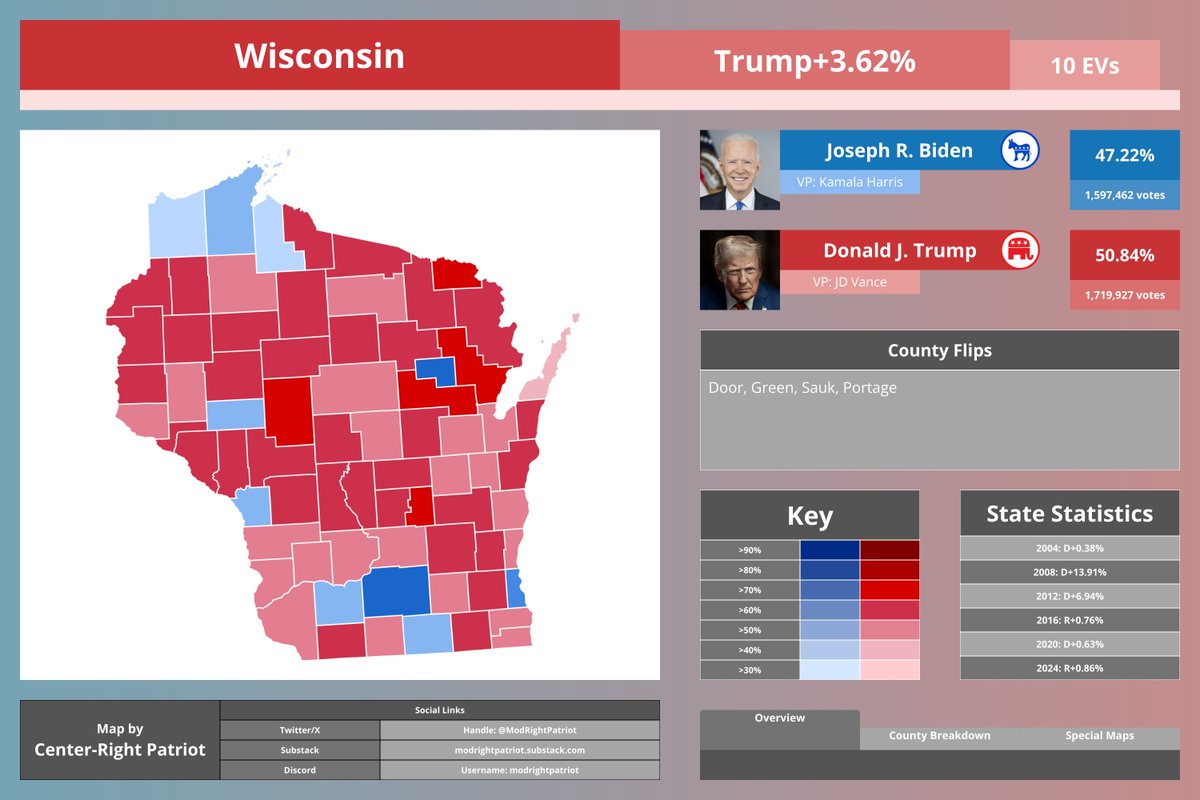
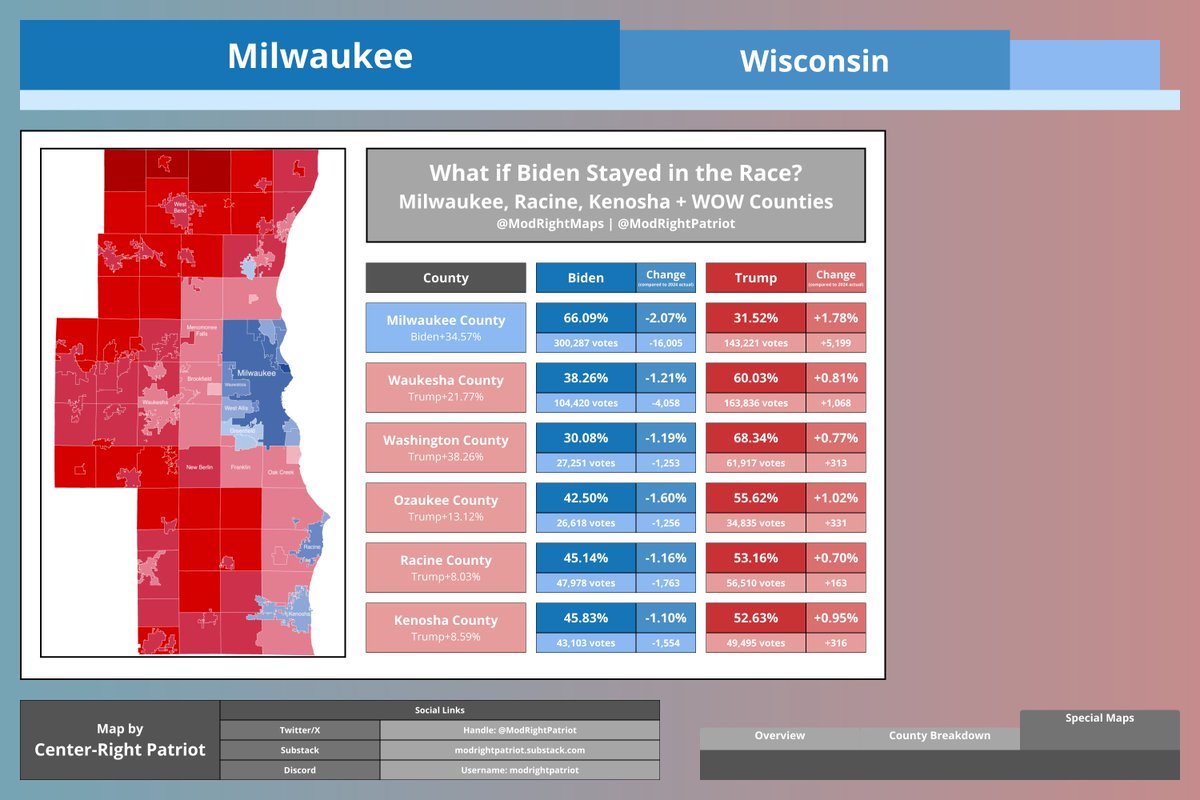
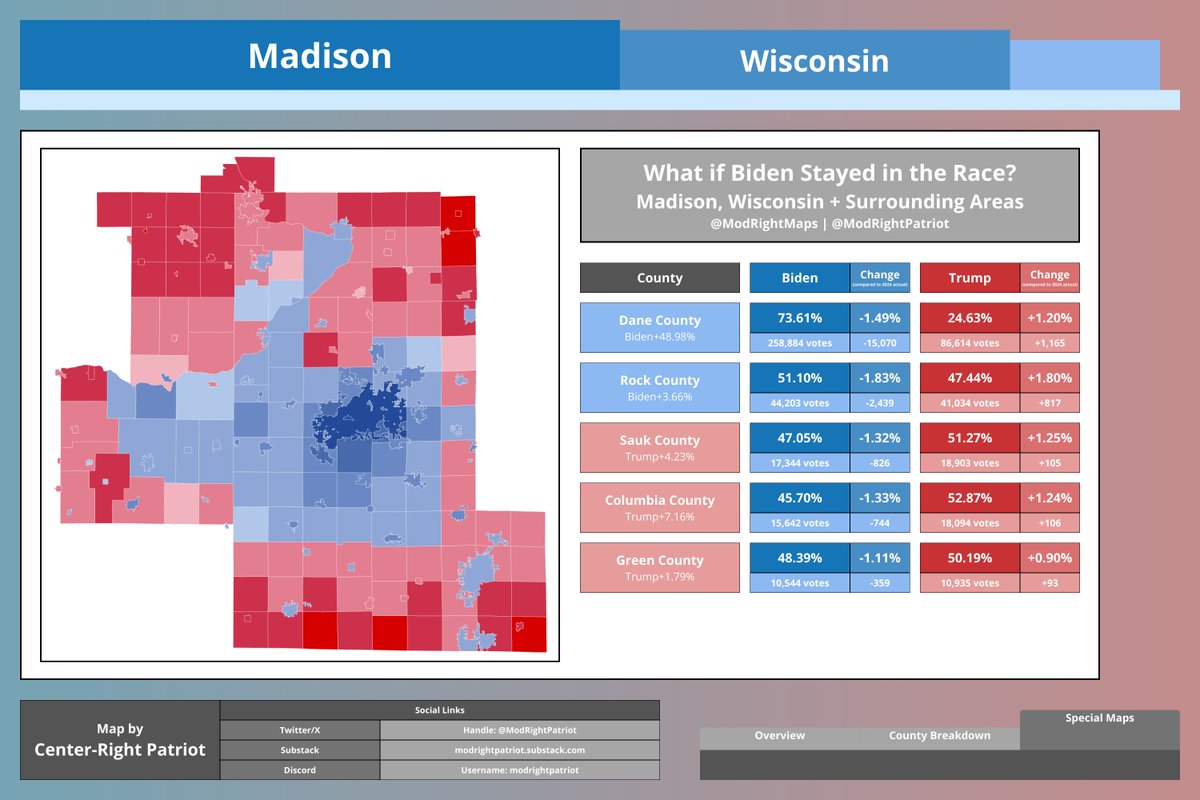
What if Biden Stayed in the Race? Wisconsin
🔴 Donald Trump: 1,719,927 (50.84%)
(Increase 22,301 votes, 1.24%)
🔵 Joe Biden: 1,597,462 (47.22%)
(Decrease 70,767 votes, -1.52%)
10
23
258
28,174
Center-Right Mapping retweeted

Jun 11
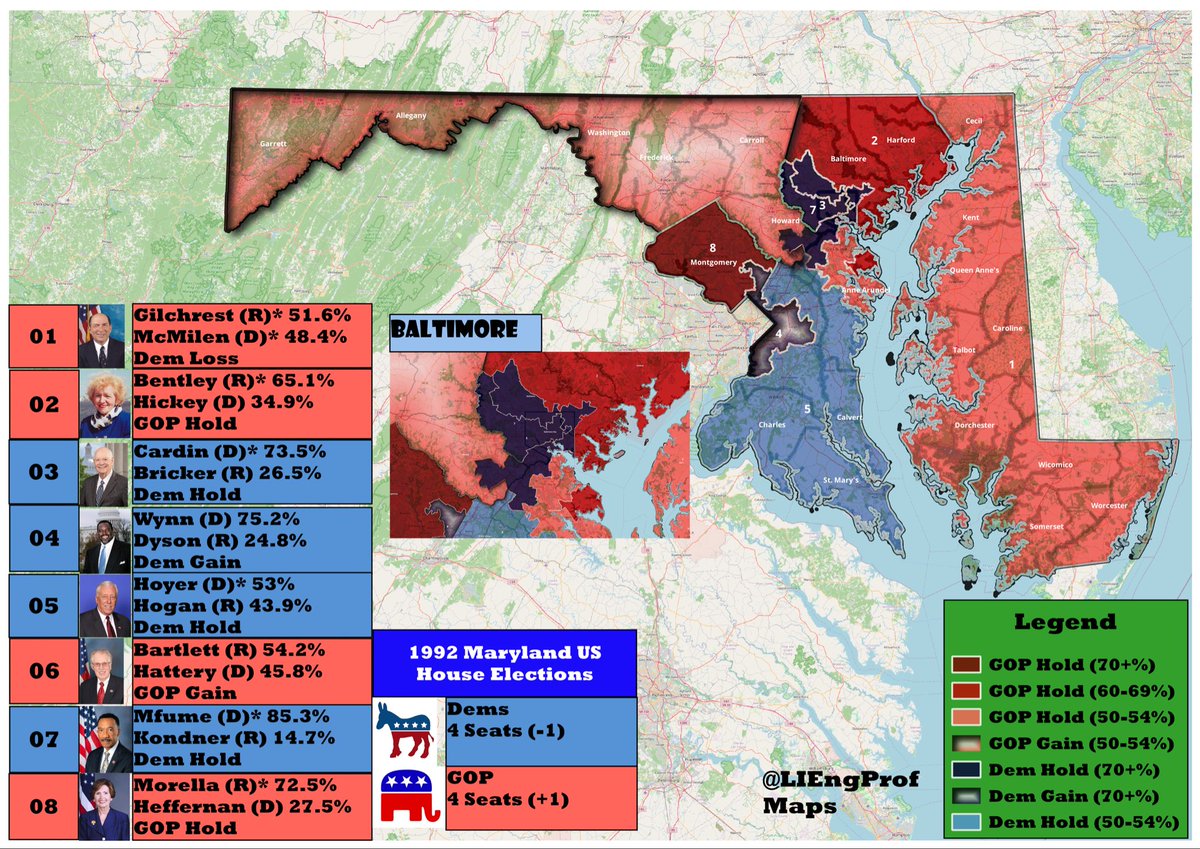
Happy belated birthday to former Rep Roscoe Bartlett, who turned 100 on 6/3!!
After an unsuccessful House run in ‘82, Bartlett won his seat (MD-06) in ‘92 when incumbent Beverly Byron was defeated by a more liberal Dem in the primary. Bartlett served until his defeat in ‘12.
Mappers: @MadLibHatter @bluearrowMaps @SageOfTime1 @Thorongil16 @DemHackMaps @JMilesColeman @RJ_maps @cinyc9 @redwoodcntymaps @NinetyDegreeZ @HugeGuilfordCo @tencor_7144 @josh_metcalf @nnjpolitics @Leonz0_o @ModRightMaps
5
10
63
7,272
Center-Right Mapping retweeted

DRA's new UI is so cool

9
2
50
2,259
Center-Right Mapping retweeted

Jun 10
Omg this new update is great!

5
1
66
2,555
Center-Right Mapping retweeted

Jun 10
Account Directory ig:
@ModRightPatriot - Main Account
@ModRightPriv - Private Account
@ModRightMaps - Mapping Account
@RubioFan67 - Backup Account
1
3
10
507
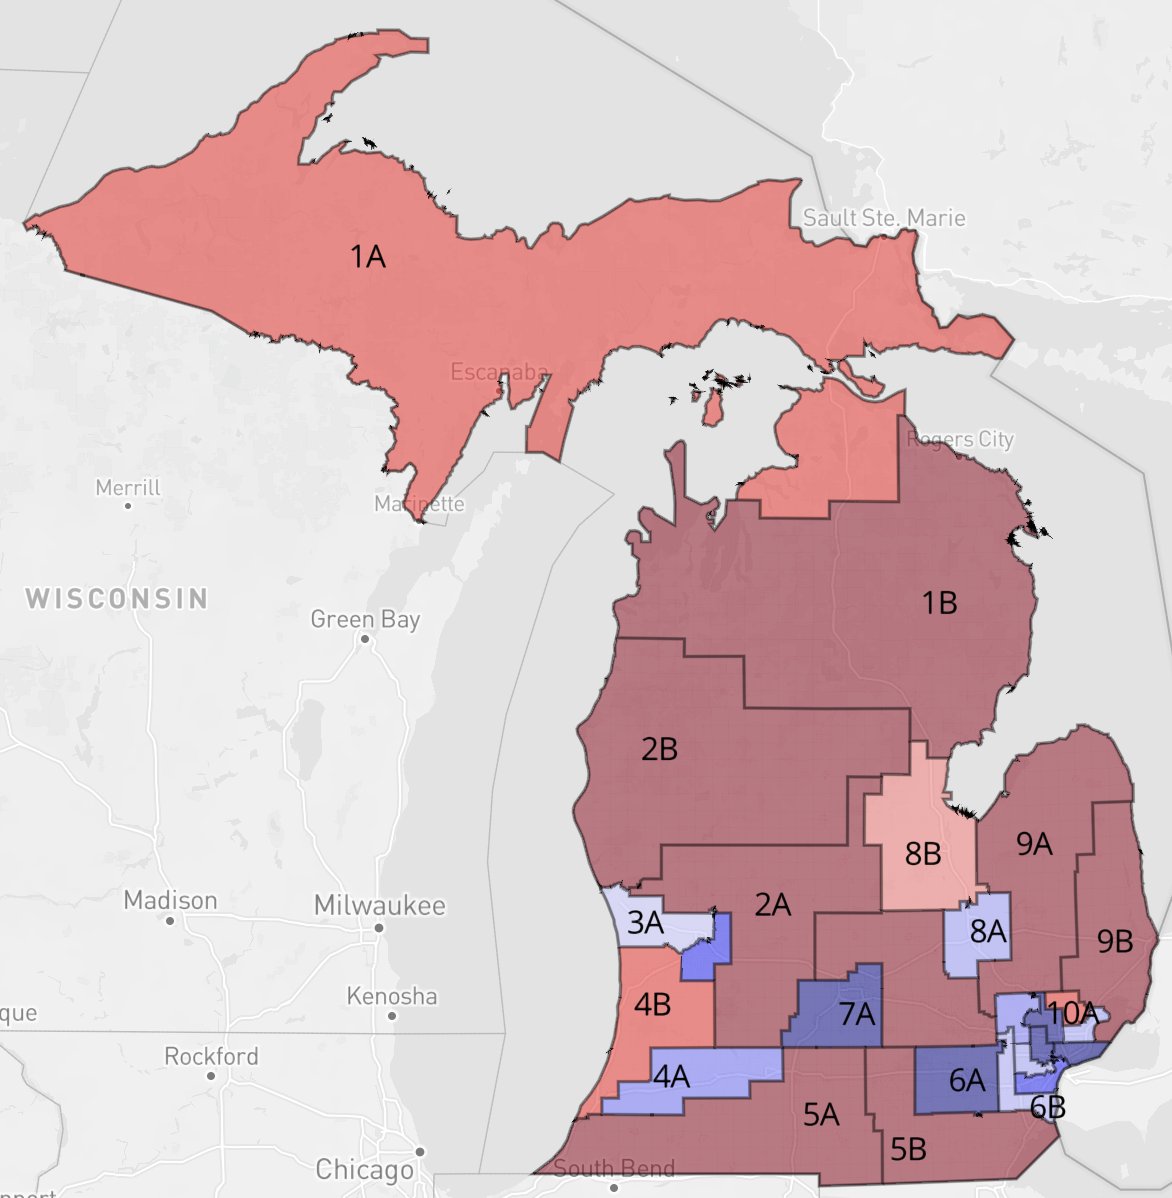
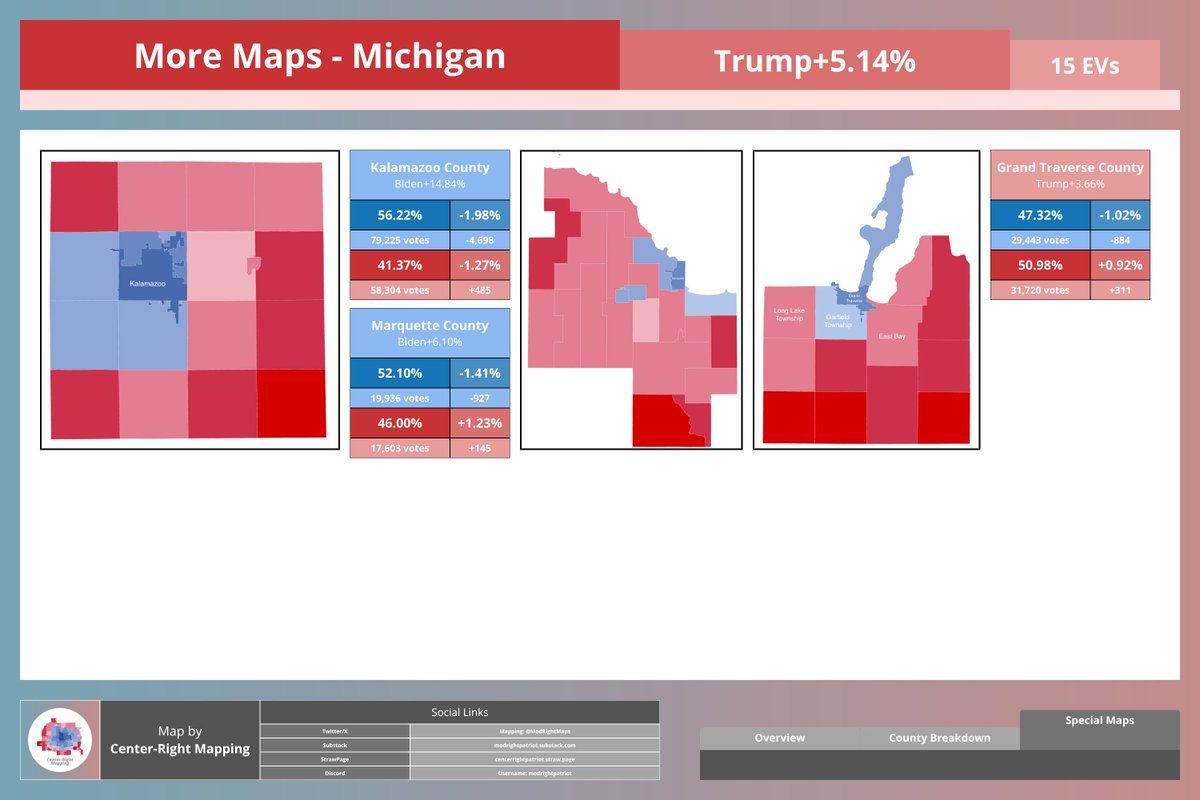
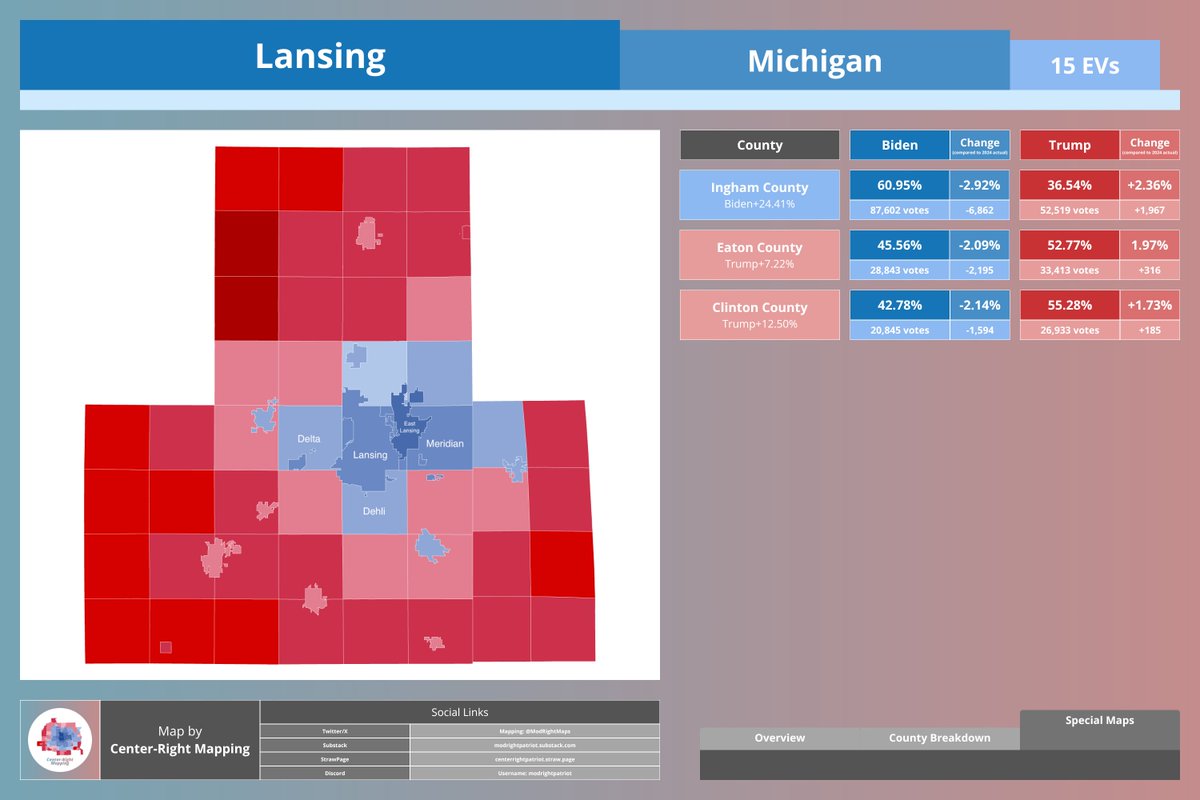
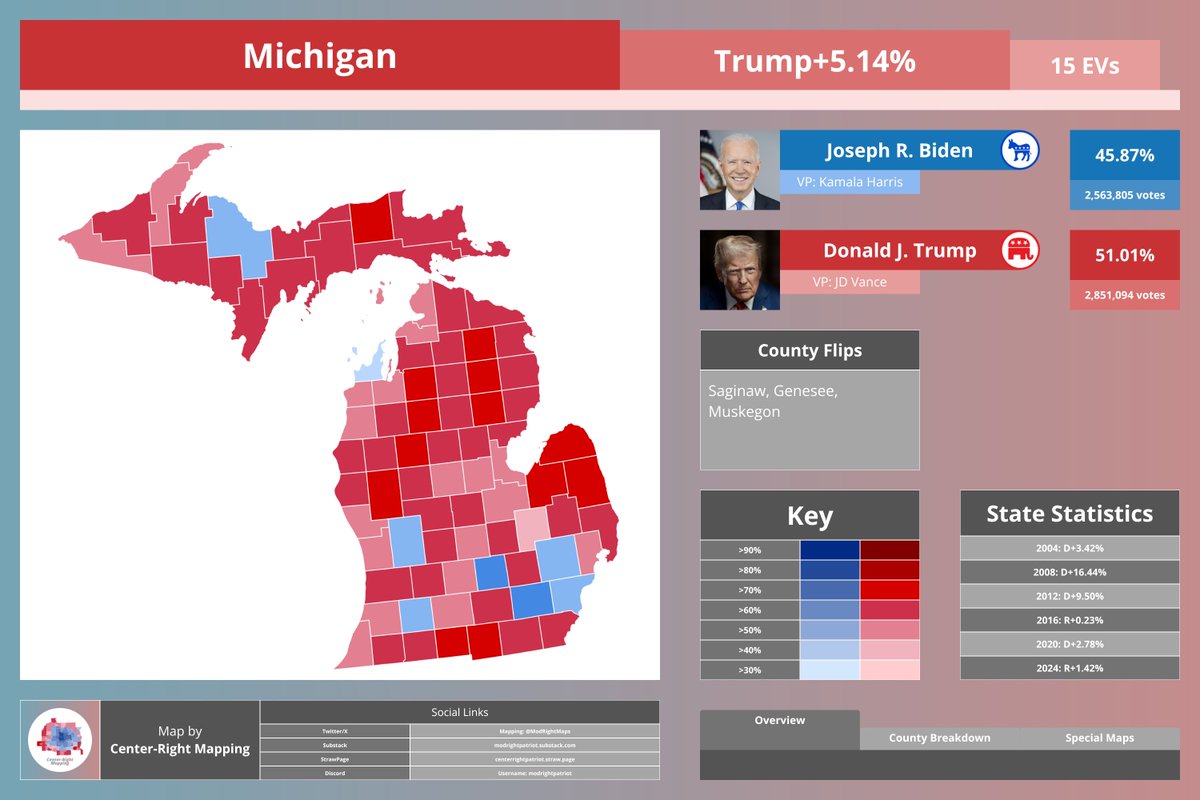
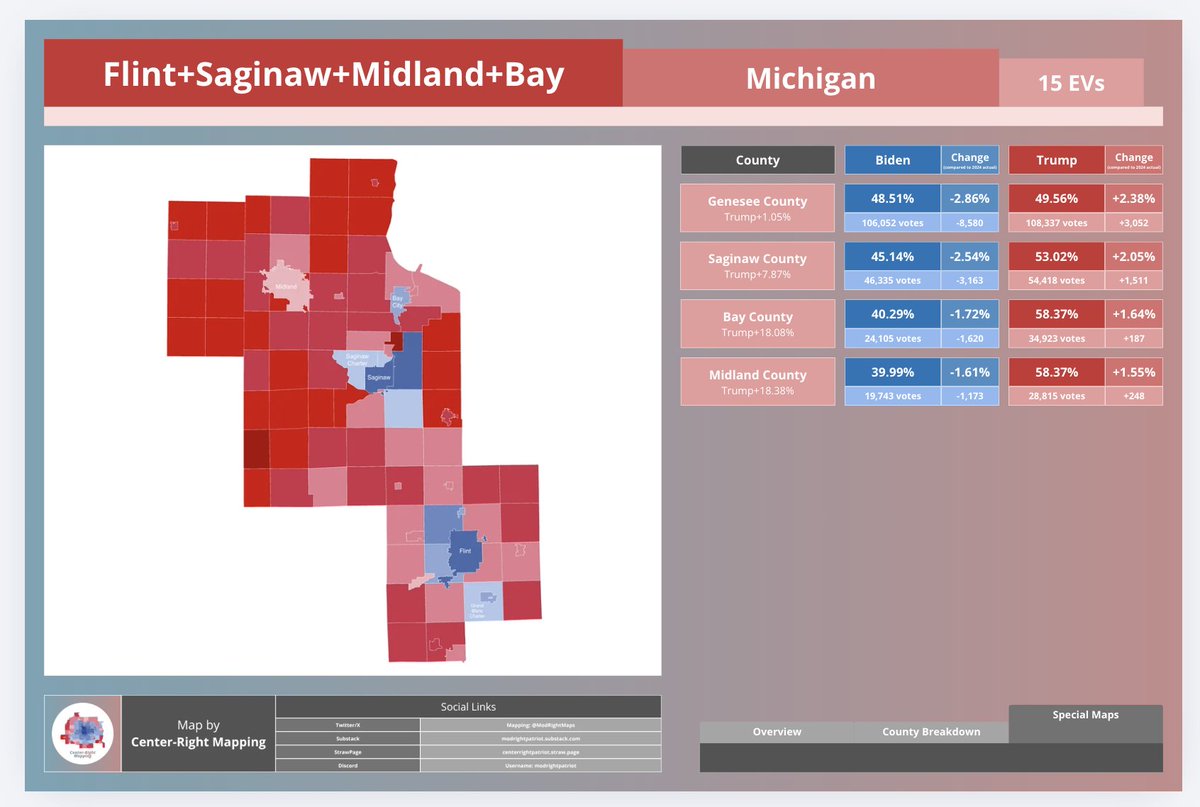
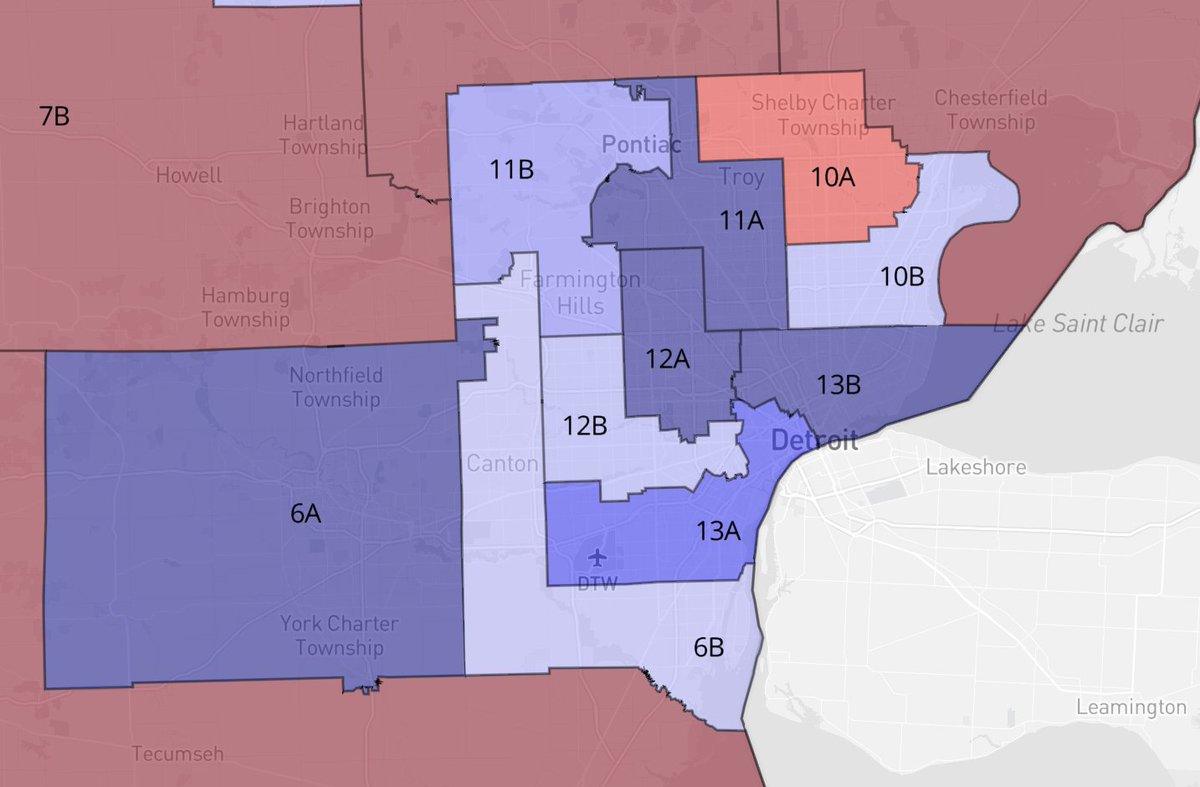
Michigan Split, I made a lot of these a while ago but never posted them because I forgot

1
15
1,705
I made an Indiana one as well but it is a bit ugly, I wanted to try to make competitive districts
5
238
Center-Right Mapping retweeted
May 31
The 1922 House elections in NY were a watershed year on making Dems the party of urban voters.
After being at a low point after Harding’s 1920 landslide, Dems gained a whopping 13(!) seats in NY (>70 nationwide) with 12 coming from NYC (the other from Rochester).
Mappers: @MadLibHatter @bluearrowMaps @SageOfTime1 @Thorongil16 @DemHackMaps @JMilesColeman @RJ_maps @cinyc9 @redwoodcntymaps @NinetyDegreeZ @HugeGuilfordCo @tencor_7144 @josh_metcalf @nnjpolitics @Leonz0_o @ModRightMaps
@admcrlsn @RyanGirdusky

May 30

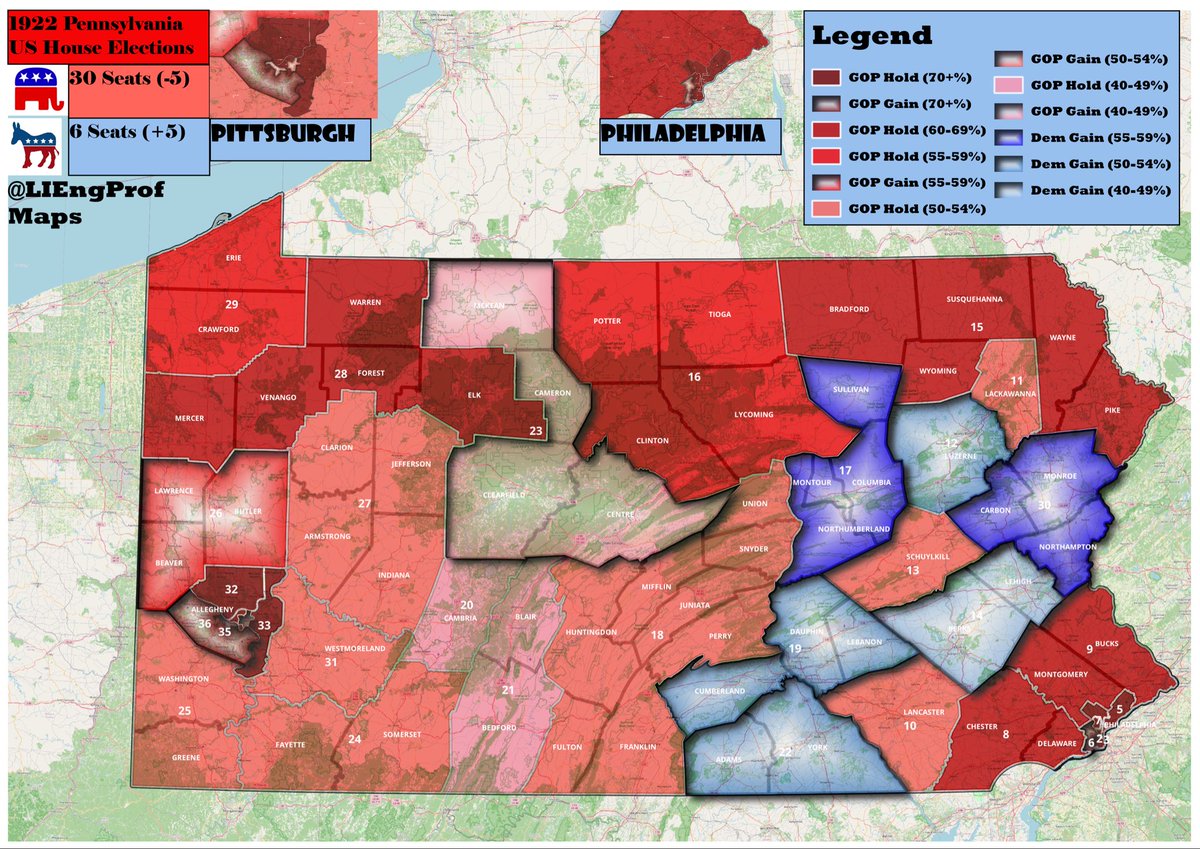
Hadn’t done a PA map in a while, so I give you the 1922 PA US House elections!!
The ‘22 elections saw Dems net 5 seats in PA as they gained >70 nationwide in Warren Harding’s midterm. While Rs maintained their hold on Philly & Pittsburgh, Dems made progress in eastern PA overall.
Mappers: @MadLibHatter @bluearrowMaps @SageOfTime1 @Thorongil16 @DemHackMaps @JMilesColeman @RJ_maps @cinyc9 @redwoodcntymaps @NinetyDegreeZ @HugeGuilfordCo @tencor_7144 @josh_metcalf @nnjpolitics @Leonz0_o @ModRightMaps
@DJBranham @PAMapper @mahoningschmuck @NickyScatz @ZitoSalena @PA_Supremacist @AJD20201 @Free_CentralPA
1
4
44
6,430
Center-Right Mapping retweeted
May 30
Hadn’t done a PA map in a while, so I give you the 1922 PA US House elections!!
The ‘22 elections saw Dems net 5 seats in PA as they gained >70 nationwide in Warren Harding’s midterm. While Rs maintained their hold on Philly & Pittsburgh, Dems made progress in eastern PA overall.
Mappers: @MadLibHatter @bluearrowMaps @SageOfTime1 @Thorongil16 @DemHackMaps @JMilesColeman @RJ_maps @cinyc9 @redwoodcntymaps @NinetyDegreeZ @HugeGuilfordCo @tencor_7144 @josh_metcalf @nnjpolitics @Leonz0_o @ModRightMaps
@DJBranham @PAMapper @mahoningschmuck @NickyScatz @ZitoSalena @PA_Supremacist @AJD20201 @Free_CentralPA
3
7
38
9,551
Center-Right Mapping retweeted

May 26
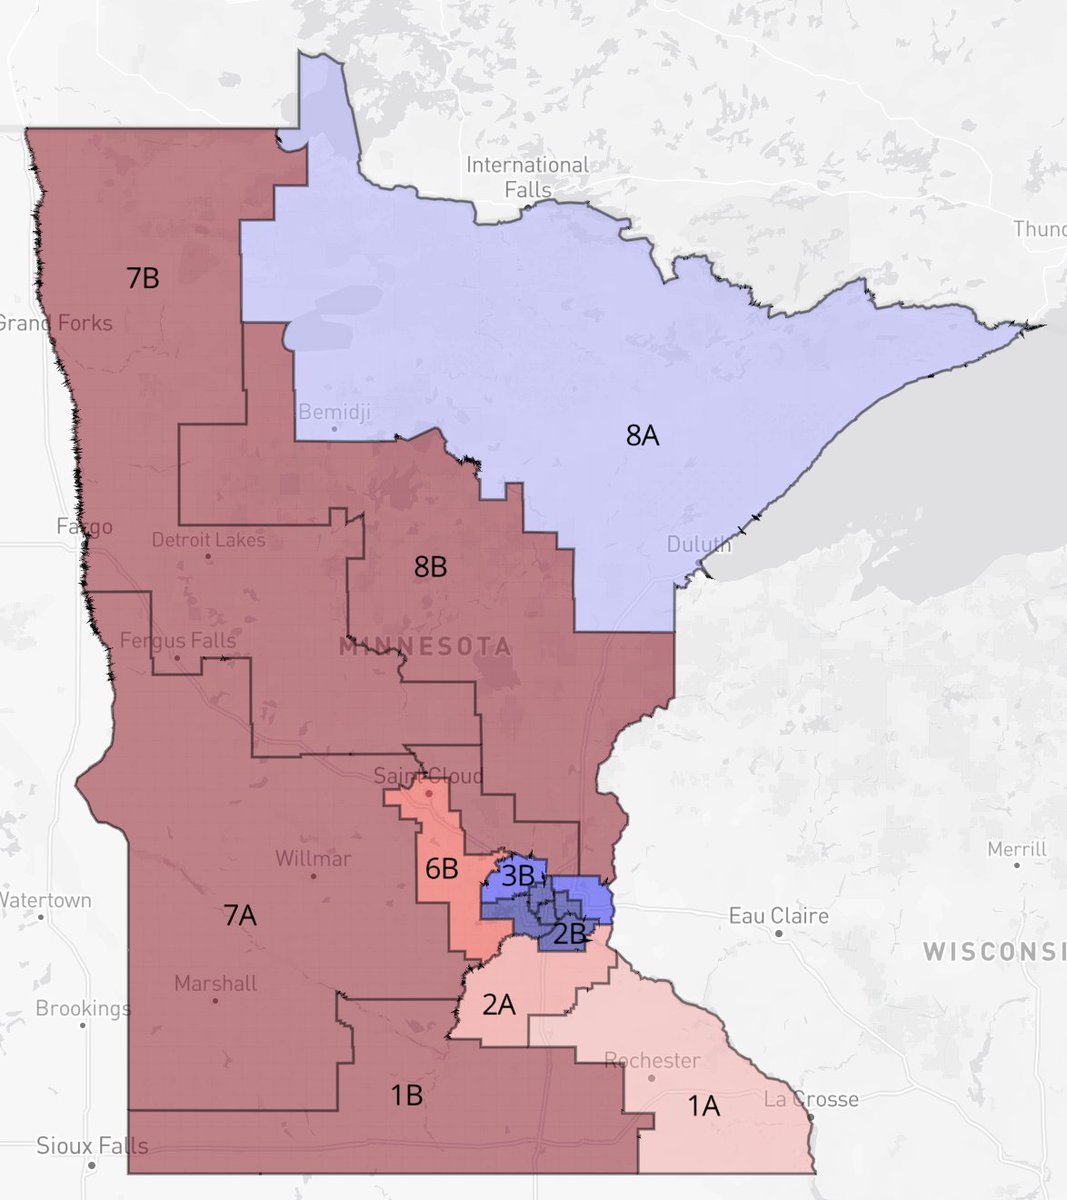
This was the biggest political fallout in Minnesota history by far


9
11
401
43,176
final state
43%
Tennessee
57%
Maine
14 votes • Final results
1
1
10
598
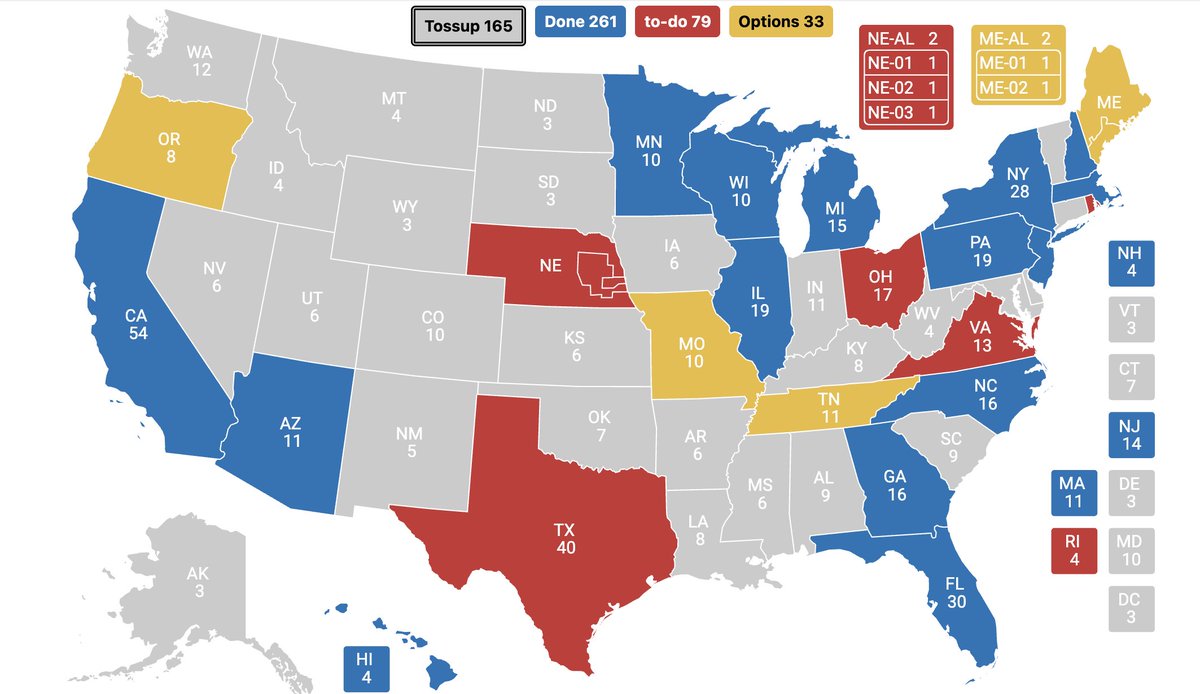
I'm going to do six more states for the Biden staying in scenario.
I have 5 decided: TX, NE, OH, VA, and RI. One more is in a poll in the thread.
Which one should I do first?
30%
Texas
10%
Ohio
37%
Virginia
23%
Rhode Island
30 votes • Final results
2
5
860
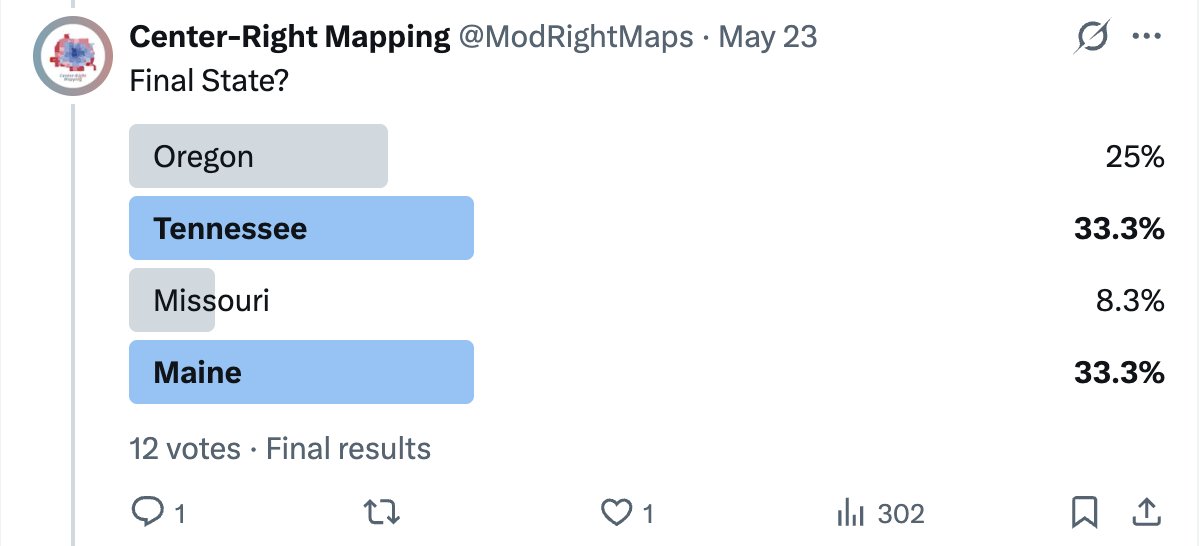
Final State?
25%
Oregon
33%
Tennessee
8%
Missouri
33%
Maine
12 votes • Final results
1
2
487
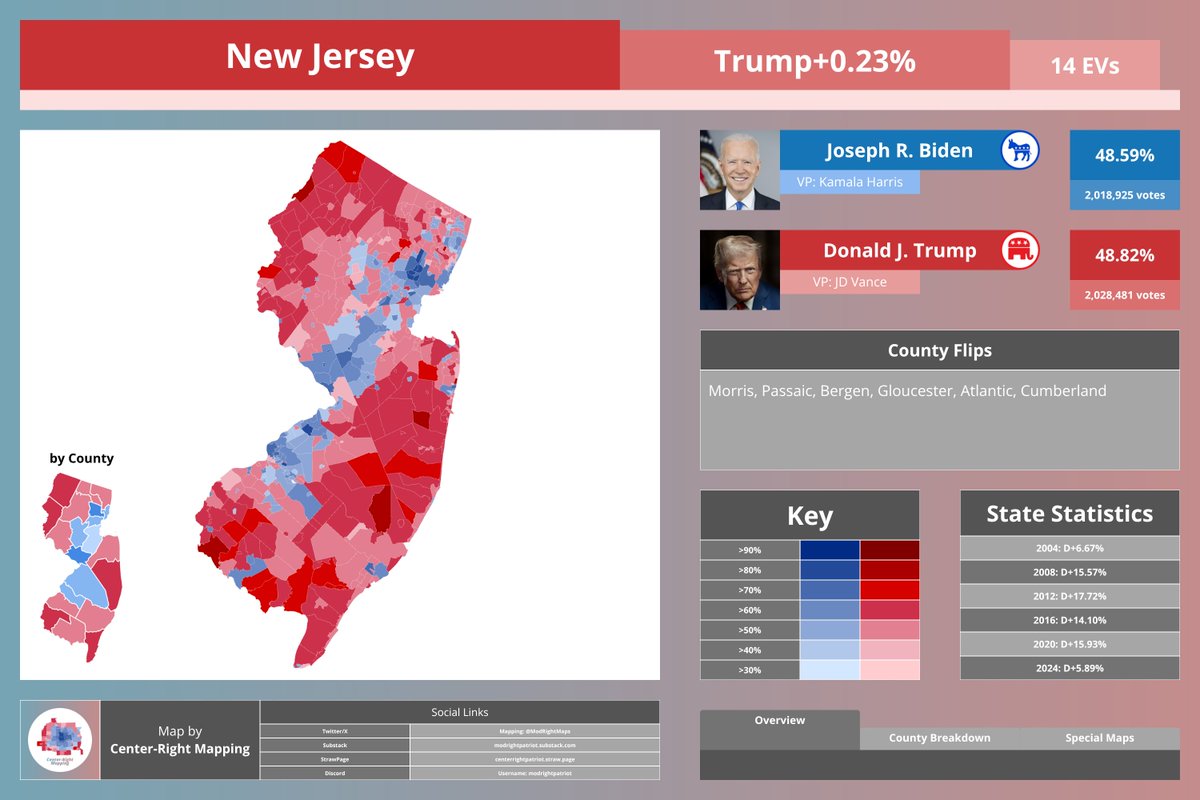
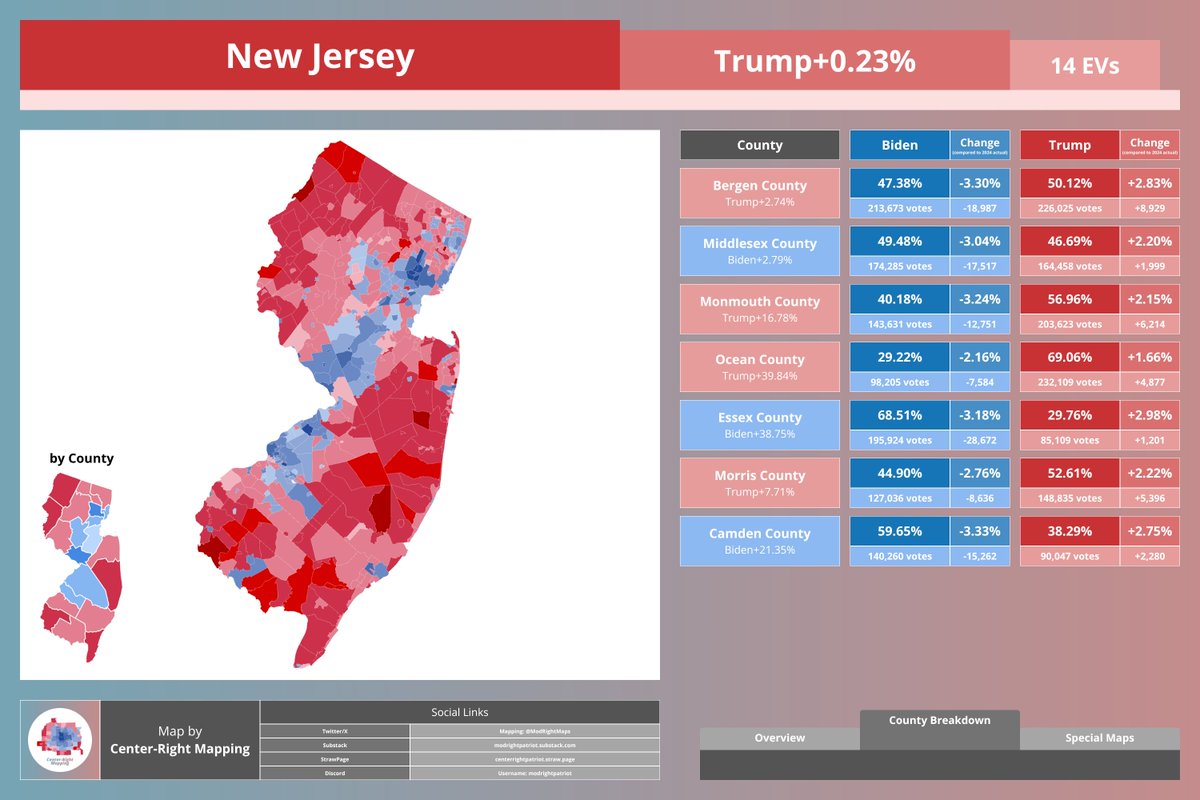
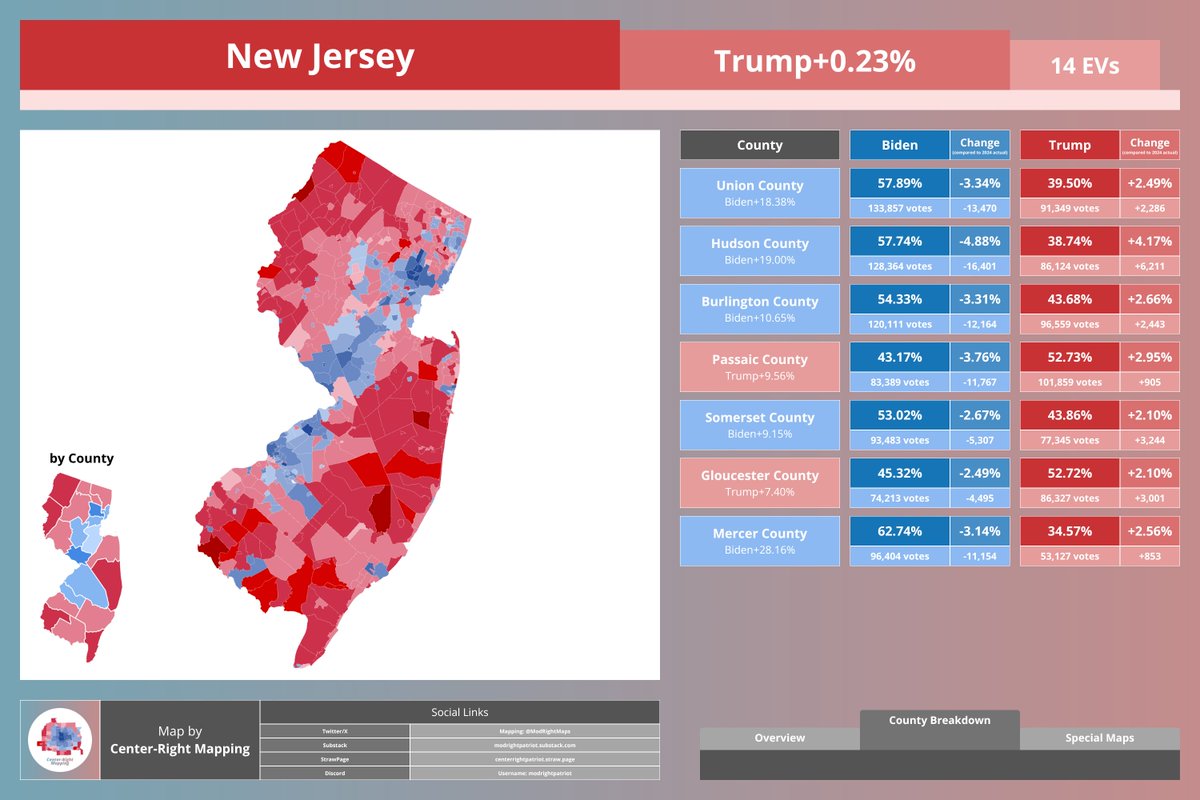
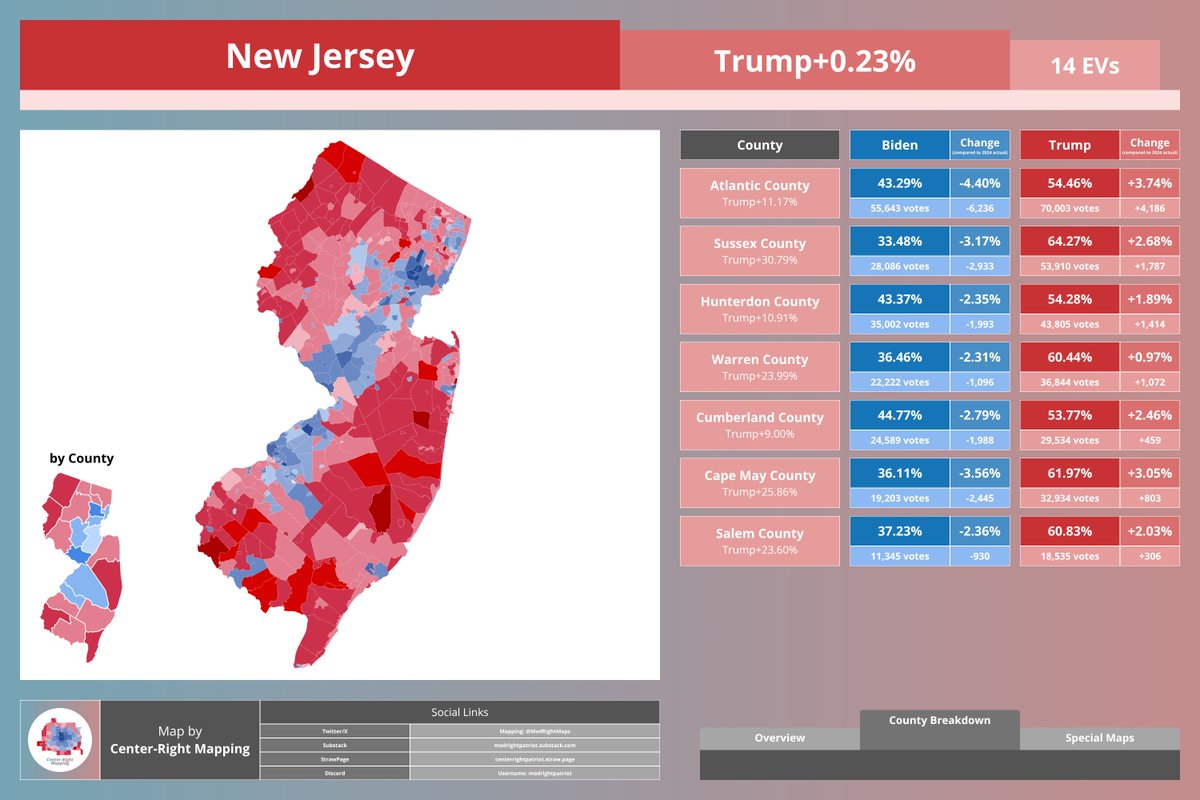
What if Biden Stayed in the Race? New Jersey
🔴 Donald Trump: 2,028,481 votes (48.82%)
(Increase 60,266 votes, 2.76%)
🔵 Joe Biden: 2,018,925 votes (48.69%)
(Decrease -201,788, -3.38%)
(I think this is 50/50 tbh)
10
18
218
14,690
I decided to give the win to Trump as it makes the scenario more interesting, but there's a high probability Biden holds New Jersey too.
1
15
1,311
Center-Right Mapping retweeted
May 23
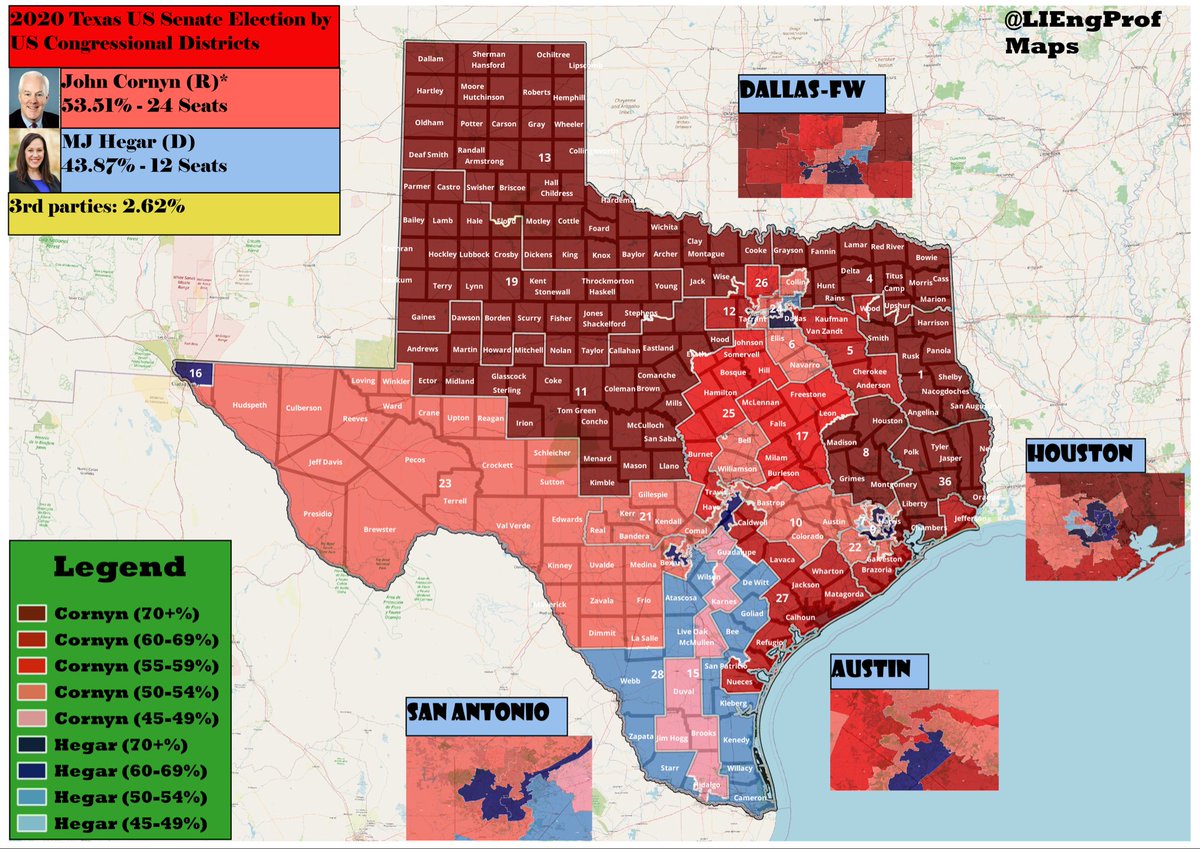
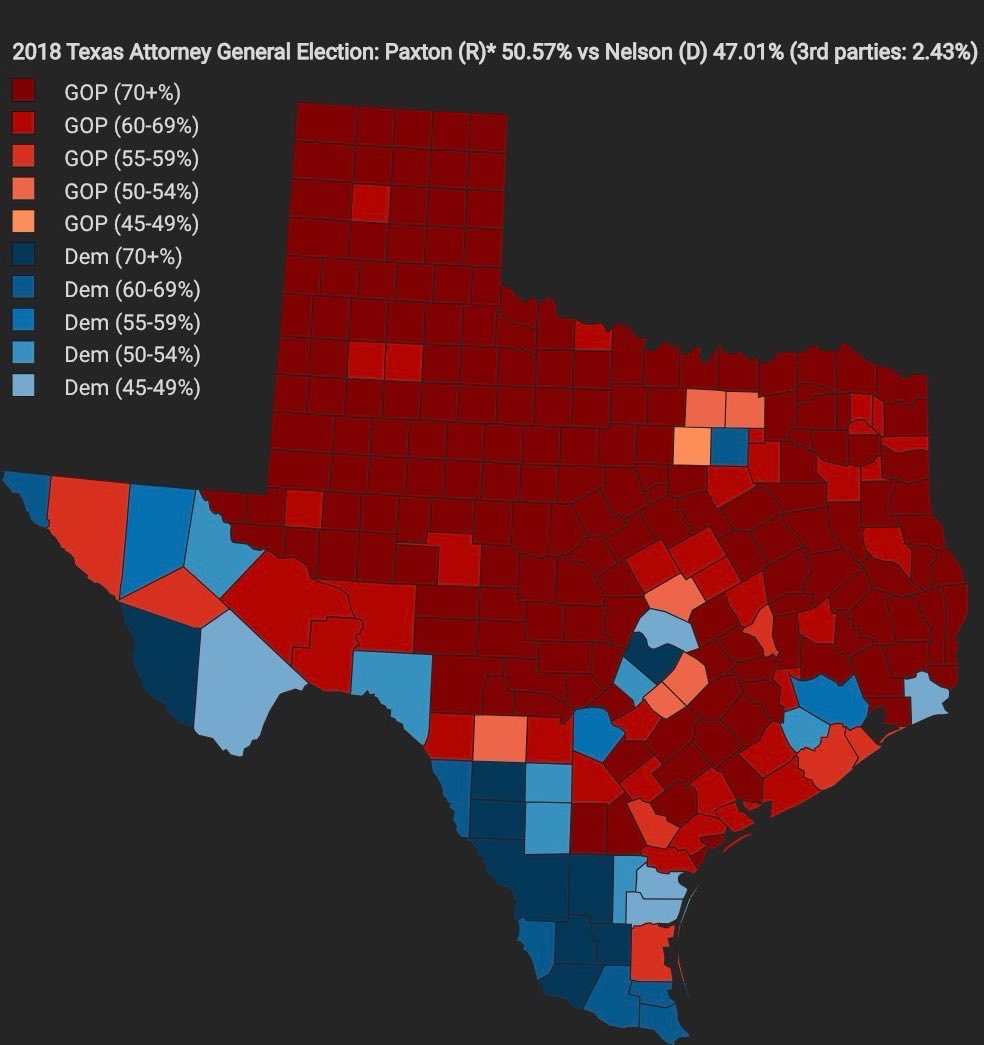
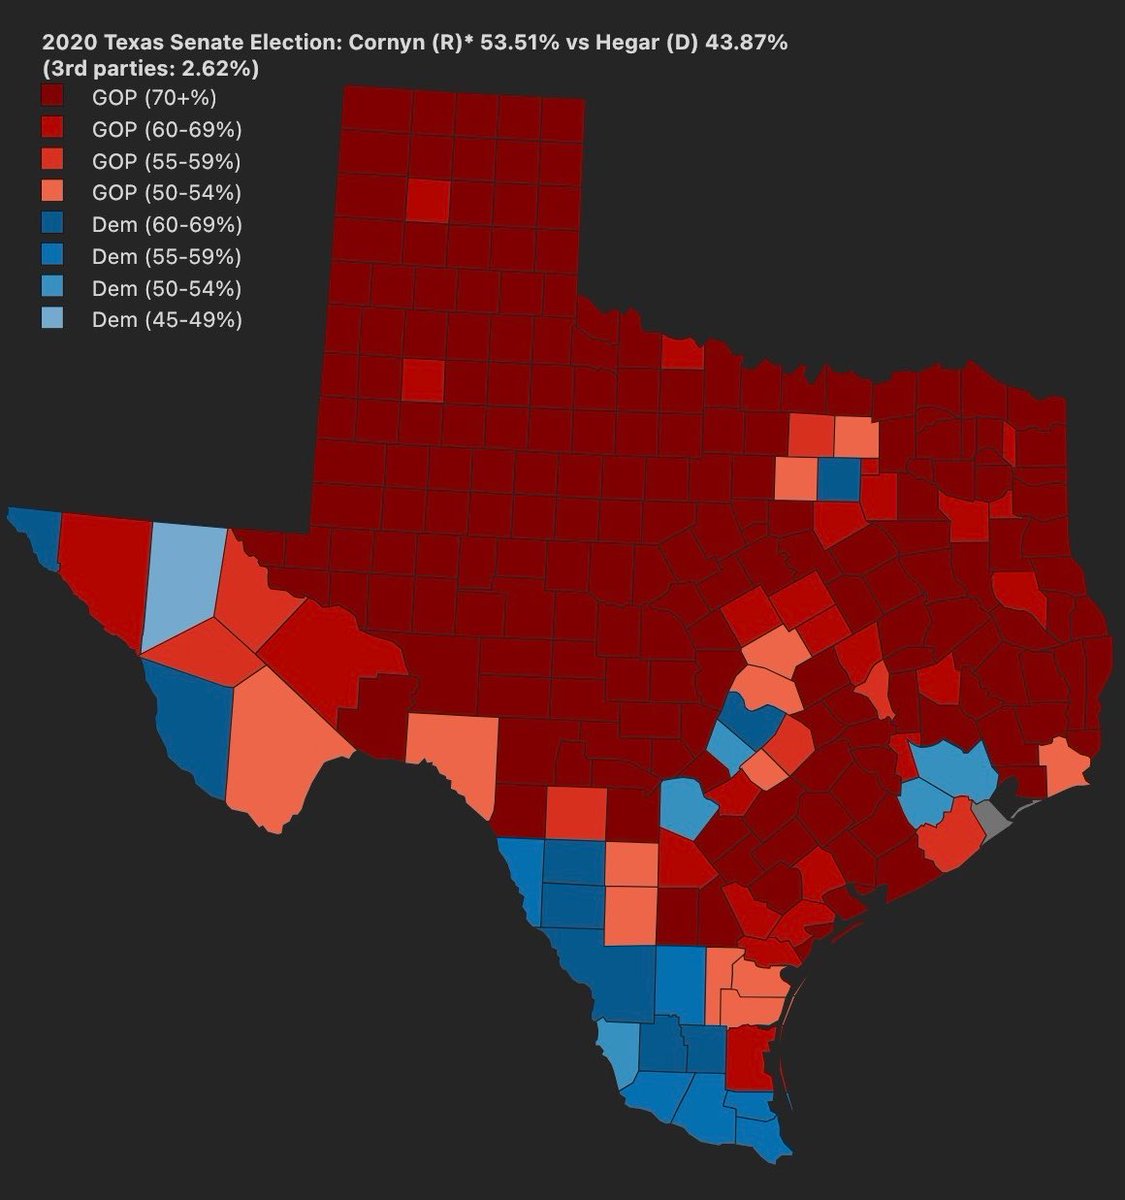
In his ‘20 reelection, John Cornyn won 24/36 House seats with 53%. Ken Paxton won 21 seats with 50.5% in his ‘18 AG reelection.
The map also shows Dem deterioration in South TX and cracks in the GOP gerrymander in the suburbs. Of course, things changed in ‘22-‘24…
Mappers: @MadLibHatter @bluearrowMaps @SageOfTime1 @Thorongil16 @DemHackMaps @JMilesColeman @RJ_maps @cinyc9 @redwoodcntymaps @NinetyDegreeZ @HugeGuilfordCo @tencor_7144 @josh_metcalf @nnjpolitics @Leonz0_o @Midwest_Mapping
@AvgTXPriv @TXFirst45 @RealTXPolitics @Red_Texas_22
May 19
Well, it seems TX AG Ken Paxton has earned the coveted Trump endorsement, so let’s revisit Paxton’s & John Cornyn’s weakest performances to gauge where they might land.
Cornyn’s weakest came in ‘20, winning by 10% while Trump won by 5.5%. Paxton’s was in ‘18, winning by 3.5% while Cruz won reelection by 2.5%. We can conclude that Cornyn does outperform the top of the ticket more than Paxton, but we should also consider environment, opponents and that Paxton has built up more baggage since then.
Should be an interesting runoff…
3
8
58
13,104