
Cardio/CC friendly nephrologist. In love with POCUS, cardiorenal & critical care medicine. Tweets reflect my own personal opinion
Joined February 2012
- Tweets 3,129
- Following 505
- Followers 1,803
- Likes 5,921
713 Photos and videos


Pinned Tweet

21 Jan 2024
#_POCUS
Few tips for learning POCUS for beginners like myself
1- it is very steep learning curve & long journey.
2- pick up one source & keep watching it over & over again. Youtube has lot of them
3- POCUS has 3 parts: image acquisition, interpretation & clinical integration
7
44
146
38,970
Ahmed T Abdellah retweeted
Blood Doesn't Flow Because of Pressure
On misreading equations as mechanisms
We are taught that blood flows because of a pressure gradient.
It is one of those statements that is true enough to be useful and simple enough to be dangerous. It gives us a clean mental model: the heart generates pressure, pressure is higher in the arteries than the veins, and blood flows down the gradient.
The equation seems to confirm it:
Q = ΔP / R
Flow equals pressure difference divided by resistance. Pressure difference sits on the right-hand side. Flow is the output. The story almost writes itself.
But the equation does not say what we often make it say.
It describes a relationship between variables in a solved system state. It tells us that, for a given flow through a given resistance, there must be a corresponding pressure difference. It does not tell us that the pressure difference is the independent cause of the flow.
That causal interpretation has to come from somewhere else. It has to come from the physics.
And the physics is more interesting than the shorthand...
Read on for free on my Substack. substack.com/@icmteaching/no…
5
25
1,921
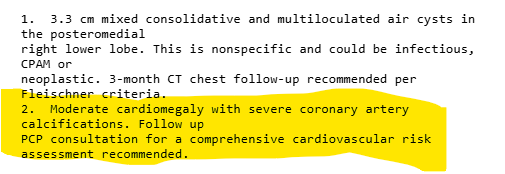
This kind of recommendations just creating more confusion and lead to more unnecessary testing.
cvs risk assessment in a 90 with dementia !!
I think that part is AI recs and should not be included without knowing the pt history
2
28
Ahmed T Abdellah retweeted

Jun 12
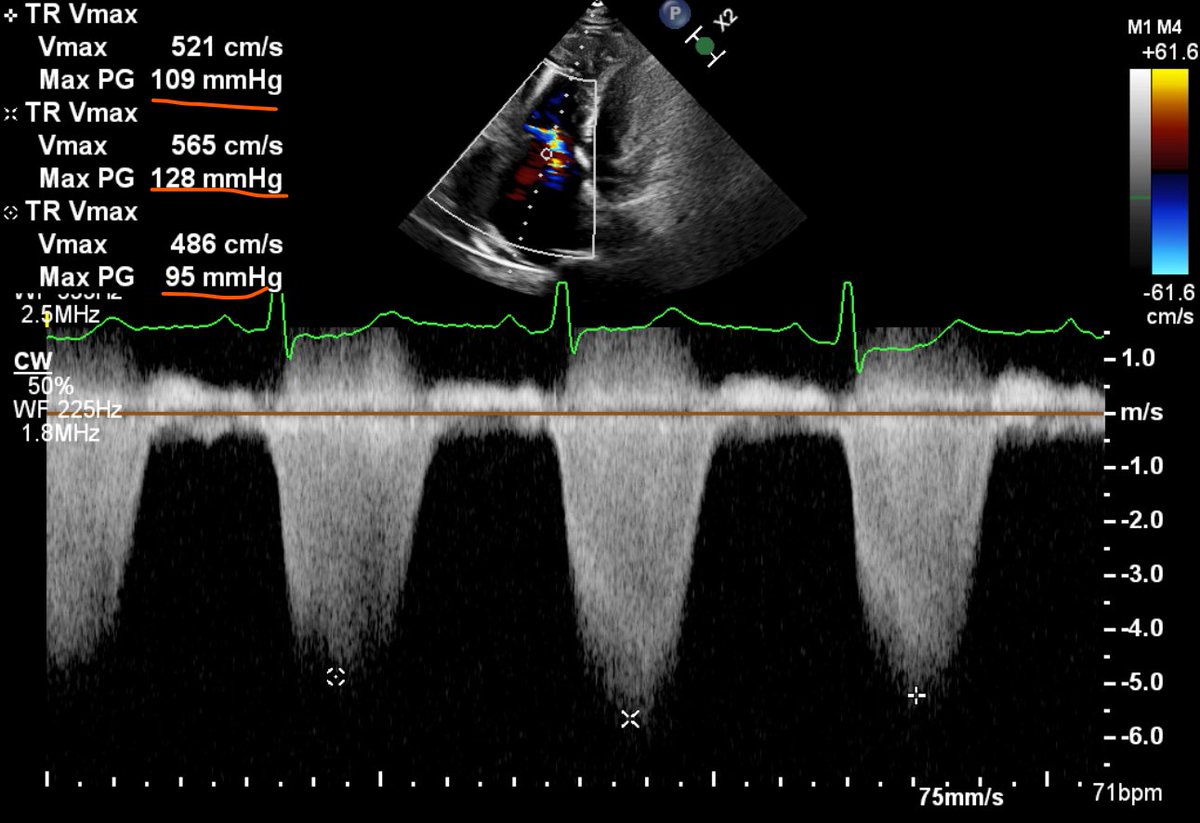
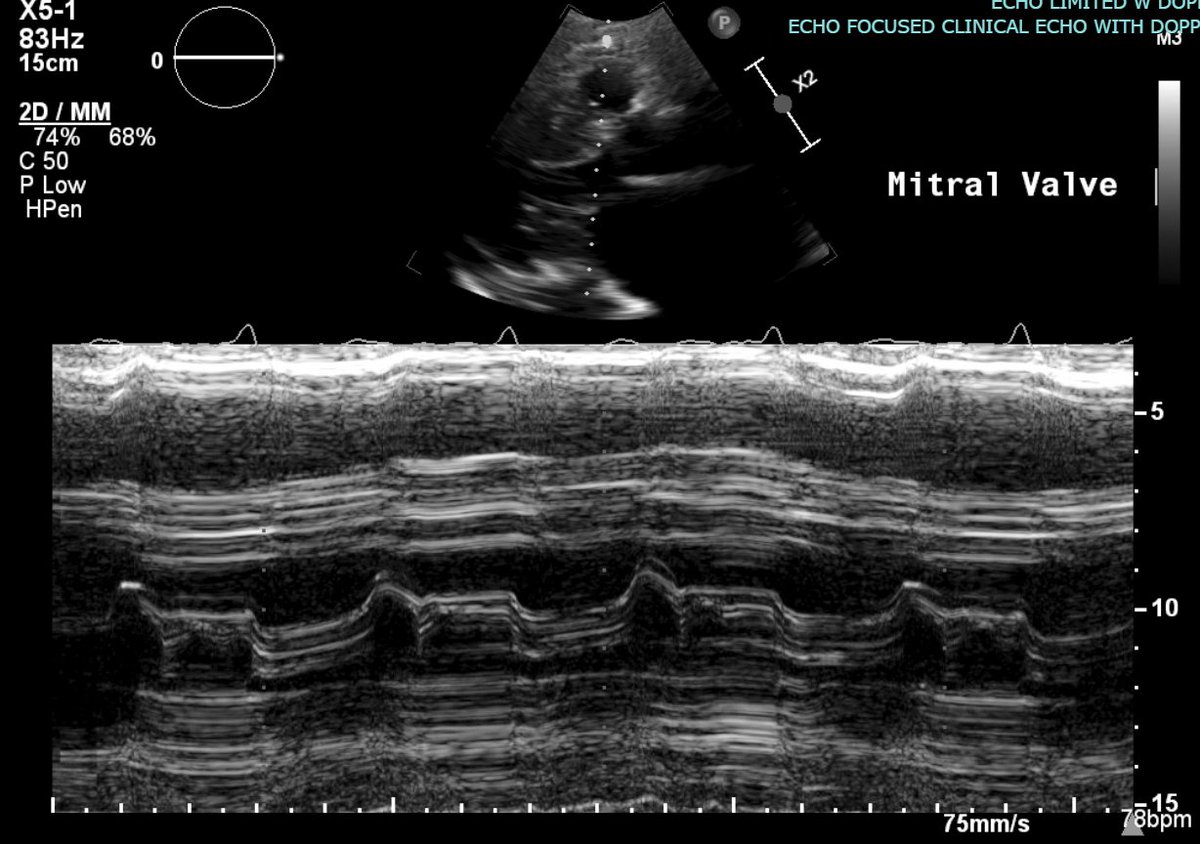
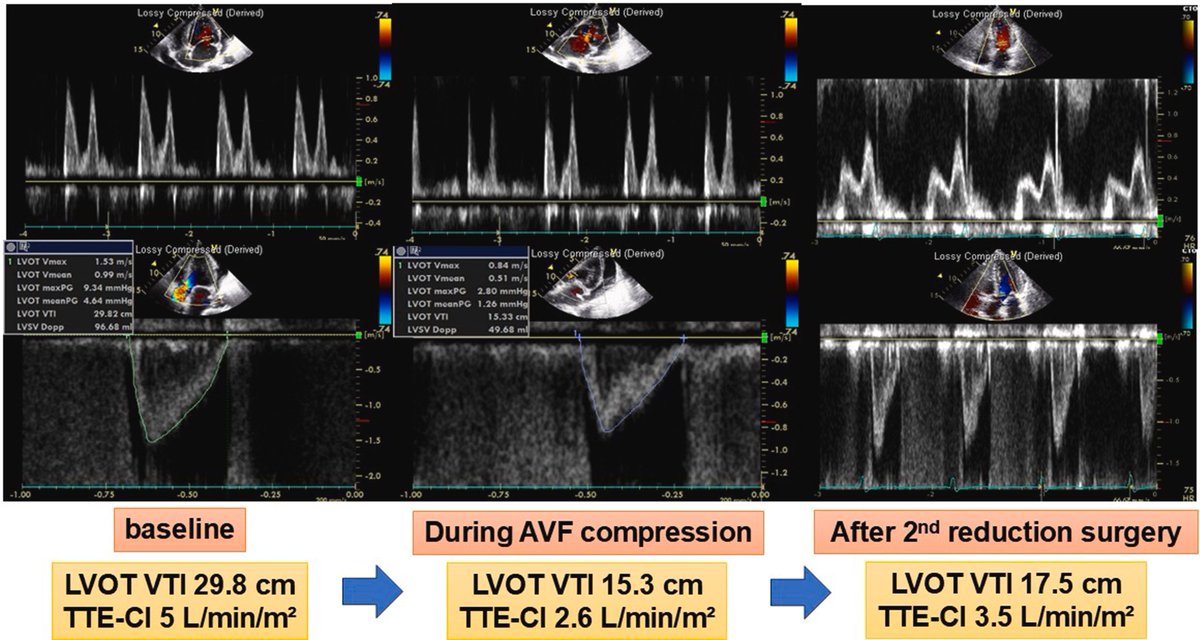
High-output heart failure associated with arteriovenous fistula remains an underrecognized, albeit well-described, clinical entity. This is a nice case with illustrative images - doi: 10.1016/j.jaccas.2026.107193. PMID: 41770183
#POCUS #Nephpearls
2
27
103
5,137
Ahmed T Abdellah retweeted

May 20
A lot of haemodynamic confusion comes from one basic error: treating descriptions of the system as if they were causes.
Pressure gradients, preload, RAP, afterload, Starling... all are useful, but often misread.
This review tries to put them back together into a coherent framework.
doi.org/10.1111/anae.70238
7
51
157
21,942
Ahmed T Abdellah retweeted
May 16
5
28
73
15,205
May 17
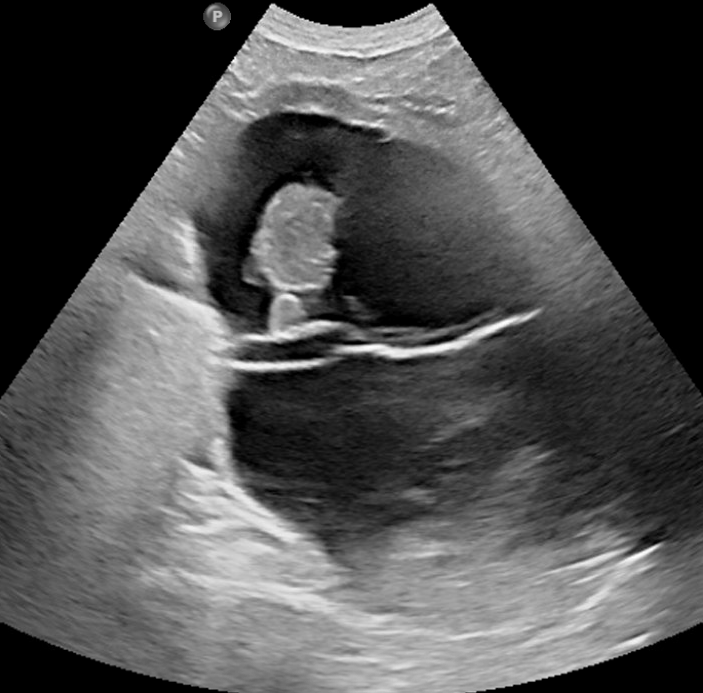
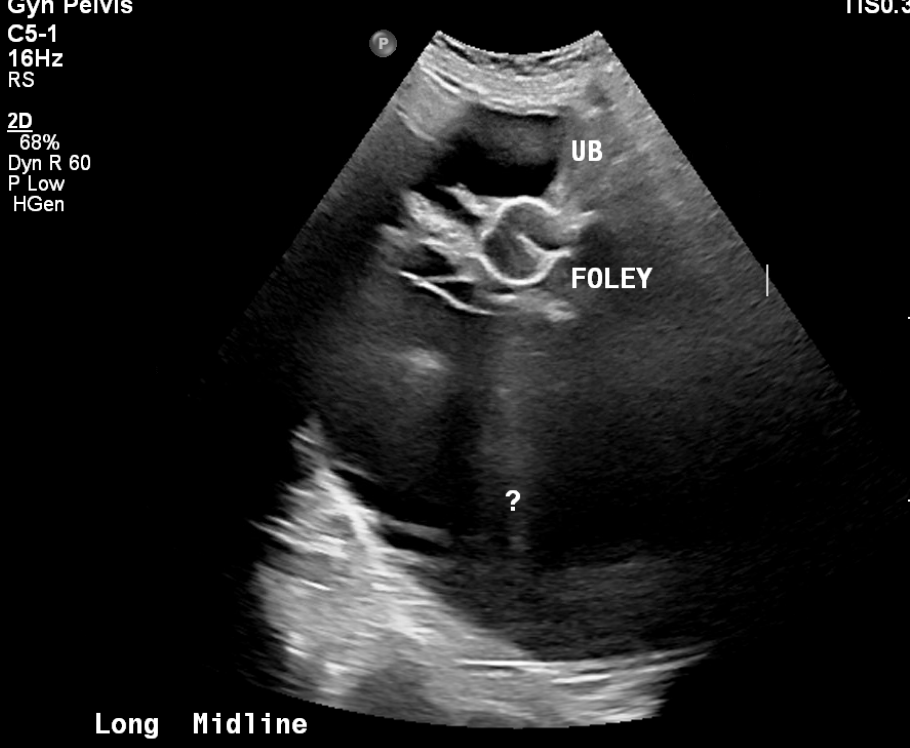
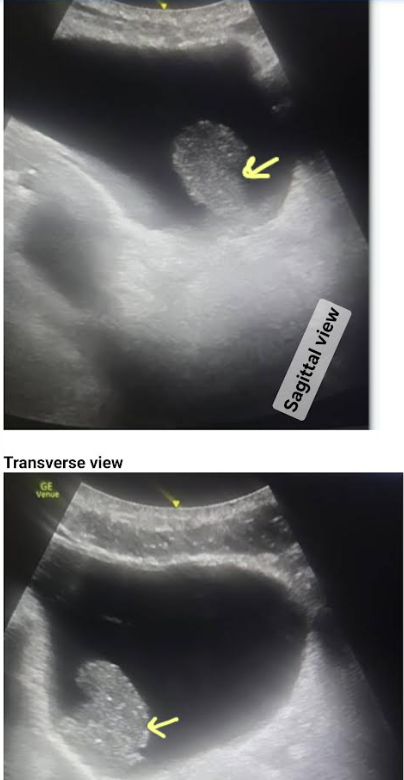
RN says bladder scan reads 800cc of UOP.
Foley's checked in the right position and I flushed, working well with good UOP. She is on 60 mg IV lasix?
Me :
Either your machine is hallucinating (95%) or
is she filling her UB > what the F can drain (5%) ?
Formal USB done see below
1
1
3
1,006
May 17
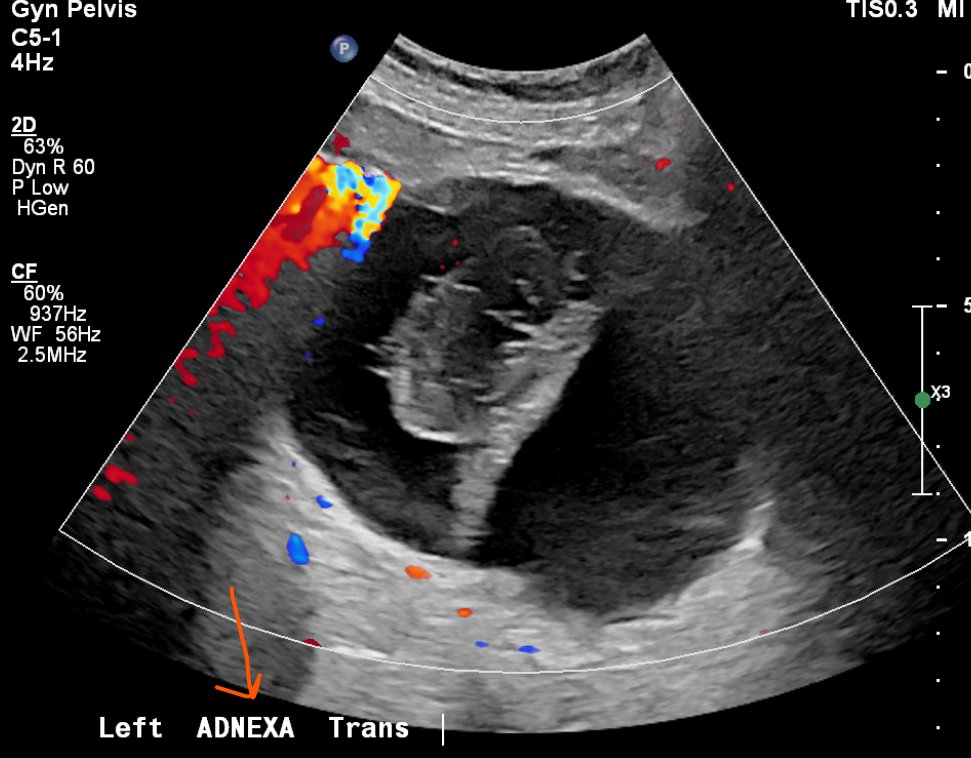
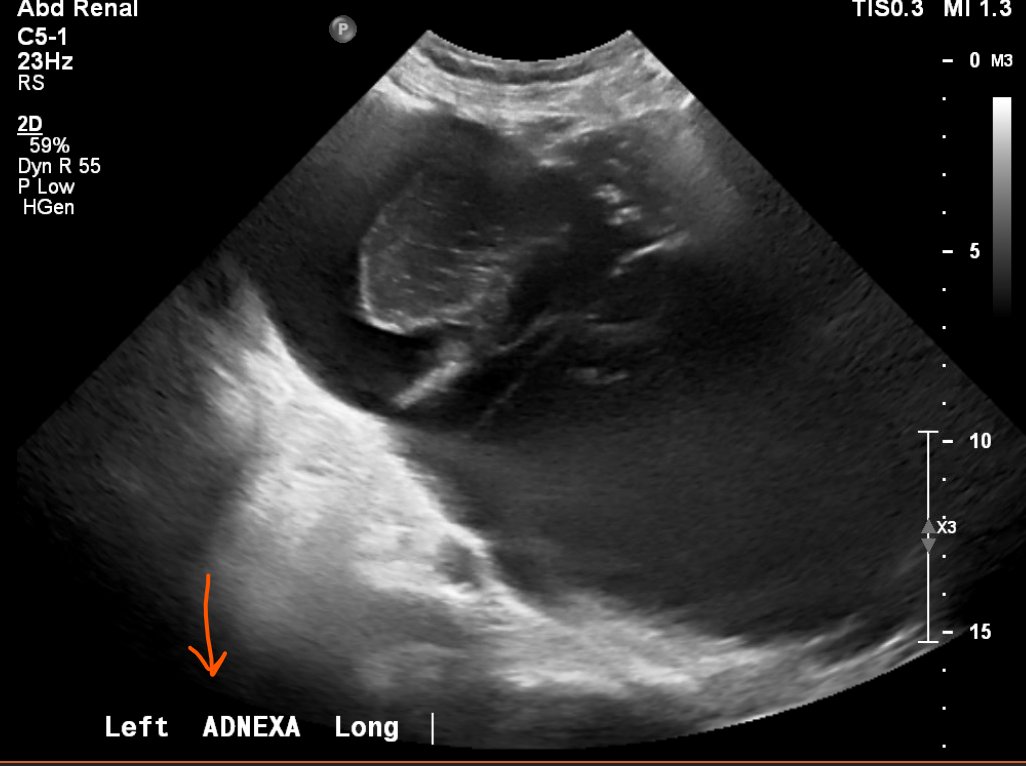
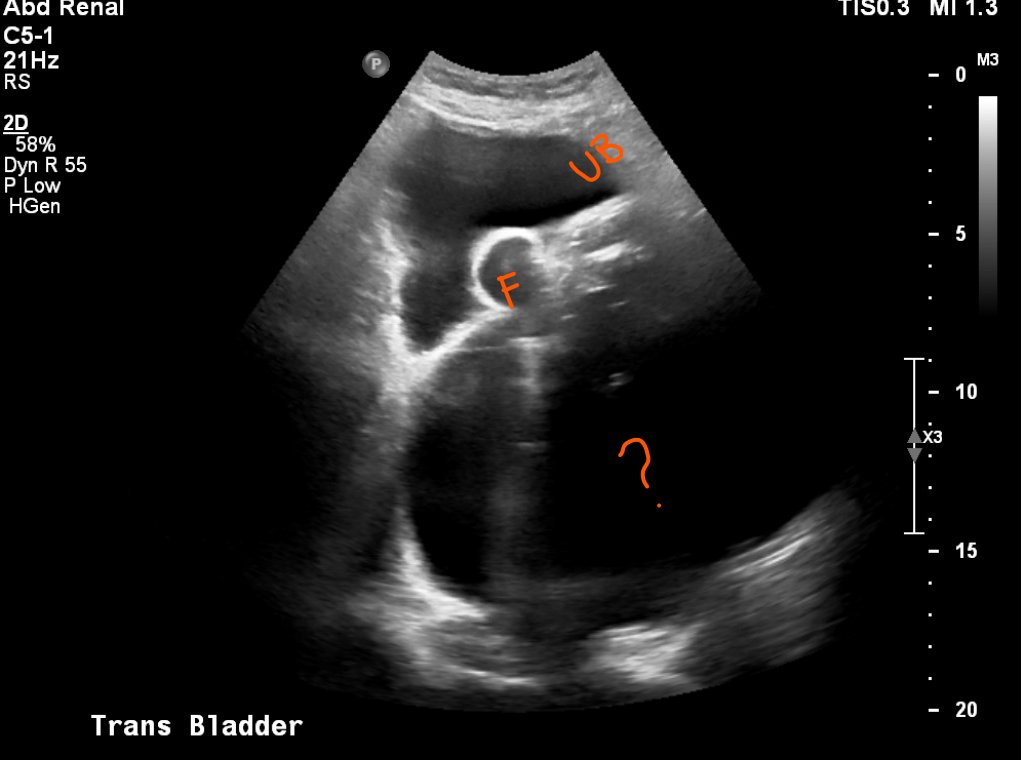
Report: There is avascular large irregular complex cystic structure in the left adnexa measuring up to 20 cm with internal nodularity with high risk of malignancy!
Think of these large pelvic cystic lesions when B.S machines don't make sense
NB: Pt has no evidence of ascites
2
1
2
1,738
Ahmed T Abdellah retweeted

May 12
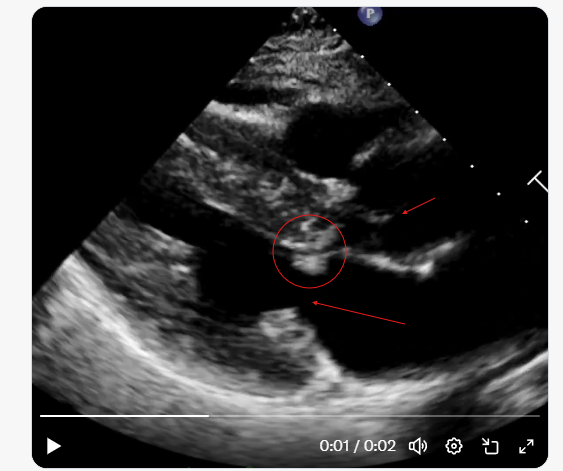
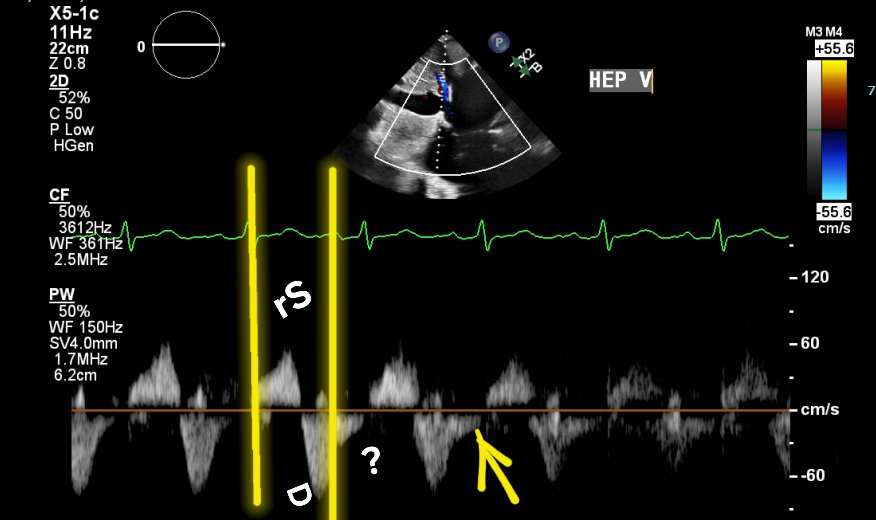
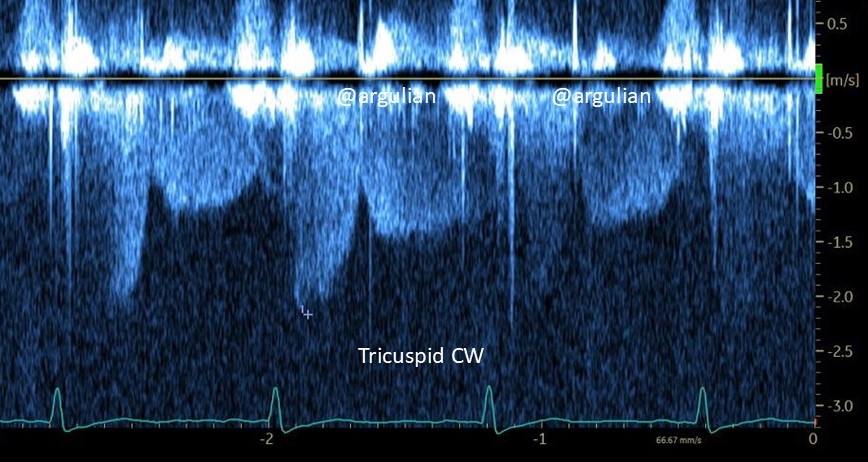
An intriguing spectral Doppler pattern. A patient with normal biventricular size and function. CW Doppler interrogation across the tricuspid valve in 4 chamber view is shown, consistently yields systolic diastolic flow. Whats are possible explanation?
10
12
64
10,005
Apr 23
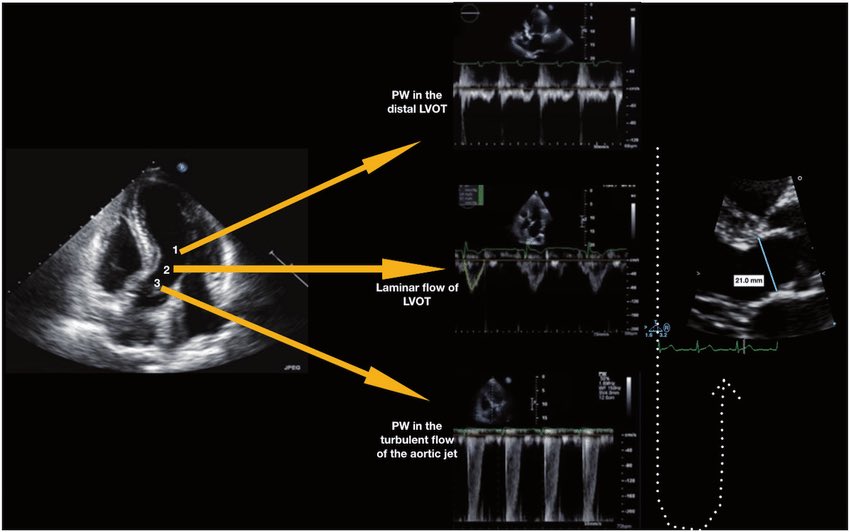
Very interesting history of LVOT VTI

🫀 Did you know where the recommendation to place the pulsed wave Doppler sample volume 0.5–1 cm from the aortic valve to measure LVOT VTI comes from?
The answer is more interesting than it seems. It doesn’t come from a single study or an experiment designed for that purpose. It comes from a historical chain spanning nearly 40 years:
🔬 1982–1984 — The physical foundation
Pasipoularides and Murgo demonstrated using invasive catheters and mathematical models that in aortic stenosis there is a real zone of flow acceleration in the LVOT, just proximal to the valve, without any second anatomic obstruction. Pure hemodynamics — no Doppler yet.
👉 Bird et al. Circulation 1982 → doi.org/10.1161/01.CIR.66.4.…
👉 Pasipoularides et al. Am J Physiol 1984 → doi.org/10.1152/ajpheart.198…
📐 1984 — The apical 5-chamber view
Lewis, Kuo and Quinones were the first to validate cardiac output measurement using pulsed wave Doppler from the cardiac apex. They described placing the sample volume “immediately proximal to the aortic valve leaflets” — but without specifying any distance in centimeters.
👉 Lewis et al. Circulation 1984 → doi.org/10.1161/01.CIR.70.3.…
📏 1985 — The first numerical distance
Skjaerpe, Hegrenaes and Hatle (the Norwegian group) were the first to quantify this in Doppler: they empirically observed that flow acceleration began 0.5 to 1.5 cm proximal to the valve, and placed the sample volume just proximal to that zone. They directly cited Pasipoularides as supporting evidence. This was the first time a numerical distance appeared in the technique.
👉 Skjaerpe et al. Circulation 1985 → doi.org/10.1161/01.CIR.72.4.…
📊 1986–1988 — Practical consolidation
Otto et al. used ~1.0 cm. Oh, Tajik and the Mayo Clinic group explicitly established the range of 0.5 to 1.0 cm in 100 patients, justifying it as necessary to avoid the subvalvular acceleration zone. This is the figure we all recognize today.
👉 Otto et al. JACC 1986 → doi.org/10.1016/S0735-1097(8…
👉 Zoghbi et al. Circulation 1986 → doi.org/10.1161/01.CIR.73.3.…
👉 Oh et al. JACC 1988 → doi.org/10.1016/0735-1097(88…
📋 2002 — It becomes “official”
Quinones, Otto, Zoghbi and colleagues codified it in the ASE guidelines as “~5 mm proximal to the aortic valve”… but without citing any specific study to support it. It had already become expert consensus.
👉 Quiñones et al. JASE 2002 → doi.org/10.1067/mje.2002.120…
⚔️ 2017 — The debate reopens
Baumgartner et al. (EACVI/ASE) maintained the 0.5–1 cm recommendation. However, Hahn and Pibarot responded with a critical letter pointing out that the original articles from the 1980s measured at the aortic annulus, not 0.5–1 cm below it, and that moving away from the annulus introduces errors due to the elliptical and irregular shape of the subannular LVOT.
👉 Baumgartner et al. Eur Heart J Cardiovasc Imaging 2017 → doi.org/10.1093/ehjci/jew335
👉 Hahn & Pibarot. JASE 2017 → doi.org/10.1016/j.echo.2017.…
💡 Bottom line:
The 0.5–1 cm figure was never experimentally validated as the optimal distance. It emerged from empirical observations in the 1980s aimed at avoiding a flow acceleration zone that had been demonstrated with invasive catheters. It was adopted through accumulated clinical practice and later elevated to a formal recommendation by consensus. The debate over whether to measure at the annulus or 0.5–1 cm below it remains open to this day.
One of those recommendations we all follow but few know where it actually came from 🙂
Dr Benigno Valderrábano Salas
@MDBeni
@JaeKOh2 @ottoecho @WilliamZoghbi @ASE360 @EACVIPresident @NephroP @iamritu @PPibarot @hahn_rt @MAecocardio @SISIACOficial @SONECOM_AC @VazyurVasquez @Cardiotweets83 @HEARTof_echo @echobasics
5
31
4,625
Apr 13
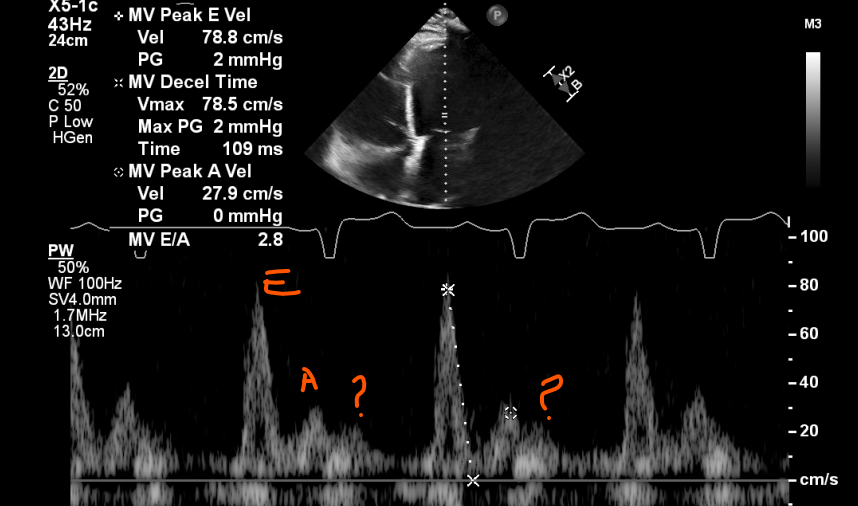
Dilated NICM with EF 10-15%, LVOT VTI 8 cm, SV 34 ml (LVOT_Diam 2.3 cm). volumetric SV 44 ml
Can you see a-wave extending to systole or that just L-wave then A-wave ?
7
8
50
6,061
Ahmed T Abdellah retweeted

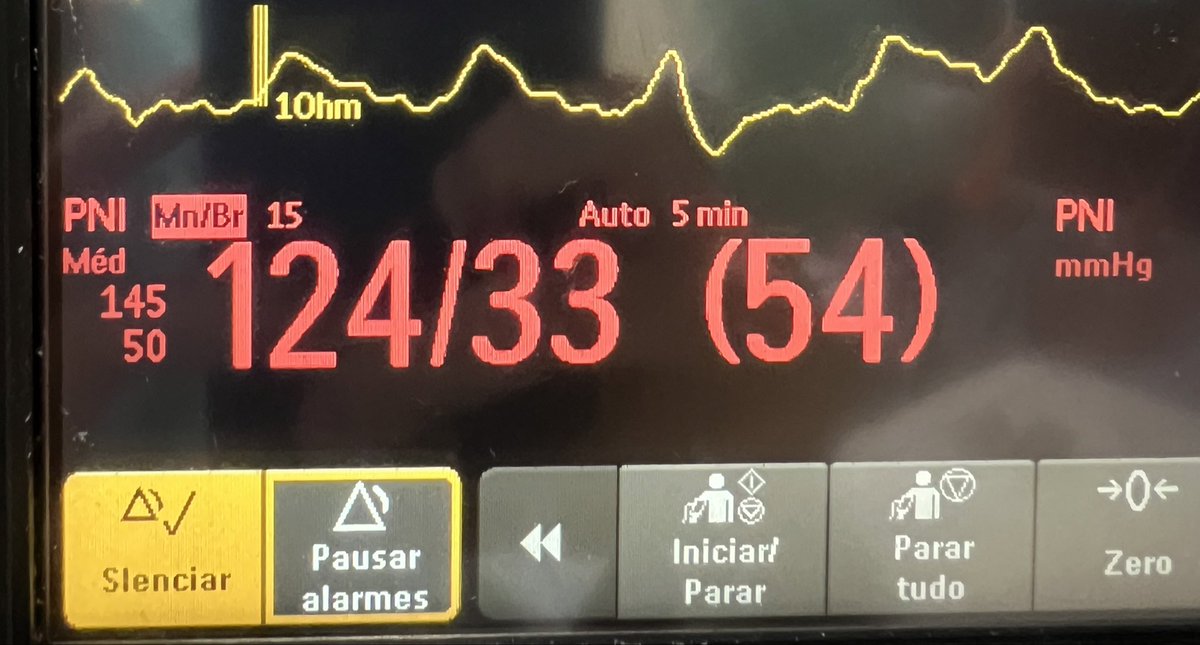
PAD reduzida no choque hemodinâmico é sempre sinônimo de vasoplegia? Nem sempre!
Entenda situações em que a PAD perde acurácia nessa associação.
Segue o fio 🧶
3
21
125
16,095
Ahmed T Abdellah retweeted

#mdpijcm #ResearchPaper Sharing
Title: The VTI-VeXUS Index in Septic Shock: An Exploratory Proof-of-Concept Observational Study of a Novel Hemodynamic Parameter
Citations: 4
📌link: mdpi.com/2077-0383/14/16/577…
✍by Dr. Ross Prager et al @ThinkingCC
@JCM_MDPI
1
4
19
1,107
Confirmation of Foley catheter placement is essential in patients with gross hematuria, especially prior CBI. While initial urine return may suggest correct placement, POCUS in this case demonstrated a persistently distended bladder with a large clot no Foley's in the bladder.
3
6
20
3,114