📣Update: We’re moving! For continued access to our latest climate news, important announcements, and resources, please follow @NASAEarth. This account will be archived over the coming weeks.
Did you know there are glaciers in Africa?
These are the Rwenzori Mountains, reaching 16,000 feet above sea level. Along with Kilimanjaro and Mount Kenya, they contain the bulk of East Africa’s tropical glaciers. They’re also in strong decline.
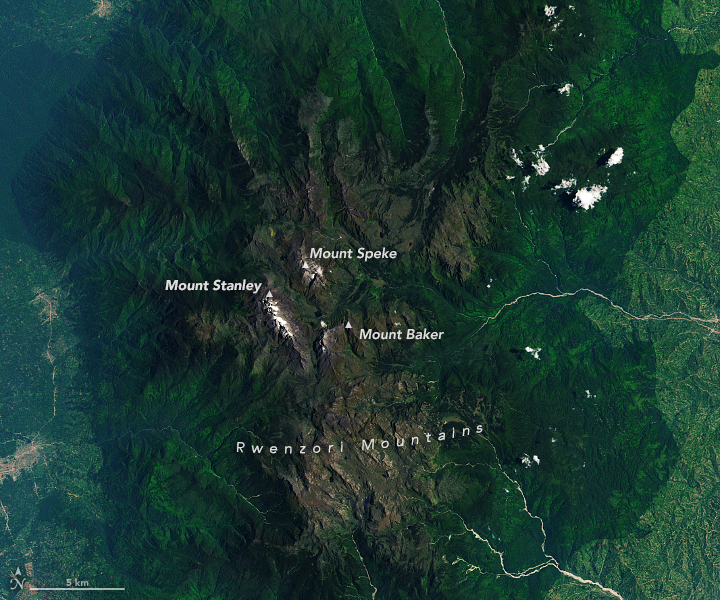
ALT Landsat 9 image of the Rwenzori Mountains. Dark-green vegetation lies on the mountain flanks and transitions to more barren, brown land at higher elevations. Small patches of white snow and ice are visible on the tallest peaks. A network of thin brown rivers is visible to the left and right of the mountains.
These glaciers are an important water resource for nearby communities, plants and animals. However, some have decreased in area, others have disappeared altogether, and some have become stagnant ice fields.
Full story: go.nasa.gov/3Sgiugj
ALT A detailed view of the Rwenzori Mountains, centered in the scene, shows the range's three highest mountains: Mount Stanley, Mount Speke, and Mount Baker. The peaks are topped with white, much of which is snow.
Satellites 🤝 Farmers
NASA’s OpenET system turns satellite data into valuable water insights, helping farmers across the U.S. track how much water is lost to air through evapotranspiration and how to better manage their resources.
More: go.nasa.gov/4j4wjt2
At NASA, we study our home planet like no one else. From land, air and space, NASA satellites have been observing Earth for more than 60 years! #EarthDay
In March 2025, Arctic sea ice hit its lowest annual peak on record. At the other end of the globe, Antarctic sea ice cover was the second-lowest on record that month.
That means that, overall, Earth’s sea ice reached a new record low in 2025. 🌊🧊 go.nasa.gov/4j0lgCe
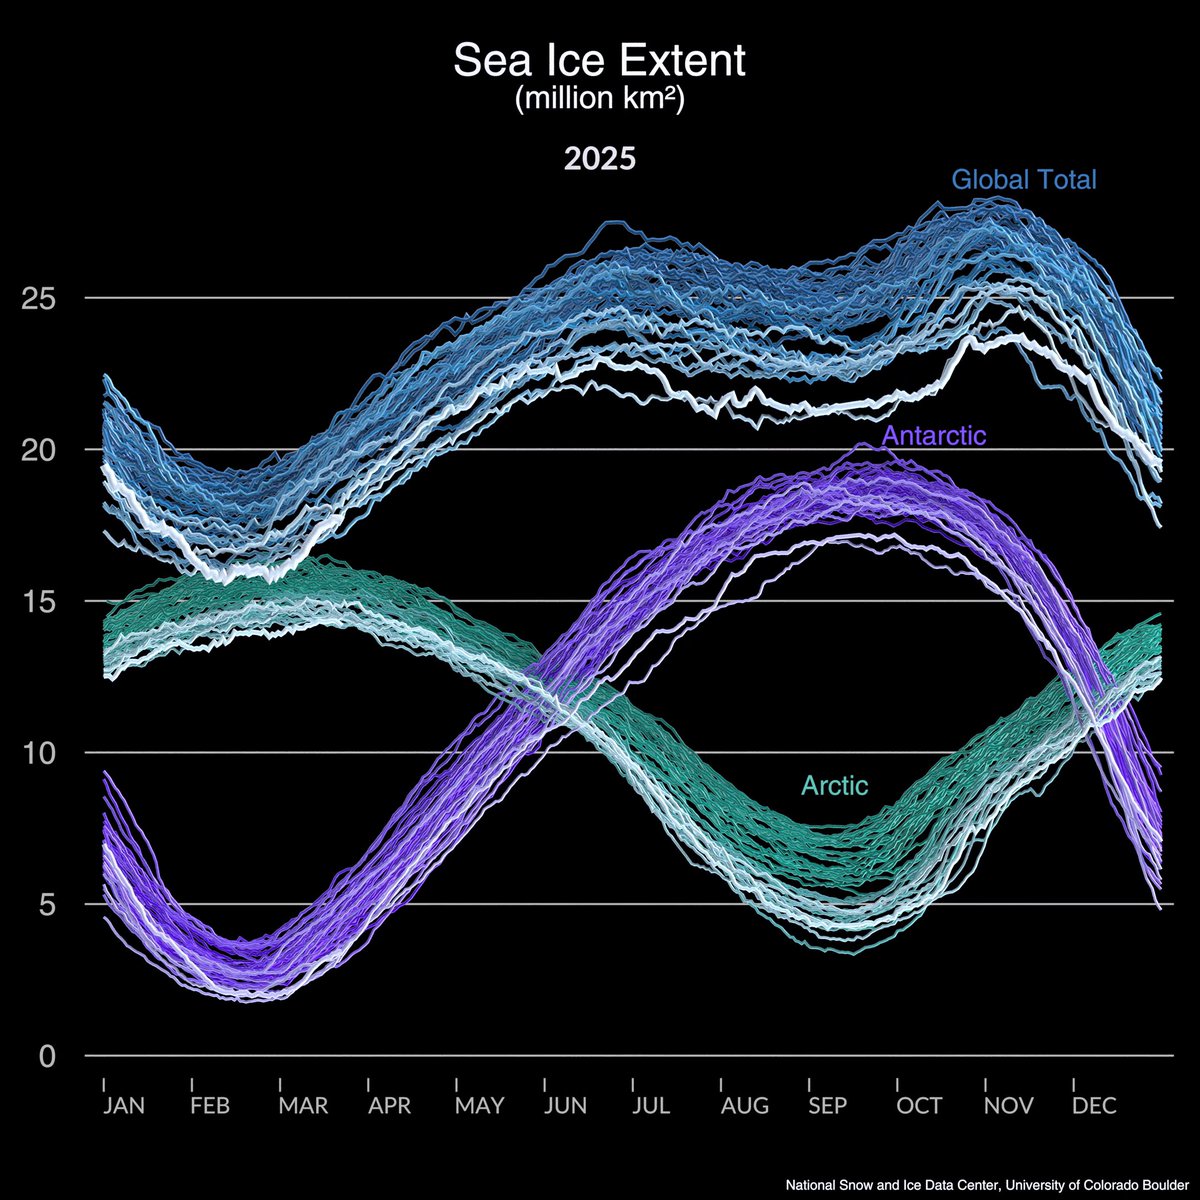
ALT Graph showing sea ice extent in millions of kilometers in 2025. Purple lines show Antarctic sea ice. It dips and hits an annual low around February and March, then rises to hit a peak around September and October. A green line shows Arctic sea ice, which peaks around March and dips around September to October. At the top is a group of blue lines showing global total sea ice, which dips around March and has two peaks around June and November. Lighter color lines show more recent years, which are much lower than the older, darker years for each of the lines.
Sea ice update 🌊🧊
Global sea ice hit a record low this winter, @NASA and @NSIDC report. In the Arctic, winter sea ice was the lowest it’s ever been at its annual peak this year. The Antarctic sea ice minimum was also the second-lowest on record. More: go.nasa.gov/4j4KpuV
Like many glaciers in the Alps, the Great Aletsch Glacier is retreating and thinning. These #Landsat images show change over the past 40 years. The shortening and narrowing of a glacier’s surface area can indicate a net loss of ice mass.
go.nasa.gov/4inoZJB
ALT Alternating images of the Great Aletsch Glacier captured from space. The first image is from 1984 and the second from 2024. White, glaciated mountains span the middle of the image, surrounded on the top and bottom by green vegetation. The exceptionally large glacier across the middle of the image has thinned and shortened compared to the 1984 image. The nearby smaller glaciers have also retreated.
Sea level update 🌊
In 2024, global sea level rose faster than expected mostly due to ocean water expanding as it warms, or thermal expansion. According to a NASA-led study, 2024’s rise was 0.23 in (0.59 cm) per year, compared to the expected rate of 0.17 in (0.43 cm) per year.
From severe weather to air quality, tiny atmospheric particles can have a big impact. A #NASAScience-funded team is exploring how metasurface optical elements could enable lighter & smaller space-based instruments to characterize these particles and improve our climate models and weather predictions. science.nasa.gov/science-res…
ALT A photograph of two fully fabricated flat polarimeter samples. Metasurfaces could become the foundation for future, ultra-light instruments, including space-based polarimeters.
Credit: Capasso Group
These #Landsat images show how the size of the Mendenhall Glacier changed from 1986 to 2024, using infrared bands to differentiate ice, rocks & soil, and vegetation. The glacier has retreated about a mile, and in some places thinned by 2,000 feet. go.nasa.gov/3QGqJS9
Although Mendenhall’s retreat began centuries ago, warming temperatures have accelerated its decline. Between 2005 and 2019, the wider Juneau Icefield (Mendenhall’s source) lost 63 of 1,050 glaciers and 10% of its ice.
Satellites like Landsat help scientists track these changes over time.
Mountain snow is disappearing in the high-altitude region surrounding the Himalayas due to warmer and drier conditions.
The shift is visible in these #Landsat 9 images from January 2022 and 2025.
ALT Animated GIF of two satellite images of the Himalayan mountains, including several glaciers as well as Mount Everest, which is in the lower right corner of this image. In the first image, taken in 2022, the landscape is mountainous and mostly covered by white snow except for a few brown patches at lower elevations. In the second image, taken in 2025, the image is predominantly brown. There is only white snow on some of the tallest mountains.
Low seasonal snowpack and snow persistence affect downstream communities’ water security and affect fire activity in the region. More info: go.nasa.gov/4i3TRyf
La Niña showed up in early December 2024, but it may not stick around long.
The climate pattern tends to bring cooler, drier weather and is also associated with lower-than-average sea levels in the central and eastern Pacific Ocean. go.nasa.gov/4aSnDDA
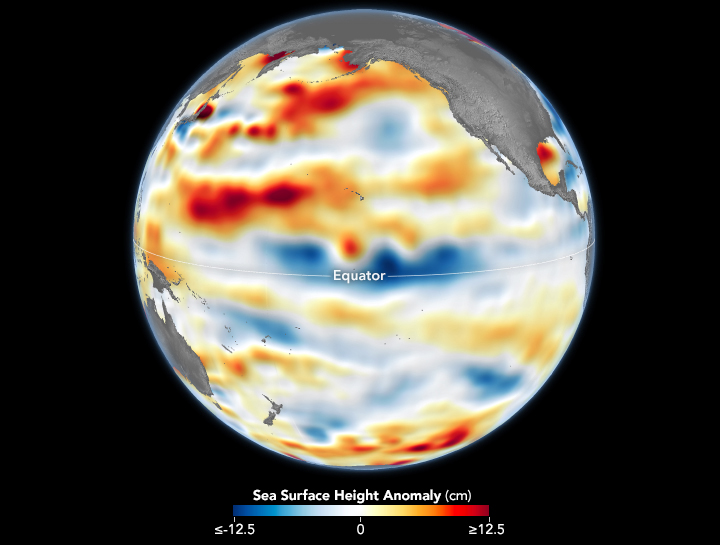
ALT Globe centered on the Pacific Ocean. The west coast of North America is barely visible on the top right and Australia on the bottom left. The globe shows sea surface height anomaly in centimeters. Blue indicates a negative anomaly and yellow, orange and red indicate a positive anomaly. There is a dark blue band along the equator and patches of red and orange above it and at the very bottom of the globe.
In a report from Jan. 9, 2025, @noaa confirmed that La Niña conditions were present, though the Pacific Ocean may return to neutral conditions in spring 2025. “Although La Niña is here, it’s not a particularly strong one.” – Josh Willis, @NASAJPL oceanographer
Earth’s water cycle is shifting in unprecedented ways due to human changes to agriculture systems and human-caused climate change.
The shifts could affect the accuracy of climate models, water management practices, and more.
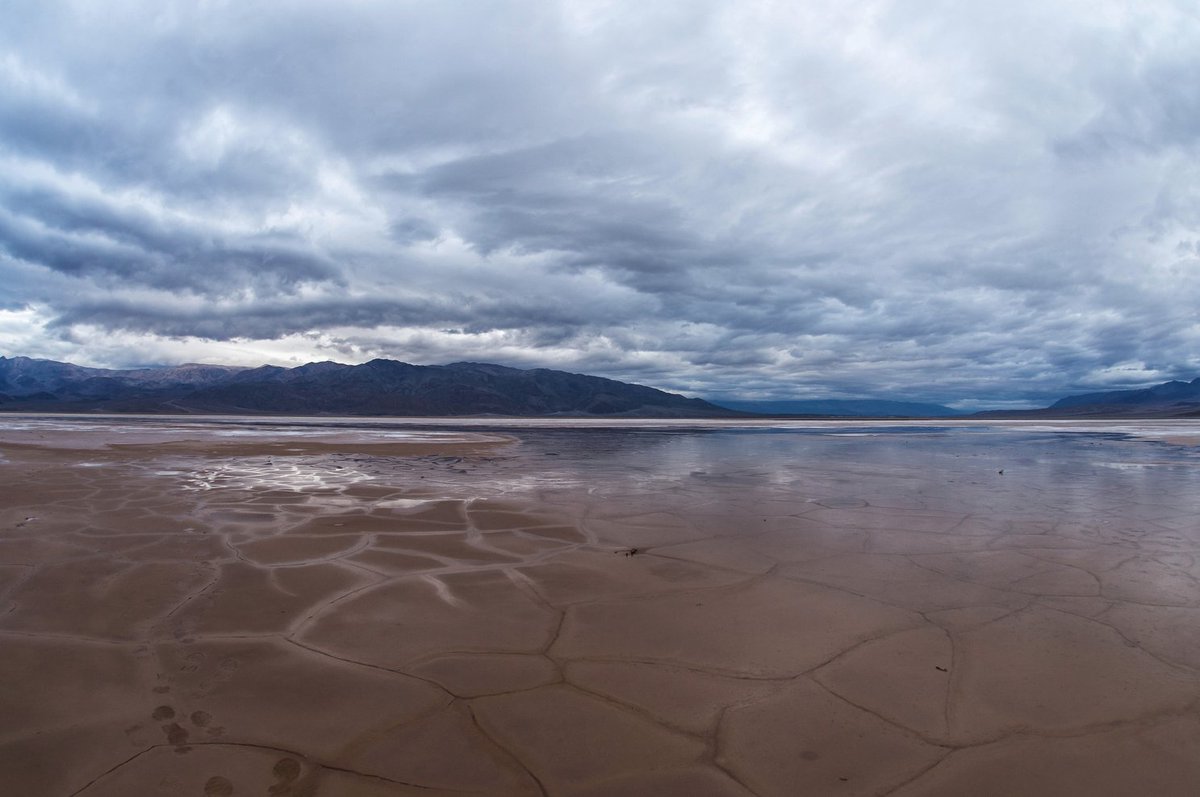
ALT A shallow pool of water over a cracked valley floor underneath a cloudy sky. Photo credit: NPS / Kurt Moses
They found decreasing groundwater reservoirs, shifts in the timing of seasons, and more frequent extreme events by analyzing @NASA satellite data from 2003-2020.
go.nasa.gov/3CEc06H