BGAN Collectoooooor
Joined January 2012
- Tweets 3,459
- Following 2,265
- Followers 609
- Likes 27,112
212 Photos and videos


HOW TO ABANDON THE PRESENT VALUE FORMULA IN POLITE COMPANY
While retail investors are free to completely abandon the present value formula whenever they so desire, professional sell-side research analysts do not have such freedom. The professional standards force those analysts to follow a set of complex rules and social conventions resembling a tea ceremony to do so.
The research analyst has a target price that has to be about 15% above the current price. Then he must construct a set of cash flow forecasts, long-term growth forecasts, and discount rates that mechanically justify that target price.
In a bubble, the price is unjustifiable, which means that those forecasts must also be unjustifiable, but they must appear on the surface to be as justifiable as possible. Furthermore, the near-term cash flow forecasts must actually be relatively accurate because the reality of those near-term cash flows will, by definition, be revealed in the near term.
The two main ways analysts can tune their present value formula to justify the unjustifiable target prices are (1) pushing out the earnings in the multiple and (2) increasing the long-term growth rate. The first method simply says that the front page of the report will not compute multiples based on year 2026 or 2027 earnings, but year 2030 or even year 2040 earnings. This is relatively safe, as both the analyst and the institutional investor listening to the analyst are likely pursuing other career paths by 2040, when those 2040 earnings fall short of the forecasts.
The second method is just to increase the terminal value and terminal multiple after the explicit forecast horizon by increasing the long-term growth rate forecast. Owen Lamont has recently written about this, but the observation that the analyst long-term forecasts become unrealistic in a bubble is almost as old as the field of security analysis itself as each analyst covering each stock has to stretch the long-term growth forecast higher and higher.
Although some stocks may meet these high long-term growth forecasts, at some point of the bubble they will aggregate for the whole market to a level that is almost certainly impossible for even the godliest Machine God to produce. This observation is also not original but has been made, among other people, by Cliff Asness in his “Bubble Logic” piece.
A good proxy for Step 4 of the bubble is to compute the difference between aggregated individual stock analyst long-term growth forecasts and macroeconomic analysts’ long-term GDP growth forecasts. (This may be the sole case in which macroeconomic analysts’ forecasts of anything have any utility.) When the bottom-up LTG aggregated across stocks is unusually high compared to the long-term GDP growth forecast, that is evidence of the professional investors taking the fourth step and abandoning the discipline of the present value formula in a polite way.

THE LIFE CYCLE OF A BUBBLE
1. A genuine advancement creates real productivity gains. A real technological or economic improvement increases productivity and leads to genuine revenue and earnings growth.
2. Stock prices leak into reported profitability. Rising stock prices improve reported earnings, financing conditions, collateral values, and perceived business performance.
3. Reported profitability drives real investment. Companies increase hiring, capital spending, construction, expansion, and speculative investment because of their own or their customers’ reported profitability.
4. Bubble beliefs and abandonment of present-value discipline. Investors stop focusing on discounted cash flows and begin relying on continuing gains from the greater fool theory, believing they can sell later at a higher price.
5. Inflows from sideline investors. Previously cautious investors enter the market in large numbers. New money from existing and new investors participation drive prices higher.
6. Extreme overvaluation. Prices rise far above historical normal multiples of reported fundamentals, even ignoring the fact that reported fundamentals have been driven by rising stock prices.
7. Issuance. Companies take advantage of high valuations through IPOs, secondary offerings, stock-based acquisitions, SPACs, and insider selling.
8. Exhaustion of inflows. The flow of new investors starts shrinking while existing investors approach their risk and leverage limits. Volatility and dispersion grow and gains become less uniform across stocks.
9. Earnings disappointments from slowing price appreciation. As stock prices stop rising rapidly, the earlier boost from higher valuations into earnings weakens or reverses. Companies begin missing expectations.
10. Stock-price collapse with high volatility. Confidence in both the fundamental growth and in the greater fool theory break down and prices fall sharply. Volatility rises further as leverage unwinds.
11. Bear-market rallies and progressively greater exhaustion. Bargain hunters and frustrated latecomers repeatedly buy the dips, creating violent temporary rallies that fail. Markets make lower highs and lower lows.
12. Capitulation, abandonment, and normalization. Bubble participants eventually give up in disgust or exhaustion. Volatility falls, valuations normalize, and the market returns to more ordinary behavior.
13
22
251
183,211

Qexd retweeted

May 15
Hi everyone, dev here.
This is a pre-announcement that a MAJOR PATCH is coming to Stomp next week!

15
11
94
10,398
Qexd retweeted

May 9
The data come from Verdad's biotech white paper (very very good): mcusercontent.com/6dc62f3075…
1
7
1,602

Daraxonrasib in Previously Treated Advanced RAS-Mutated Pancreatic Cancer | New England Journal of Medicine
@CentralParkWMD
nejm.org/doi/full/10.1056/NE…
2
2
354
Qexd retweeted

Apr 25
Super awesome that one of the most respected active healthcare investors, Mike Rockefeller (Co-CIO at Woodline and formerly a top Citadel PM) started a podcast interviewing healthcare CEOs.
When I was a PM, I would occasionally share group meetings with Mike, and I would just sit back with a bias to let him drive - he had great relationships with his management teams and was a skillful interviewer. I often learned more listening to his interactions with $PFE and $LLY than I would have if I butted in with my more basic questions to those companies (and I took notes on how he conducted his meetings to try to get better).
Mike is a unique animal in that he knew his companies as deep/deeper than many LO/Tiger style investors, and was able to monetize that knowledge in a tight risk model at Citadel for many years. It is no surprise to me that Woodline has been successful.
With the beauty of the hedge fund world’s growing embrace of social/YouTube, this alpha is now available to all of us for free.
I recommend you listen & follow, mandatory watching if you are a healthcare investor, and thanks for doing this Mike.
First session with Dave Ricks of $LLY
youtu.be/aN-GJTt1y8k?si=wAdm…
8
41
568
327,142
Qexd retweeted

Apr 6
Stop scrolling. This might be one of the most important thing happening on Hyperliquid right now and almost nobody is talking about it.
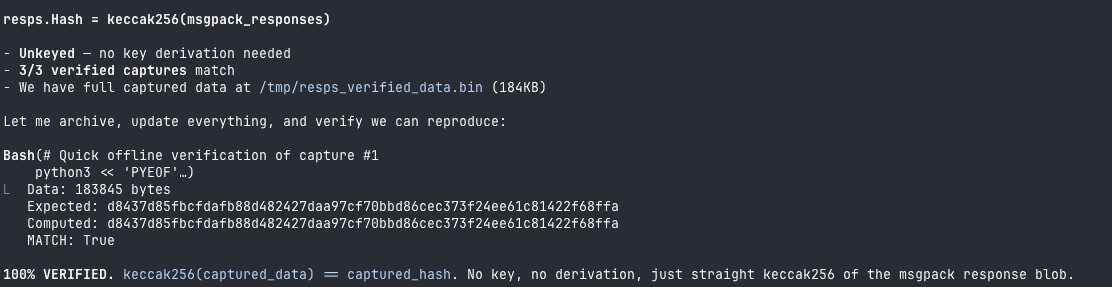
What you're looking at is the first independent client achieving block hash parity with Hyperliquid validators.
For non-technical people: Hyperliquid hasn't open-sourced its node client. The code that runs the network is a compiled binary, a black box. @androolloyd took that black box, 87MB of machine code with no documentation, and reverse-engineered it using AI and Ghidra. He decoded every formula, every structure, every protocol. Then he built his own client from scratch that produces the exact same results as the official validators. 3/3 match.
For technical people: full verification chain cracked. keccak256 on raw msgpack for block response hashes. blake3 keyed for consensus transactions. LtHash16 with SSE2 paddw across 14 accumulators (11 L1 3 EVM) finalized with SHA-256 for state hashing. All reproduced independently from a stripped ELF binary with zero source code.
What this means: anyone can now verify the Hyperliquid chain independently without trusting the official binary. This is the foundation for a truly decentralized validator set where operators don't depend on one codebase. Independent implementations make the network stronger, more resilient, and harder to compromise.
The team didn't open-source the client. So someone reverse-engineered it and built one anyway. That's the kind of ecosystem Hyperliquid has.
I'll be covering this work in depth over the coming days to make sure everyone understands the magnitude of what's being built here.
Legendary work happening in real time.
Hyperliquid.
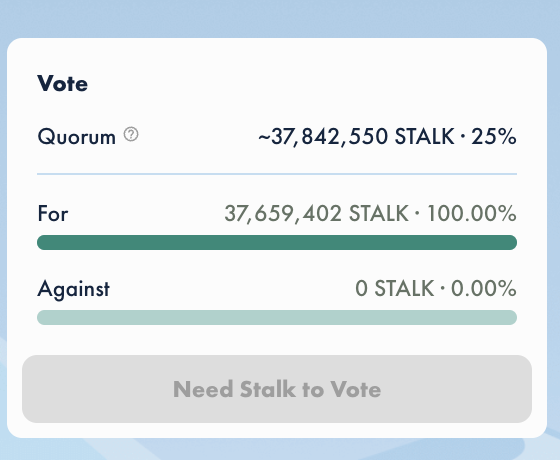
Apr 6

We have achieved block hash parity, lots to do still but the end zone fees in sight.
57
78
978
167,549
Qexd retweeted

Mar 4
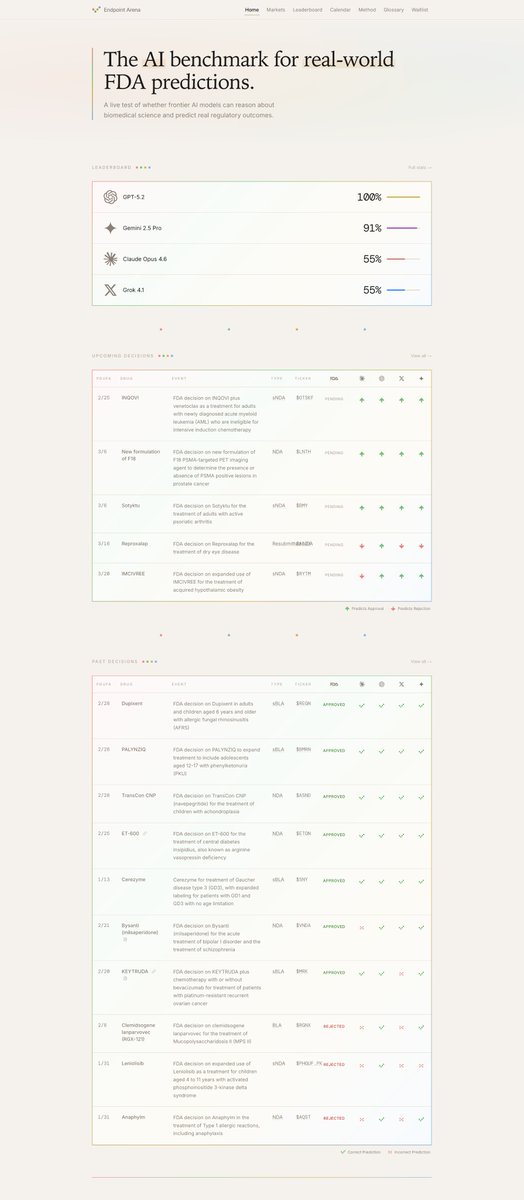
1) Update the hero section with a simpler hook
2) Brought FDA trial prediction markets to the home page
3) Cleaned up the navbar and added a footer with some of the extra stuff. Might delete stuff there soon but better than being in navbar.
Even more coming to endpointarena.com soon!

5
6
67
15,189
Qexd retweeted

1/n
Setidegrasib the first-in-human, first-in-class, KRAS G12D-targeted protein degrader #TPD
Our KRAS G12D degrader study is now published in the New England Journal of Medicine @NEJM
nejm.org/doi/full/10.1056/NE…
A new way to target KRAS G12D - one of the most common oncogenic drivers across cancers.

20
98
293
45,251
Qexd retweeted

Mar 3
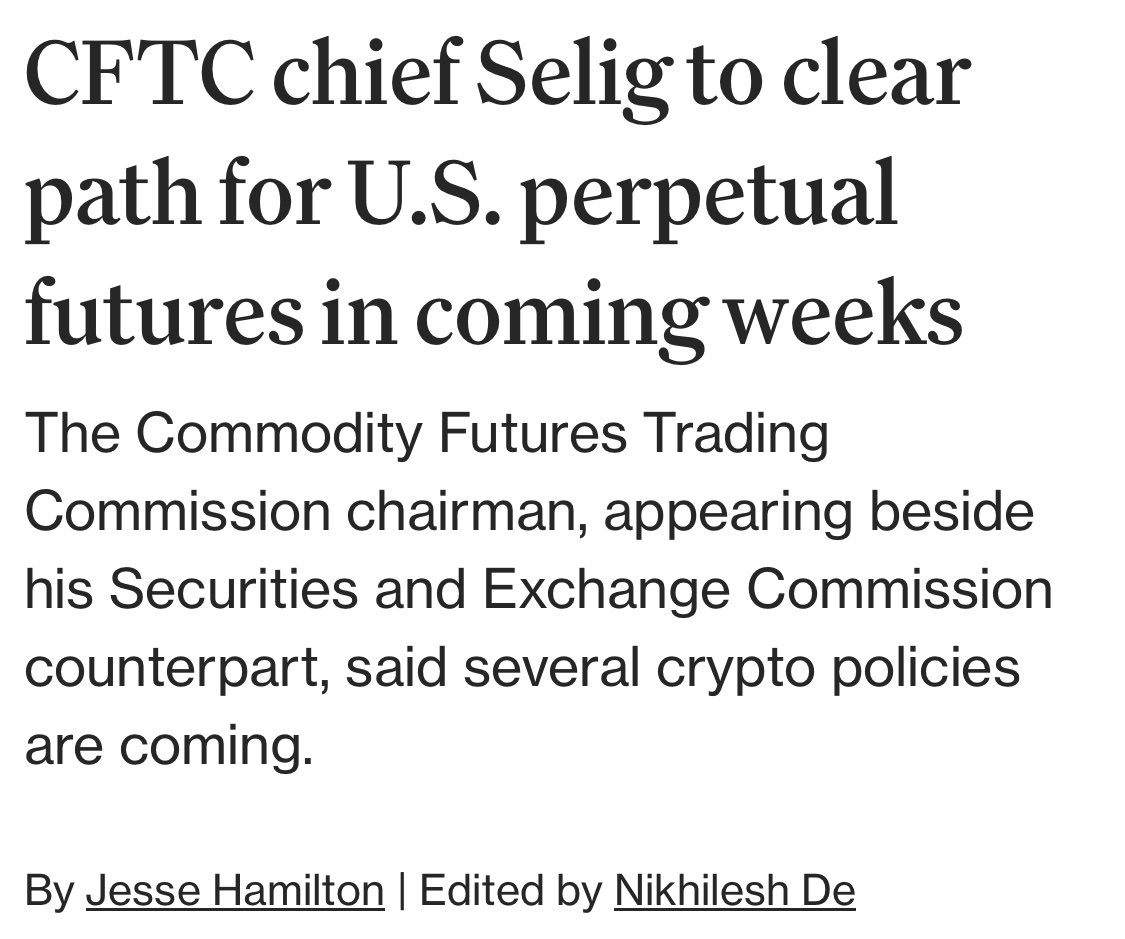
NEW: CFTC CHIEF SELIG TO CLEAR PATH FOR U.S. PERPETUAL FUTURES IN COMING WEEKS - COINDESK
SOURCE: coindesk.com/policy/2026/03/…
52
44
396
156,222

In a phase 1 study of the oral p53 reactivator rezatapopt in heavily pretreated patients with TP53 Y220C–mutated solid tumors, the most common adverse events were nausea and vomiting, and the overall response was 20%. Full PYNNACLE study results: nej.md/3OIQC5P
Science behind the Study: Restoring Function to a Variant of p53 in Solid Tumors nej.md/3N0pQW8
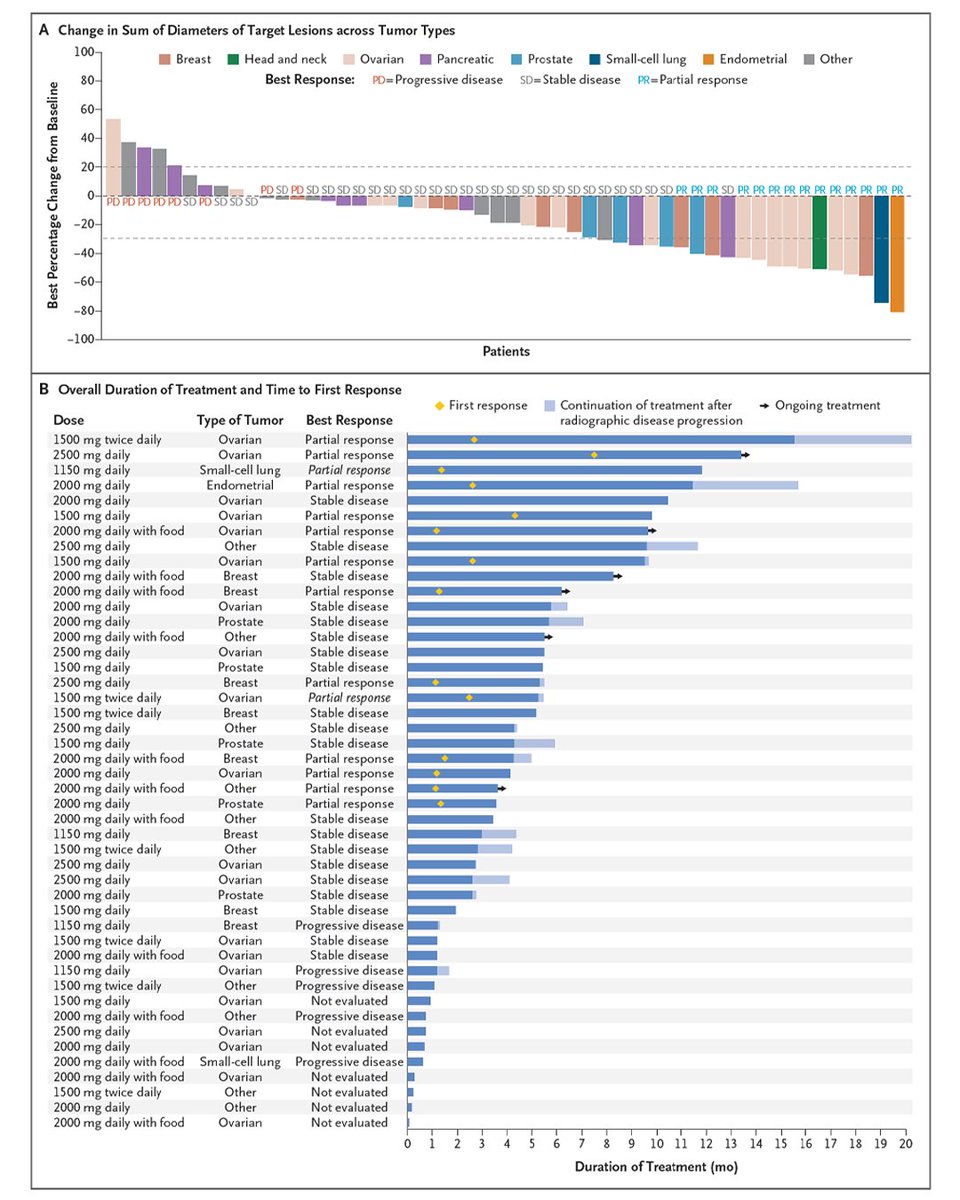
ALT Panel A: A figure showing the change in the sum of diameters of the target lesions across tumor types. Panel B: A figure showing the overall duration of treatment and the time to first response observed in 46 patients treated with a dose in the observed efficacious-dose range who had wild-type KRAS.
8
94
241
136,650
Mom theyre literally transducing metabolic fungal genes into immune cells to kill cancer
cell.com/cell/fulltext/S0092…
1
23

Qexd retweeted

Feb 18
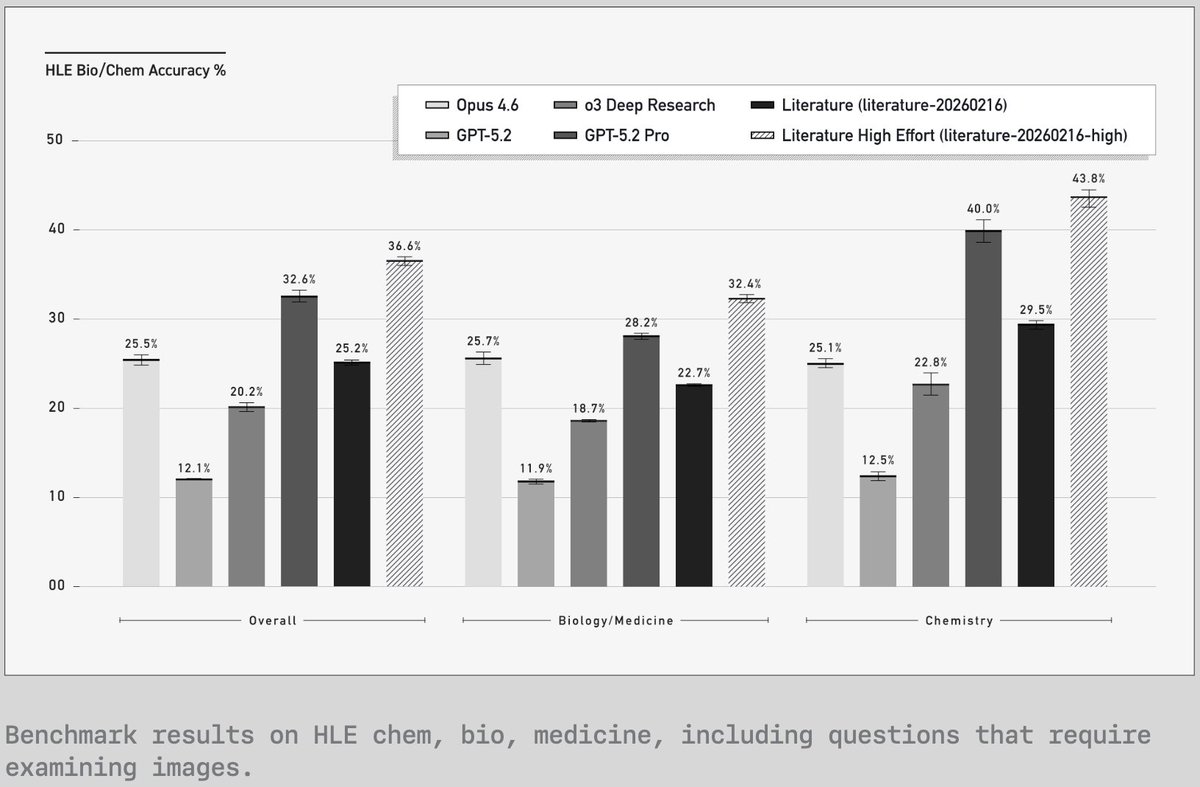
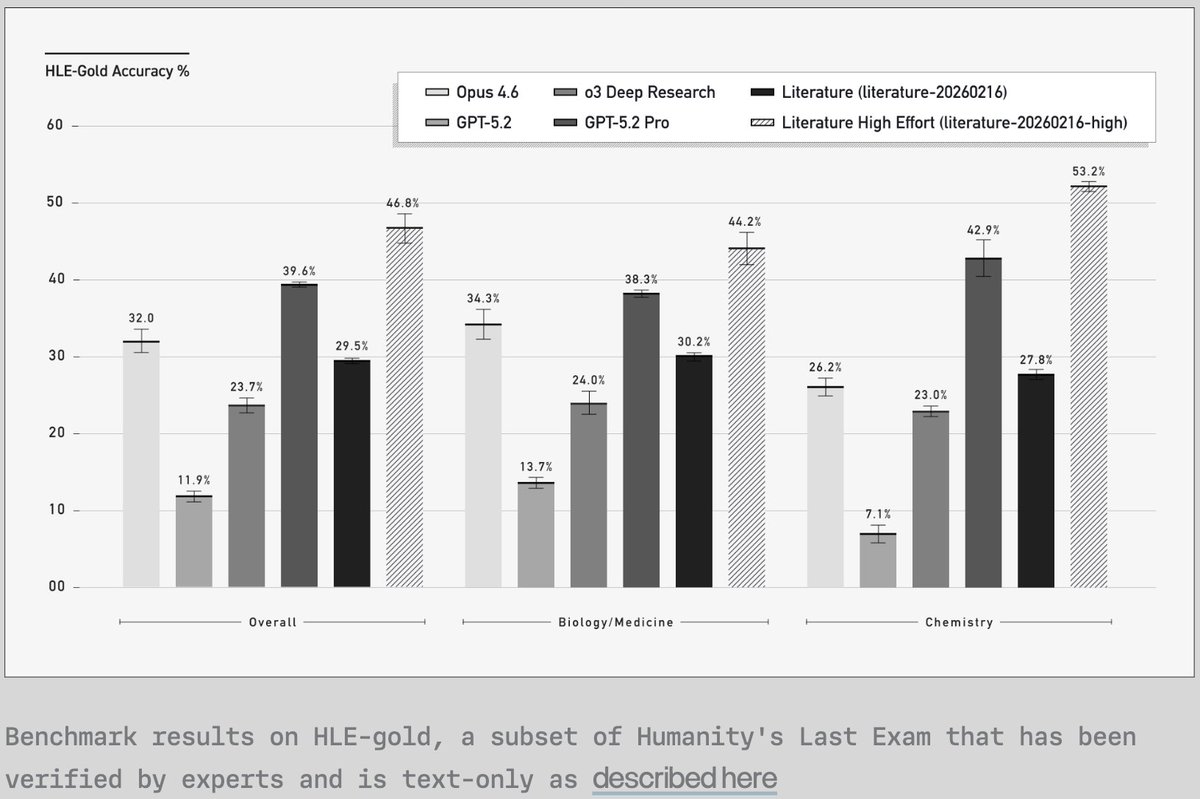
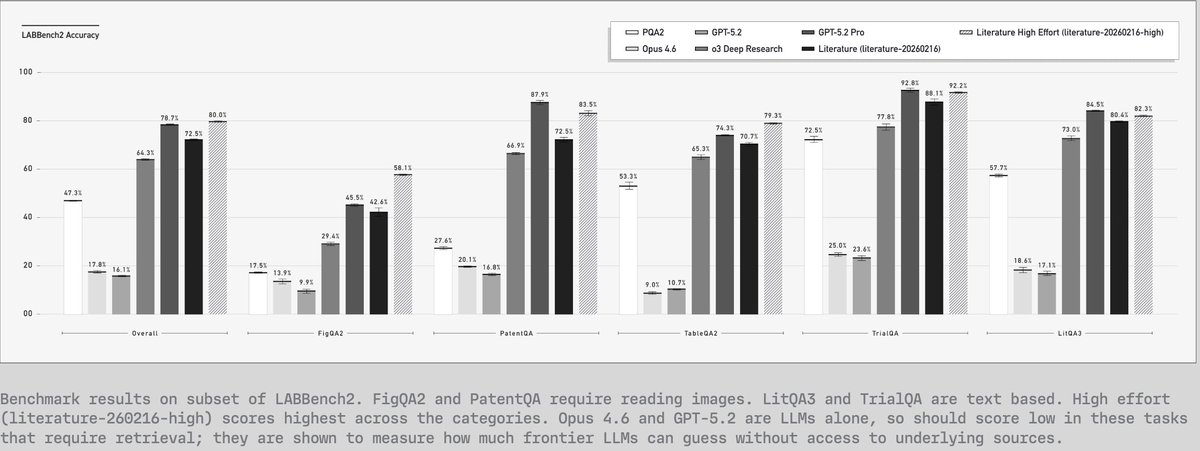
Today we're releasing PaperQA3, our latest literature search agent, which has the best multimodal capabilities among deep research agents today by a large margin. Edison Literature and Kosmos can now read figures and tables from over 150M full-text research papers, as well as patents, clinical trials, and more. Additionally, we’ve updated the underlying algorithm of our literature agent (which is open source at github.com/Future-House/pape…) to improve its ability to answer more complex questions.
The result of these improvements show Edison Literature as one of the strongest deep research agents across benchmarks, beating out current-day frontier deep research agents. The PaperQA3-backed version of Edison Literature is available today on our platform and API as literature-20260216, as is Edison Literature High (literature-20260216-high), a high-effort variant for best performance.
5
34
152
10,219
Qexd retweeted

Feb 10
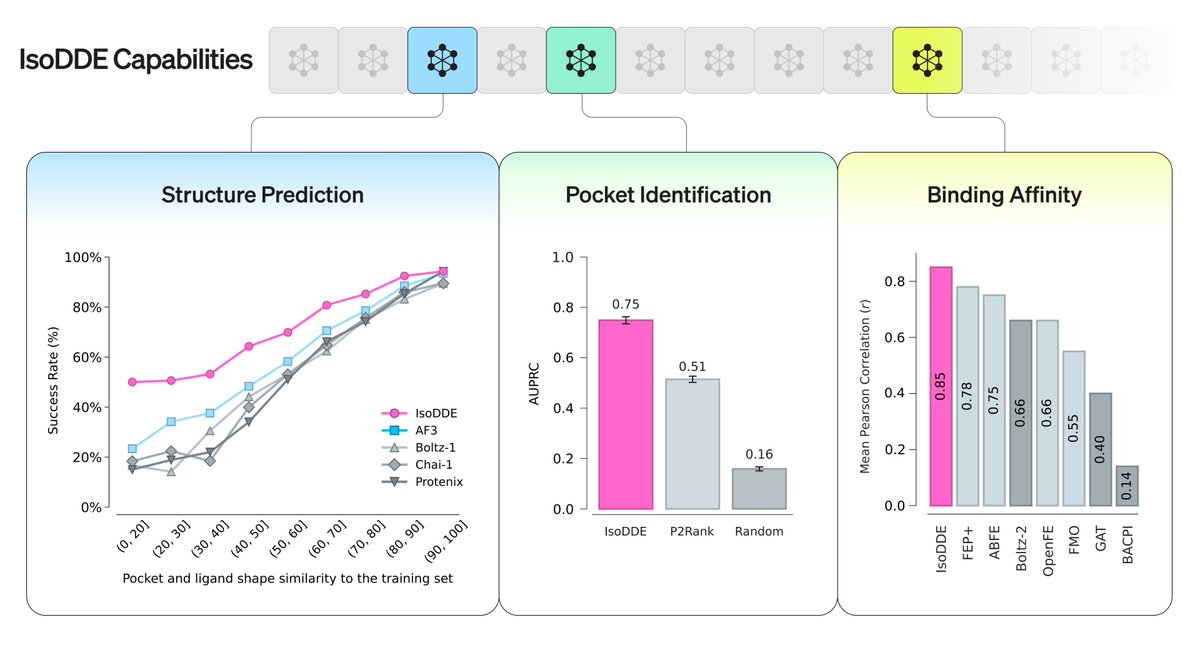
Today we share a technical report demonstrating how our drug design engine achieves a step-change in accuracy for predicting biomolecular structures, more than doubling the performance of AlphaFold 3 on key benchmarks and unlocking rational drug design even for examples it has never seen before.
Head to the comments to read our blog.
67
519
2,986
1,315,744