
Research Associate at Department of Veterinary Medicine, University of Cambridge
Joined May 2012
- Tweets 1,137
- Following 582
- Followers 382
- Likes 232
10 Photos and videos


12 Nov 2025
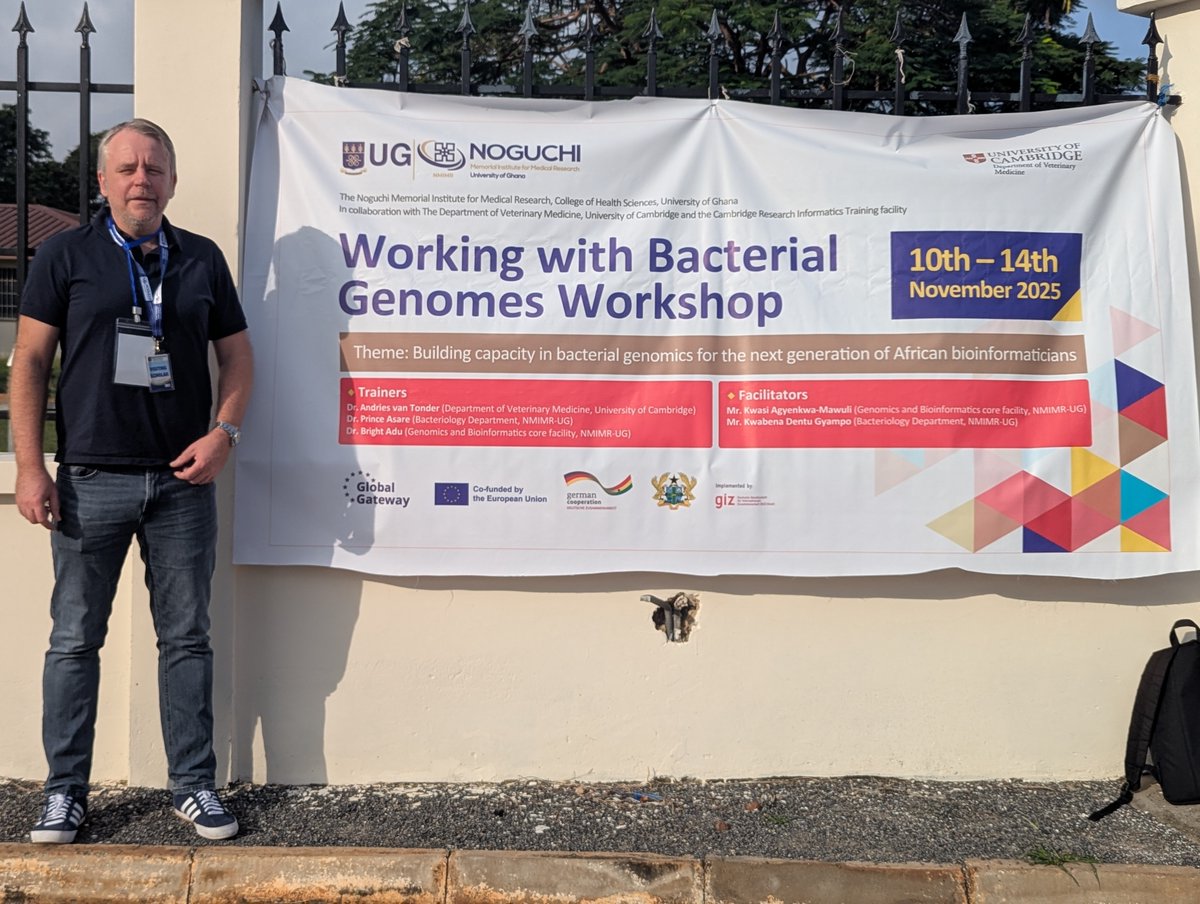
I'm very pleased to be back at Noguchi Memorial Institute for Medical Research helping run our "Working with Bacterial Genomes" course for the first time outside of Cambridge. A big thank you to the funding provided by GIZ, CRIT, Dr Prince Asare and the ongoing support from NMIMR
1
2
55
8 Sep 2025
The next online version of our "Working with Bacterial Genomes" course is now open for registration. We aim to provide you with comprehensive training in analysing bacterial genomes covering everything from QC to clustering plasmids. Sign up here: training.cam.ac.uk/bioinform…
1
1
118
Andries van Tonder retweeted

2 Jun 2025
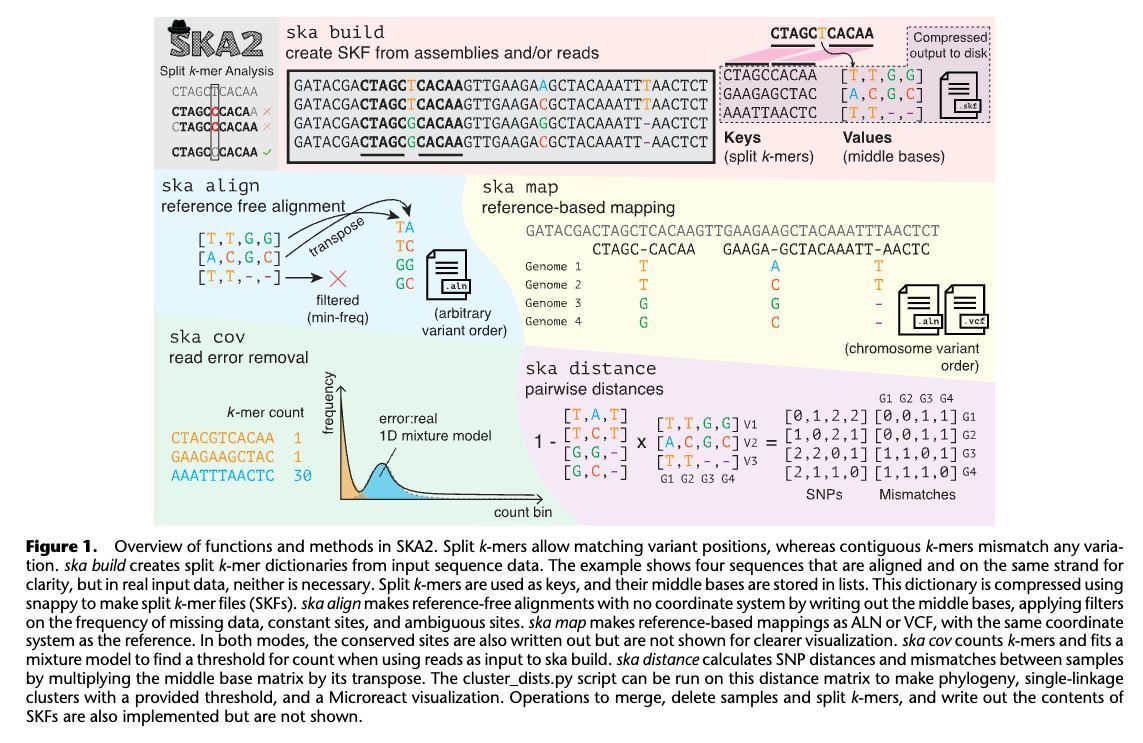
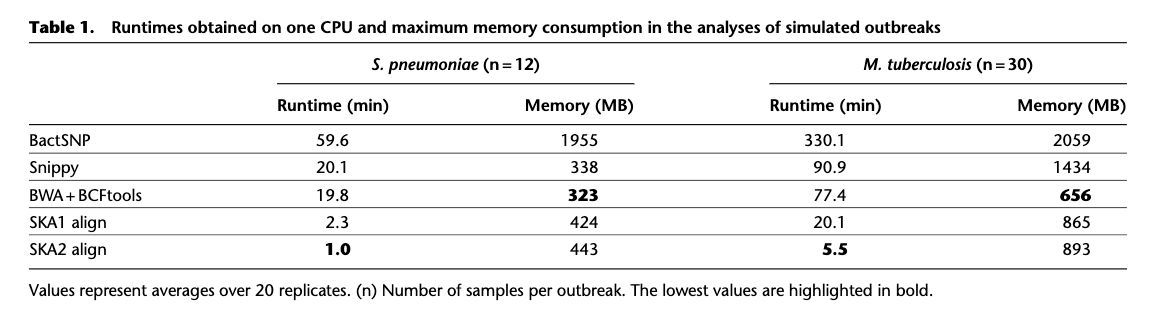
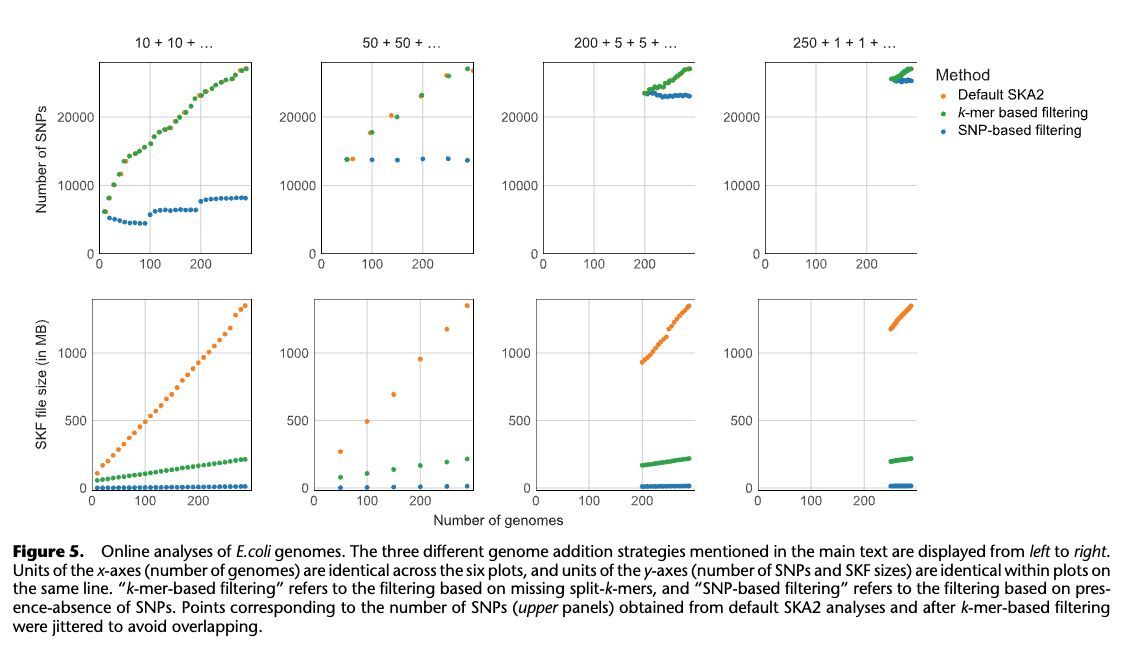
Seamless, rapid, and accurate analyses of outbreak genomic data using split k-mer analysis genome.cshlp.org/content/34/… 🧬🖥️ github.com/bacpop/ska.rust 🦀

4
12
1,286
21 May 2025
We will be running the next in person iteration of our bacterial genomics course in Cambridge at the beginning of July. Please let anyone who may be interested know.
training.cam.ac.uk/bioinform…
2
69
Andries van Tonder retweeted

20 May 2025
🚨 Out now!🚨 Our #OneHealth study on multidrug-resistant #Shigella spread between humans & primates in Albuquerque is live @NatureComms 👉 nature.com/articles/s41467-0… Massive thanks to @NMDOH , @UNMHSC , @LosAlamosNatLab , @abqbiopark , @cabq & lead author @rovinsarahtonin ! 🔬🦠
1
5
6
549
Andries van Tonder retweeted

15 May 2025
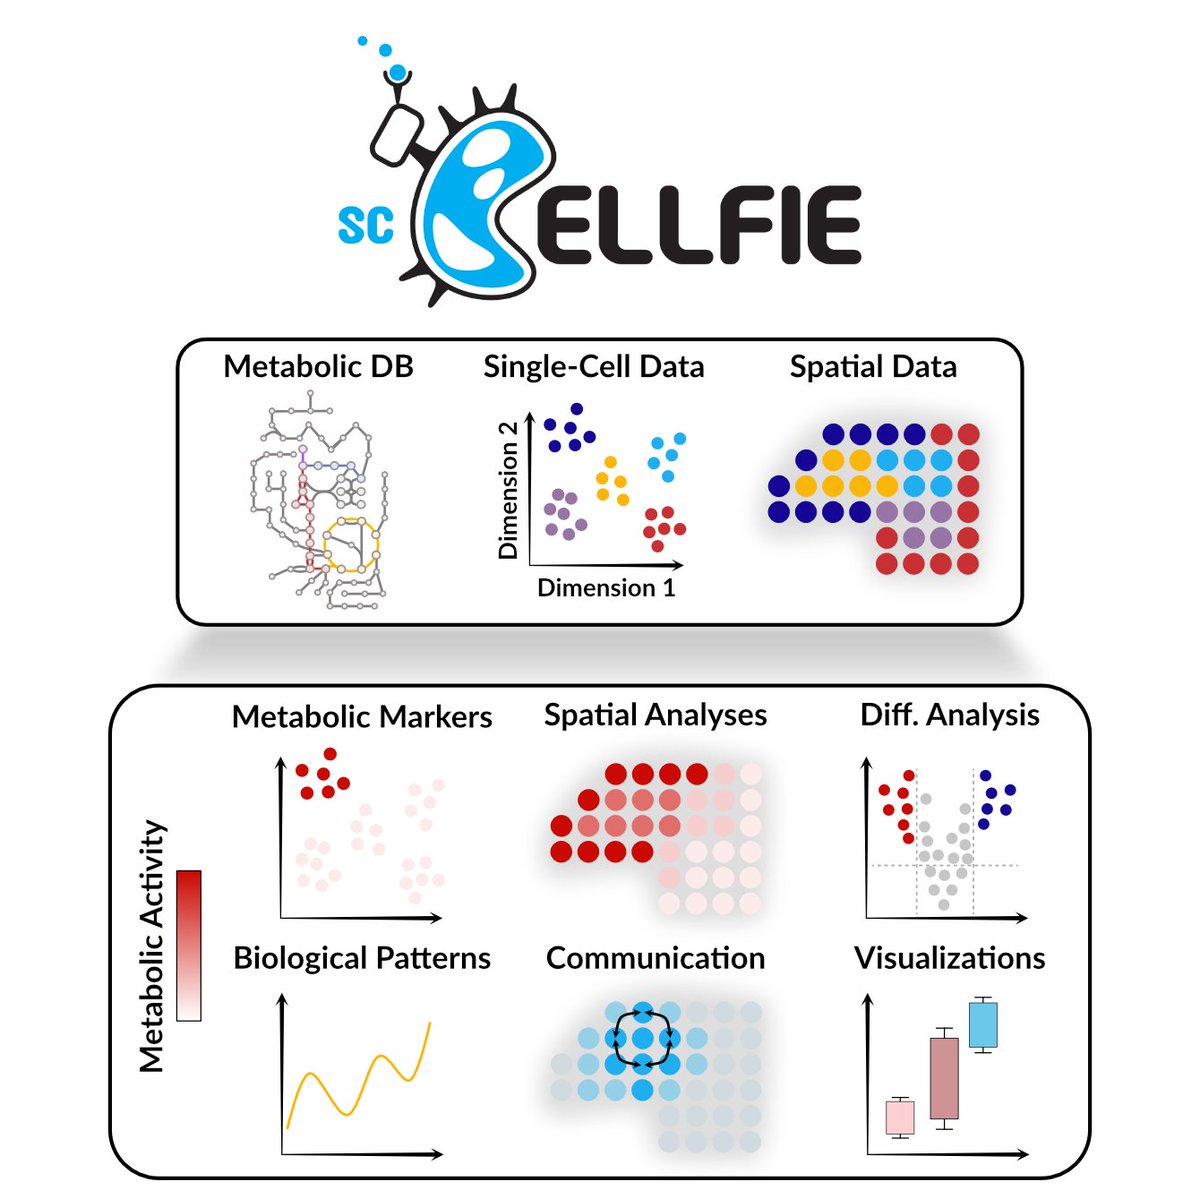
Ever wondered what a snapshot of single cell/spatial dataset can reveal?
scCellFie - a scalable tool that goes beyond gene expression, making metabolic analysis possible
3-2-1 Say GENES🤳
BioRxiv doi.org/10.1101/2025.05.09.6…
TRY NOW sccellfie.readthedocs.io
#DataScience #Bioinformatics
15 May 2025

I’m happy to share that our scCellFie manuscript is finally on bioRxiv — a project that was an amazing opportunity to return to my roots in metabolism!
We infer metabolic activity from single-cell & spatial transcriptomics 🧬
Read the pre-print here👇
📄 doi.org/10.1101/2025.05.09.6…
7
13
1,250
Andries van Tonder retweeted

30 Apr 2025
Don't forget to apply to work with @OxfordBiology @IneosOxford on #Mtb #Bioinformatics and Microbiology.
Deadline soon !
@UniofOxford
#Mtuberculosis #Jobs #PostDoc #Biology #Microbiology #UkJobs
7 Apr 2025

TWO postdoc positions in Computational Microbiology and/or biochemistry. Join our interdisciplinary group in the new Life and Mind Building @OxfordBiology, @UniofOxford, @IneosOxford
Please apply and share this post:
jobs.ac.uk/job/DMP641/postdo…
1
14
34
3,502
Andries van Tonder retweeted

28 Apr 2025
We happily present: “Bakta Web – rapid and standardized genome annotation on scalable infrastructures” @OxUniPress NAR’s Web Server issue
doi.org/10.1093/nar/gkaf335
Easy to use, no registration, fast, various visualizations, in sync with Bakta CLI:
bakta.computational.bio
(1/5)
2
20
45
2,193

Tuberculosis in found dead badgers at the edge of the expanding bovine tuberculosis epidemic. Published: 27 March 2025 nature.com/articles/s41598-0…
1
3
5
481
13 Mar 2025
Another week and more pipeline updates, this time my two assembly pipelines:
Illumina:
github.com/avantonder/assemb…
ONT:
github.com/avantonder/assemb…
Have a try and let me know what you think
1
2
58
Andries van Tonder retweeted

12 Mar 2025
Just updated seqkit, csvtk, taxonkit, and rush.
Click to see changes:
- github.com/shenwei356/seqkit…
- github.com/shenwei356/taxonk…
- github.com/shenwei356/csvtk/…
- github.com/shenwei356/rush/r…
14
63
2,413
Andries van Tonder retweeted

12 Mar 2025
If you have experience in sc/spatial transcriptomics with an interest in microbes....come and join our team as a computational postdoc:
sanger.wd103.myworkdayjobs.c…...
Incredibly exciting datasets on host-microbe interactions in the lung.
Pls RT and reach out if you are interested
2
11
6
1,770
Andries van Tonder retweeted

10 Mar 2025
Super happy to see the new @nextflowio training videos up online.
This is a brand new course for beginners, called #Hello #Nextflow - we've run it a few times and the feedback has been great!
Material is at training.nextflow.io and videos on YouTube:
youtube.com/watch?v=G3CV-FcV…
6
12
644
6 Mar 2025
I've spent some time updating my two Nextflow-based bacterial QC pipelines (bacQC and bacQC-ONT). It'd be great to get some feedback.
github.com/avantonder/bacQC
github.com/avantonder/bacQC-…
1
1
8
223
Andries van Tonder retweeted
6 Mar 2025
🦠🧬🖥️ New Bakta DB v6.0 released!
After a year, it was time for a Bakta database update - and it's a huge one:
- IPS: 330.9M
- PSC: 135.3M
- PSCC: 37M
doi.org/10.5281/zenodo.14916…
👇 1/6
2
21
53
3,589
Andries van Tonder retweeted

23 Jan 2025
Inference of multiple mergers while dating a pathogen phylogeny academic.oup.com/sysbio/arti…
5
15
1,147
Andries van Tonder retweeted

18 Jan 2025
A metagenomic perspective on the microbial prokaryotic genome census | Science Advances science.org/doi/10.1126/scia…
2
27
101
7,118
Andries van Tonder retweeted
15 Jan 2025
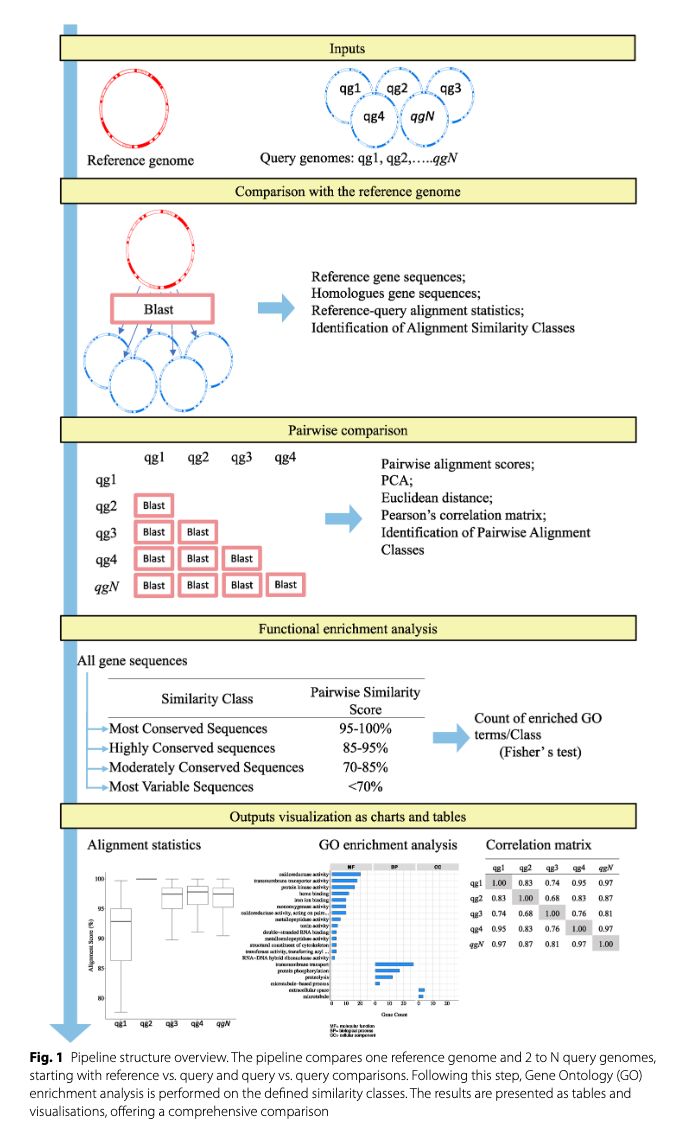
CompàreGenome: a command-line tool for genomic diversity estimation in prokaryotes and eukaryotes bmcbioinformatics.biomedcent… 🧬🖥️🧪 #Rstats github.com/gmoro-bioecopest/…

33
100
7,122
Andries van Tonder retweeted

9 Jan 2025
Need to visualize multi-dimensional categorical data in R? ggalluvial, an extension of ggplot2, makes it easy to create alluvial diagrams and Sankey plots, helping you uncover patterns and flows across categories.
✔️ Plot alluvial diagrams to represent relationships between categorical variables.
✔️ Create Sankey plots to visualize flows and transitions.
✔️ Customize aesthetics, including colors, labels, and node arrangements.
✔️ Handle both wide and long-format data sets with ease.
Whether you're analyzing survey responses, tracking user behavior, or exploring categorical trends, ggalluvial simplifies the creation of clear and informative visualizations.
The visualization shown here is taken from the package website: corybrunson.github.io/ggallu…
Learn more about ggplot2 and its extensions in my online course "Data Visualization in R Using ggplot2 & Friends."
Click this link for detailed information: statisticsglobe.com/online-c…
#VisualAnalytics #ggplot2 #Rpackage #DataVisualization #datascienceeducation #database #rstudioglobal #RStats #DataAnalytics #tidyverse

2
39
250
11,631
Andries van Tonder retweeted
9 Jan 2025
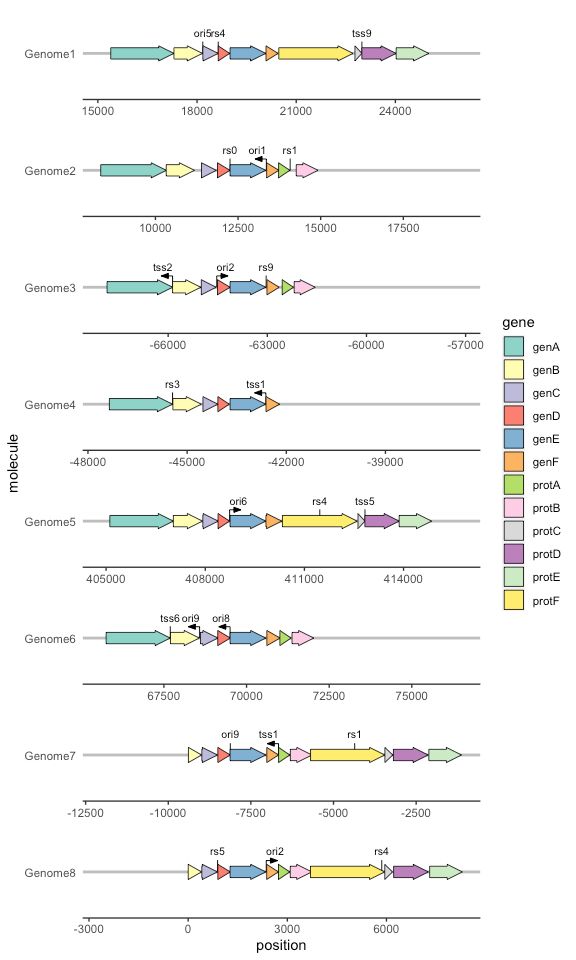
Visualizing gene structures in R? gggenes, an extension of ggplot2, simplifies the process of creating clear and informative gene diagrams, making genomic data easier to interpret and share.
✔️ Plot gene arrows to represent gene locations and orientations.
✔️ Visualize genomic features, including transcripts and operons.
✔️ Customize labels, colors, and layouts for clear presentations.
Whether you're working on genome annotation, comparative genomics, or molecular biology research, gggenes provides a flexible and user-friendly way to display complex gene structures with clarity.
The visualization shown here is taken from the package website: cran.r-project.org/web/packa…
For a deeper dive into creating impactful visualizations with ggplot2 and its extensions, don’t miss my online course "Data Visualization in R Using ggplot2 & Friends!" Click this link for detailed information: statisticsglobe.com/online-c…
#RStats #Rpackage #DataAnalytics #ggplot2 #datastructure #DataViz
3
85
403
30,558